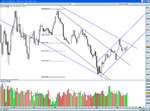
Short FTSE. Tight stop!
That didn't last long.
Short FTSE. Tight stop!
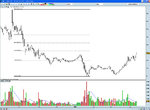
If anyone would like too see daily volumes for other securities, just shout - but for now I'll leave it with Rio and Barc...
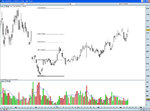
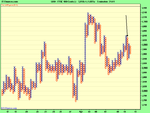
Barc daily. a couple of volume spikes a few days ago, kicked of the current uptrend. price close to 211, 38.2 fib. Volume trend now appears to be down.
Thank you for the hard days work 🙂 Maybe some predictions what awaits us tomorrow??
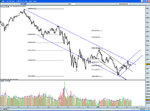
*** me some of you lot need a real lesson in drawing trend lines..
*** me some of you lot need a real lesson in drawing trend lines..
thank you very much geofract
much appreciated
Liverpool V chelsea on at present ...cracking game!!
*** me some of you lot need a real lesson in drawing trend lines..