Wallstreet1928 Analysis & live calls on FTSE,DAX,S&P...aimed to help New traders

Status
Not open for further replies.
S&P


Key trendline being tested right now

can we hold
 

Attachments

  • US SPX500 Daily (19-JUN-09).png
    US SPX500 Daily (19-JUN-09).png
    20.6 KB · Views: 160
Opened my ETX account, ruddy charts never load though! Lets see how long it takes me to burn the £100 they gave me ;)

Congrats on the +100k WS!
 
usdindexchart.gif


this is a daily chart.

I have $82 in the dollar index booked in for a long in the vsUSD pairs.

Might jump into a Gold long there. Things didn't unravel as quickly as everyone expected well maybe they did on Sunday/Monday and thats what closed the tetchy end to the week.

Im flat in Nasdaq/FTSE/DAX/forex/Gold until the trendlines in my charts are broken. I do expect the US dollar index to resume uptrend to $82 so overall outlook is bearish for the indices.
 
Tightest Spreads

Hi,

Could someone please advise where I can get the tightest spread betting spreads .. from the limited research Ive done Capital spreads does 1pt on FTSE and Pro spreads .7 ? of one point on the FTSE ...

The best i can find on the DOW is 4pts ?

Any advice welcome.
 
im still working on the website for next week. trying to output the current time and its all a php nitemare.

theres 2 of us working on it. we might have it ready by monday!!


:sleep::eek::p
 
If Nasdaq is market leader for S&P 500

S&P 500 is market leader for FTSE 100

IF we can work out what the Nasdaq will do next week then that will give us an edge

So lets find out?

Let the analysis begin of all the market leading stocks in order to gain direction

1 month 1 hr charts

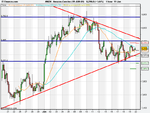
Apple - Bullish - 50/20 MA pushing upwards- mini downtrend broken....13980 gap fill key level
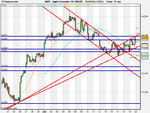
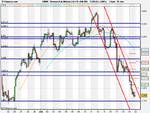
Baidu - Neutral - 50 and 20 MA starting to point down, if key trendline breaks then down
Amazon - tight range - could go either way
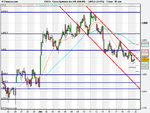
Cisco - Bearish - Clear down trend channel in play , next support 1850
Rimm - Bearish - clear down trend in play, next support 7200
Intel - Neutral - looking like its trading sideways
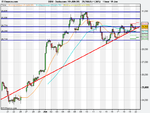
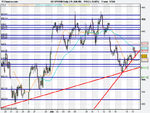
Microsoft - bullish full stop ......has to break 2400 in order to break uptrend
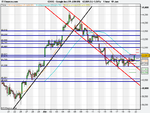
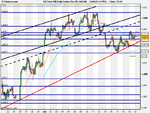
Google - down trend seems to be broken but trading sideways- possible calm before the storm. resistance at 42000, failure here will take us down again to 41330 , break out on upside will take us to 43000

conclusion

2 out right bullish
3 neutral - trading sideways
2 outright bearish


Nasdaq looks like it is going to be rangebound as the stocks analysis above suggest, 1440 - 1470

Nasdaq failure to close above 1470 is a negative sign in short term and next target could be 1450 - 1440 again

I will watch these stocks closely for direction
 

Attachments

  • Amazon.Com Inc (19-JUN-09).png
    Amazon.Com Inc (19-JUN-09).png
    19.4 KB · Views: 96
  • Apple Computer (19-JUN-09).png
    Apple Computer (19-JUN-09).png
    22.1 KB · Views: 129
  • Google Inc (19-JUN-09).png
    Google Inc (19-JUN-09).png
    21.7 KB · Views: 116
  • Baidu.com (19-JUN-09).png
    Baidu.com (19-JUN-09).png
    18.4 KB · Views: 104
  • Research In Motion Ltd (19-JUN-09).png
    Research In Motion Ltd (19-JUN-09).png
    19.3 KB · Views: 105
  • Cisco Systems Inc (19-JUN-09).png
    Cisco Systems Inc (19-JUN-09).png
    20.1 KB · Views: 114
  • US Tech 100 Daily Future (Se (19-JUN-09).png
    US Tech 100 Daily Future (Se (19-JUN-09).png
    21.7 KB · Views: 101
Last edited:
I can see why you left RIM blank!

Stalled at mide range of the huge September gap, now showing bearish divergence RSI and a break of 7150 means it would be in no man's land in the previous gap range, major support not evident until 6000 and then gap could take us down to 4000! But will be interesting to see if the current steep drop is seen as an opportunity to buy by some (or many...).
 
Cisco also showing bearish RSI divergence on the daily. 17.68 strong support (38.2 fib and bottom of small gap) and the most recent upside gap hasn't been filled yet so one to watch but definitely looking like it's hit some kind of ceiling.
 
Intel's a mystery to me at the moment, been ranging 15-16.70 since start of April, anyone going to have a stab?
 
nas100.to bounce between the important area/grey arrow
chart 1..25 day cndle
chart 2 .5 day
chart 3 daily
the advance /decline line is rangebound
no clues here as yet
 

Attachments

  • nas100.daily.gif
    nas100.daily.gif
    7.4 KB · Views: 93
  • nas00.5 day.gif
    nas00.5 day.gif
    8.5 KB · Views: 97
  • nas100.25 day.gif
    nas100.25 day.gif
    9 KB · Views: 92
  • nasadv.tools.gif
    nasadv.tools.gif
    15.2 KB · Views: 93
philly semiconductors also rangebound
1.sox.25 day.grey arrows could be important watch areas
2.sox.5 day
3.sox .daily
 

Attachments

  • sox5day.gif
    sox5day.gif
    9 KB · Views: 108
  • sox.25day.gif
    sox.25day.gif
    8.1 KB · Views: 101
  • sox.daily.gif
    sox.daily.gif
    7.5 KB · Views: 106
30 year treasury bill/yield index.might be the clue
4.4% yield seems to be a magic number

.the bond etf has got itself into a constriction..tip
market witing for something to move it
1.25 day of yield index
2.5 day
3 daily
also weekly tip
 

Attachments

  • Chart of TIP.gif
    Chart of TIP.gif
    8 KB · Views: 100
  • tyx1.gif
    tyx1.gif
    6.2 KB · Views: 110
  • tyx.5.gif
    tyx.5.gif
    8.2 KB · Views: 127
  • tys.25.gif
    tys.25.gif
    8.1 KB · Views: 98
dollar index
1.25 day candles
2.5 day
3.daily
needs to stay baove 80 in the short term
 

Attachments

  • dxy.5.gif
    dxy.5.gif
    8.8 KB · Views: 108
  • dxy.25.gif
    dxy.25.gif
    8.7 KB · Views: 132
  • dxy.daily.gif
    dxy.daily.gif
    6.6 KB · Views: 112
Status
Not open for further replies.
Top