Trading the US the Naz/Mr. Charts Way

Status
Not open for further replies.
Richard

Thanks for your reply which is not at all too long and must be very lucid (despite the wine) as I can easily understand it through a haze of a good but incandescent home made curry washed down with liberal amounts of lager. I do find it very useful (your help that is –not the curry) and very much appreciate both your posts and the answers.

Mr. Charts said:
"resistance"?
-ha ha –Sorry about that. It would probably help my trading if I knew the difference between support and resistance. And this was before the lager.

What you say drives home just how much more I have to do before I’ll be profitable. But its very useful to get feedback such as this to help keep me on the straight and narrow.

Regards

Gerard
 
Tnx, Q.

Glad that helps, gerard.

DJB,
SYMC was like layers of the onion; many things coming together. Since I said it was a no brainer, I'll mention some of the layers, others are reserved and I won't discuss those methods publicly.
SYMC is one of my core stocks and it facilitated one of my basic set up patterns for the day.
The $56 level was potentially significant and its micro behaviour earlier provided the potential trigger for the trade (multiple set up patterns first, then trigger must be activated before trade is initiated).
This may seem complicated, but the methods are sequential, integrated and no more difficult than learning to drive when multiple factors and actions result in recognisable situations producing repeatable reliable responses and reactions.
What are the triggers, that micro behaviour? Again those are reserved but involve reading the tape and level 2 in my own specific ways. Their essence and efficacy is their complete integration and relationship with the patterns I use and the conventional TA which you recognised.
Those triggers (micro activity) enable me to see, with varying accuracy of around 70%-80% of the time, what is going to happen BEFORE it appears on a chart. That is why some of my entries and more often exits appear superficially inexplicable and irrational, but seem almost prescient.
That micro behaviour precipitated the final exit and proved to be correct in the immediate short term as it temporarily bottomed at exactly that level.
Again, the above description makes it sound more complex than it is. Driving in city centre streets absorbing all the dynamic imput of other vehicles, pedestrians, cyclists, road signs etc etc and getting to your destination safely (and profitably if you are a professional driver) provides a reasonable analogy.
It aint rocket science.
Richard
 
Okay Richard,
thanks - I already knew of course that some of your methods would be under wraps, a not too dissimilar sequence to the various cycle predictors where the user is expecting a top or bottom at a specific bar and is in the starting blocks ready for when the turn occurs - I'm not suggesting you are using cycles, just making the point that like in that case you are ready for the trigger to appear and not surprised when it does so. A case of the entry TA I suggested being the last piece of the puzzle.

That your exit was also long planned, and not in response to anything immediately obvious on the chart, clears up the slight nagging I felt when I couldn't see any immediate reason not to run the trade further.

Thanks for that - I'm quite comfy with your obscured layers <g>

Dave
 
DaveJB said:
That your exit was also long planned, and not in response to anything immediately obvious on the chart, clears up the slight nagging I felt when I couldn't see any immediate reason not to run the trade further.
Dave, I think you're missing the point.

Richard exited the trade early because of what he interpreted on the tape, time & sales, price & volume, experience etc.

The fact that is was not the best time to exit is beside the point.

The exit was not 'long planned' - it was a spur of the moment decision. Based on years of experience . However - some work - some don''t.

If it had gone the other way it would have been an even more impressive move.

But all credit to Richard, he stuck to his guns.
 
Richard said..............

"The $56 level was potentially significant and its micro behaviour earlier provided the potential trigger for the trade (multiple set up patterns first, then trigger must be activated before trade is initiated).
This may seem complicated, but the methods are sequential, integrated and no more difficult than learning to drive when multiple factors and actions result in recognisable situations producing repeatable reliable responses and reactions."


Not complicated at all Richard - it makes perfect sense and the trade was so obvious as to warrant the "no-brainer "tag. I just wish I had been watching SYMC at the time. As usual I was twiddling my thumbs watching some other piece of useless s**t.

Do your multiple set up patterns extend back to the previous day's action ? ie. do you see the current day's opening action as a natural continuation of that of the previous day ?
 
Last edited:
Salty,

It may be worth investiagting ways in which you can be alerted to trading setups with a view to potential trades ?


Paul
 
Salty,

Presumably that would involve the use of a good scanner ?

From my standpoint the answer is Yes as that is what I do. What I am interested in is the setup which is all that a scanner can really give you. After that there are a number of other factors that have to come together before a trade is confirmed to being taken much of which I believe that you are already doing.


Paul
 
Okay, I don't think I am misunderstanding...although I won't bet on it....
Richard said the trade was based on multiple setups/earlier behaviour, that to me means (I may explain this badly) the "environment" or conditions existed where a trade became probable - Richard then had one or more events that would trigger an entry... I'd imagine my attempt at TA was close enough at that point, the point being that Richard was ready to enter if the final piece was in place, so whe he saw it in he went.
That earlier micro behaviour, as he phrases it, also suggests that he would have a similar 'trigger' for the exit - as I don't know what the micro behaviour beforehand was, although I'd imagine the low on the 4th might well come into it (I don't have L2 etc so what the rest entails I couldn't say) but I would have thought that either some L2 info was seen that caused the exit, or one of the other factors used to determine the trade in the first place changed.

I think Richard exited because it was triggered, but that his 'micro behaviour' had set him up ready for it, and I also think he was expecting it at that level.

Good grief, as if analysing charts weren't bad enough, now we're analysing MR Charts!

Cheers Tony anyhow, if I'm subsequently proved wrong accept my preapology!
 
Just checked out the ESignal Rally Turbo scanner.

Is it really worth the USD 160 per month they are asking for it ?
 
That add on is $79 'standalone' or $59 with an esignal sub, according to their site - I just looked as I was curious about it - at $160 that must include an esignal RT package doesn't it? (I'd guess the esignal premier stocks version) in which case you're getting the full RT charting and data package.

Dave
 
Hi Salty

Two scanners worth checking if you haven't already are Trade-ideas.com and Marketgauge.com (Hot Scans).
They're ok and much less than Esig's $160 (though I've never looked at Esig's for what it offers).

Ultimately though it depends what you're scanning for.

HTH
 
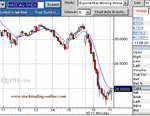
This, as a matter of interest, is the particular trade I was involved in whilst posting on the "Calling all senior......" thread a few minutes ago.

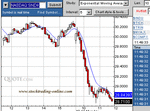
It is very similar to the last one I posted, except that I exited all the position as I could see buying was about to come in BEFORE it appeared on the chart.
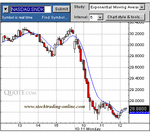
The third chart is what happened afterwards - in fact I just caught the bottom of the move when I covered.
Short SNDK 29.00
covered 28.71
Richard

PS These following remarks are directed only at the people who saw me speak at Bloomberg and more recently with Larry Williams and Jake Bernstein at the Millenium Centre.
Check out a 1 min c'stick chart of SNDK this afternoon and you will see three examples of the JuMBo trade I showed you - every one profitable :)
R
 

Attachments

  • SNDK3rdshort111004.gif
    SNDK3rdshort111004.gif
    13.5 KB · Views: 283
  • SNDK3rdshortcovered111004.gif
    SNDK3rdshortcovered111004.gif
    14.2 KB · Views: 235
  • SNDKlater111004.gif
    SNDKlater111004.gif
    11.6 KB · Views: 263
Just out of pedantic interest, that first bar after 1100 is a white candle, no upper shadow in chart 1 and a red candle no lower shadow in the other two... now, allowing that it is presumably still drawing in chart 1, it doesn't explain how its tail is as low as the white candle 3 earlier in chart 1 (hence the low must be at least down to this level when the candle completes) yet the next two charts show a shaven bottom no lower than the doji 2 bars earlier - what happened to the low to make it jump some 3-4 c?

I take it this was micro at work again Mr C, although there is again a previous bottom at which one might expect the risk:reward to shift against the trade?

Dave
 
QUOTE=DaveJB]Just out of pedantic interest, that first bar after 1100 is a white candle, no upper shadow in chart 1 and a red candle no lower shadow in the other two... now, allowing that it is presumably still drawing in chart 1, it doesn't explain how its tail is as low as the white candle 3 earlier in chart 1 (hence the low must be at least down to this level when the candle completes) yet the next two charts show a shaven bottom no lower than the doji 2 bars earlier - what happened to the low to make it jump some 3-4 c?

I take it this was micro at work again Mr C, although there is again a previous bottom at which one might expect the risk:reward to shift against the trade?

Dave[/QUOTE]

Dave

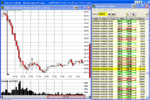
Here's my Money.net data. It shows the lower tail and the Time & Sales shows one trade at $28.75 which causes the low tail. As this is for exactly the same volume as 3 other adjacent trades I wonder if this is a misreporting of a trade at 28.95 and not 28.75. Perhaps esignal are more reliable thatn money net in that they correct misposts like this. Anyone have any ideas on this?

Gerard
 

Attachments

  • SNDK.GIF
    SNDK.GIF
    91.8 KB · Views: 235
esignal 5 minute chart shows shaven bottom, up candle - O:2887, H:2898, L:2887, C:2896
It's a bit of a sidetrack, so apologies for the diversion, it might have been a bar that was subsequently cleaned up for example.... it's just the darndest thing really in that it jumped out at me when I looked at the second chart that something had changed unexpectedly.
Dave
 
Symantec scores 5.9 for its diving.
Just missed getting a full 6, cos it messed its triple-pike.

I have paper-traded Mr charts method. Symantec has given me a notional "recover cost of course" twice.

I am happy. How about you ?
 
Yes Trendie but paper trading with 1,000 shares is nothing like the real thing.

Different forces take over when real money is put on the line especially when it's in lots of 1,000 shares.
 
Salty Gibbon said:
Yes Trendie but paper trading with 1,000 shares is nothing like the real thing.

Different forces take over when real money is put on the line especially when it's in lots of 1,000 shares.

True.
As yet, I dont have the nerve to play with real money, due to the relatively high starting commitment.
 
Hi Trendie,
Anything I can do to help - just let me know - always happy to advise, guide whatever.
Richard
 
Status
Not open for further replies.
Top