Trading the E-mini

It is loitering 1 SD from settlment - how it responds here is key. I reckon it will bounce, test the high then sell-off properly.

Famous last words.....

I'm tempted to use todays action to average into a short position and hold/ work this in the coming days. I know it's holding over weekend etc, but if a gap down occurs Sun night, I want to be positioned already.

The wider market (forex and wornot) currently supporting this view.
 
Last edited:
nice little bounce off the S1 1581.25 it went through by 3 ticks then reacted 12 ticks.
 
just watching the 1st approach to the standard pivots. See 1m chart into S2 1575.00 didn't go a single tick against and at time of writing is a bounce of 20 ticks. Note in the 1m bar green bar off the pivot price moved 6 ticks and the Cum Delta did not move. I think a tick chart is more appropriate will work on that.
 

Attachments

  • pivot scalper.png
    pivot scalper.png
    55.1 KB · Views: 120
So I was watching FESX at the same time as ES was around 75 and the turn on ES looks like it is correlated with FESX hitting hourly RbS. I wouldn't be surprised if the DAX was hitting hourly RbS too.
 
will we get a reaction on the underside test of S1 1581.25? she is close.
 
I am looking at a breakout from a DB on the 5 minute. There could be some fun before the close---but. which way to go?

Been trading the FT, today, which has been good, but the E-mini looks more bearish. now, to me.

However, if one goes, the lot will go!
 
will we get a reaction on the underside test of S1 1581.25? she is close.

looks like it went 1 tick through the pivot then bounced 6 ticks.

so since 2.30pm London we have had

1st approach to S1 - 1 tick against 5 tick bounce
1st approach to S2 - 0 ticks against 24 tick bounce (all the way back to S1)
2nd approach to S1 (after hitting S2) - 1 tick against 6 tick bounce

I am liking the metrics on this already. :LOL::LOL::LOL:

good weekend all
 
uncanny isn't it ?
I've seen it happen thousands of times, but people still diss the idea

yeah it's a funny old thing, pivots are hardly an objective reason to take a trade however if enough of the participants that matter are using them they can become self-fulfilling, the same goes for fibs in some respects. :smart:
 
My thoughts: It's going to hit 1600 before selling off. If this mirrors last year, then it should happen by the end of this month.
 
yeah it's a funny old thing, pivots are hardly an objective reason to take a trade however if enough of the participants that matter are using them they can become self-fulfilling, the same goes for fibs in some respects. :smart:

With regards to using pivots as potential decision points for taking a trade:

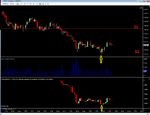
Yes you do point to some nice reactions off them, and this is all well and good (and can be the basis of a profitable approach maybe?) but we still need to have an expectation to really make us stand out in terms of maximising the points available. So for example how do we know (to a high degree) how far price will move? In your examples 1 trade went 6 ticks and the other went 20, so at what point do we cut the trade for profit? What are we looking for as the give away signs?

Yes it maybe possible to just have simple rules like 4 tick targets, and one may be able to do quite nicely from this if the pivots are selected at the right areas.

But the point I think most are missing (not everybody ofcourse) is that it is indeed self-fulfilling. So that means you or I can logically work out that traders are trading at these pivots, so if they are, then I know where they get in, there for, I know roughly where their stops will be (expectation). All I need is to develop a way of determining when the pivot pouncers are no more then its time to knock them out of the game (thus taking your points against them).

We have already seen how there is a massive discrepancy in how far price moves off a pivot, and the fact is that most whom use the pivots are no way near experienced/skilled enough to know when to get out, ultimately been stopped out due to the transparent nature of their trading.

So yes, I'm saying you can be profitable playing a pivot bounce, but you need to be good at what you do, and you will never be able to take the move for what it is.

But I'm prodding others to consider a way to use the pivots to better effect.

In general, one would always want to be on the other side of those trading the self fulfilling prophecy, because they don't know why it works in the first place, so if they don't know why it works, they can never hope to learn where the price will go to or have a target (other than a guess).

I'm not knocking what you are saying BTW, just pointing out that there could be a more effective way to play in these scenarios.

Have a good weekend all.
 
In your examples 1 trade went 6 ticks and the other went 20, so at what point do we cut the trade for profit? What are we looking for as the give away signs?

Time and price breaks on varying TF's?

Good to see you WSW :)

Trading sporadically next week - have some other stuff to attend to. Back in the saddle properly the following week.
 
Last edited:
In general, one would always want to be on the other side of those trading the self fulfilling prophecy, because they don't know why it works in the first place, so if they don't know why it works, they can never hope to learn where the price will go to or have a target (other than a guess).

I'm not knocking what you are saying BTW, just pointing out that there could be a more effective way to play in these scenarios.

Have a good weekend all.

I'm one of those.

I accept that pivots are one of the most common of indicators that traders use. That said, I cannot believe that they are a mathmatical number , but refer to a zone, or area.

How big is that area? It could be considerable but, if the price reverses the pivot pointers will justify their pivot points, somehow!

I do believe, though, that many traders trade them and, therefore, the stops can be significant. Nevertheless, I'll bet that when the price turns, other traders will say, "you see, it touched the 30 bar average" or " it crossed a trendline" or " Venus is in line with the sun."

And, if it does not reverse, they will, wisely, justify its continuance.

Whatever it is, it is in the trader's mind and consistency, or faith, is probably the best way to trade for success. That, and a close watch on risk control, which is a very technical phrase for, don't lose too much,
 
Been watching FESX and ES this morning, trading on sim of FESX whilst watching reactions on ES as well. Very interesting for me to see how they are both correlated. I assume DAX is as correlated to ES as FESX. I am finding FESX very tradeable but it is early days yet.

So what I observed was how ES has traded around 1 SD south of settlement price, forming a bottom over the morning whilst FESX bounced off one RbS level, ploughed through it and then formed a base on a lower RbS level. Watching both indices create a base, knowing that ES was not letting FESX move materially much lower is interesting.

-1, +15 on FESX this morning.
 
Last edited:
I'm tempted to use todays action to average into a short position and hold/ work this in the coming days. I know it's holding over weekend etc, but if a gap down occurs Sun night, I want to be positioned already.

The wider market (forex and wornot) currently supporting this view.

In the words of Tudor Jones.

well that was hard to figure out !
 
Been watching FESX and ES this morning, trading on sim of FESX whilst watching reactions on ES as well. Very interesting for me to see how they are both correlated. I assume DAX is as correlated to ES as FESX. I am finding FESX very tradeable but it is early days yet.

So what I observed was how ES has traded around 1 SD south of settlement price, forming a bottom over the morning whilst FESX bounced off one RbS level, ploughed through it and then formed a base on a lower RbS level. Watching both indices create a base, knowing that ES was not letting FESX move materially much lower is interesting.

-1, +15 on FESX this morning.

FESX and DAX are not exactly correlated with the ES . Just compare the daily charts and you will see ...
 
Top