robster970
Guest Author
- Messages
- 4,567
- Likes
- 1,390
Stopped out - looking for a re-entry confirmation now, Suspect it is now targeting the NVPOC @ 55
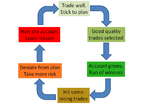
It is viable only if I had planned to trade like this in the first place. Until that time it should be treated as deviation from normal trading behaviour.
if price doesn't hit 55, a short off the Daily level a 52 might be in order ....
Nice trade, Rob 👍
When are you starting your Holy Grail thread??
Peter
Long at 57, trailing it on 30min
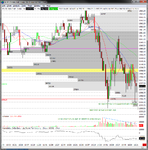
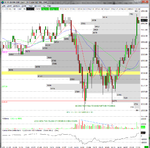
So below are a couple of charts - a before and after if you will. The first chart tries to illustrate an important point (well to me at least) of how price movement works. Essentially we have a failure to make it higher right off the open and a sell-off until support around 56 is hit. Then we get the inevitable bounce and then more sellers come in. What you should notice is how the volume every 3mins is diminishing - this is a clue to the sell orderflow drying up gradually (i.e. less and less sellers coming in). This leads to a final test where no more sellers joined in.
What happens how? Well there aren't any more sellers are there and buying prevails.
This for me is how classic TA (a descending triangle indicating distribution) is gamed to create an orderflow imbalance to the buying side and an obvious opportunity for those with buy limit orders in and around the support level.

I wasn't trading last night (just got back from a short trip away to get married)....
BTW lads, after that conversion about placing an order 20 ticks away and also doing it on FESX, I have been watching FESX for the last week or so. Does anybody actively trade this with say, more than 100 lots? What is the liquidity like as contract volumes seem quite low. Is Eurex reliable - I have heard stories of it going up and down, etc, etc