Trading the E-mini

Ok great thanks I'll watch with interest.

On a slightly different subject are you now entering your orders through Sierra, if so which of the DOM s are you using?

Cheers

I think it is referred to as the TradeDOM amigo. Screenshot enclosed. As you can see, I tried to make it look x_trader 'ish to make switching a bit easier... :whistling
 

Attachments

  • Sierra DOM.png
    Sierra DOM.png
    76.7 KB · Views: 204
  • ES DOM 20130123.png
    ES DOM 20130123.png
    118 KB · Views: 194
Ok great!
Sierra is certainly much improved on when I last looked at it a while ago, and charting and order entry within one package is very tempting.

Am trying to weigh up if adding a Chart DOM would add value or prove distracting as I watch more than one mkt. And of course a whole new learning process as I know nothing about interpreting the DOM info.

Thanks for the reply will watch with interest.
 
As it's easter and the markets are closed, here's some light entertainment...
I've only watched 8 minutes, I've no forms to fill out, I'm not multi-tasking and I'm lost already! How does the tutor know the future grades of his students before he's 10 minutes into the 1st class? Or is that the whole point of game theory?
:confused:
Tim.
 
I've only watched 8 minutes, I've no forms to fill out, I'm not multi-tasking and I'm lost already! How does the tutor know the future grades of his students before he's 10 minutes into the 1st class? Or is that the whole point of game theory?
:confused:
Tim.

He goes on to say that there will be 5 or 6 categories of grades from A+ through to C I might have that a bit wrong.
Then he says there will be an even distribution of marks awarded in each grade. Then he contradicts himself by saying he will then lop off the top group and bottom group and make a fatter middle.

If you ask me....I think he's gaming them all !
 
Watched the first lecture. Never play a strictly dominated strategy.

Watched lecture 2 this morning. What stunningly good lectures.
 
Last edited:
I've only watched 8 minutes, I've no forms to fill out, I'm not multi-tasking and I'm lost already! How does the tutor know the future grades of his students before he's 10 minutes into the 1st class? Or is that the whole point of game theory?
:confused:
Tim.

Lol, that part is not game theory.

Excellent lecturer.
 
Watched the first lecture. Never play a strictly dominated strategy.

Watched lecture 2 this morning. What stunningly good lectures.

Agreed - I'm working my way through them myself.

I think lesson 2 is what will get people hooked if they sit through that much.

Lesson 3 left me totally depressed about politics!

One thing about game theory I didn't come across yet in the vids....

"Zero sum games are purely competitive". That's from a book I read on the subject and would probably cause a 3,000,000,000 (mostly abusive) post thread on T2W....
 
btw - on drugs today, wont be trading.

I was in the gym, Squats first, Deadlifts second. I hate taking the weights off the bar after doing squats, only to put them back for deadlifts once the bar is on the floor, so I decided to take the loaded bar off the squat rack and 'gently' lower it to the floor....

Well, that went well...

Drugs are good, physiotherapist was really cute but not being able to stand upright is a bit of a pain.
 
Agreed - I'm working my way through them myself.

I think lesson 2 is what will get people hooked if they sit through that much.

Lesson 3 left me totally depressed about politics!

One thing about game theory I didn't come across yet in the vids....

"Zero sum games are purely competitive". That's from a book I read on the subject and would probably cause a 3,000,000,000 (mostly abusive) post thread on T2W....

LOL pedro. I too have watched the first 3 lectures, sat there and worked out the medien voter theorem, have started to do the exercises from lecture 3 and have ordered the Dutta book from amazon.....
 
I'm gonna work my way through 2 tomorrow - as I'm supposed be be laying flat on the floor most of the day.
 
So I said I would give more narrative and in order for that narrative to make more sense, this is my daily prep (chart enclosed).

All the levels of interest are marked on here. So you have an idea what they mean:

1) Blue/Red line pair - Resistance band at top of 10d or 5d range
2) Green/Red line pair - Support/Resistance level off the hourly
3) Yellow line - Naked Volume Point of Control (NVPOC) = Liquidity!!
4) Dashed blue line - 5d and 10d mid price
5) Green/Blue - Support band at bottom of 10d or 5d range
6) Pink line - Low Value Node (LVN) - marks the boundary of a value area.

As things get tagged and I hit trades around these levels I will explain their significance although some of it should be obvious.

Also, I do a calculation of 1,2 & 3 Standard Deviations of price away from the previous settlement price. If you look at the levels on these calculations and then look at candidate areas on the chart, you don't have to be a rocket scientist to figure out where confluence exists and therefore that these areas have a higher level of interest to me.

ES Settlement Call Vol Put Vol SD
1555.75 11.41% 12.33% 9.75 pts

Avg Vol
11.87%

3 1584.75
2 1575.00
1 1565.50
0 1555.75
-1 1546.00
-2 1536.50
-3 1526.75

Basically I use a mix of chart, market profile and basic maths to determine where to trade. The reason I do this mix is because my personal understanding of how the market moves is based upon:

a) Time & Price (which can be seen on a chart)
b) Volume and Value (which can be seen on the market profile)
c) Basic Maths (because price tends to revert to the mean)

One important point - these are all candidate areas to trade. I rely upon price action to inform my entry decision and subsequent mgmt/exit. If the PA is not right for the set-up most appropriate to that level, I do not trade. Simple.

This is why screen time is by far the most important factor in trading development IMO. Without it you are simply just not trading 'what you see' and have delegated responsibility for the trade to a series of rules. It does not have to be this way. I do understand why people do this. It is very hard to take responsibility for the outcome of a trade but you can significantly improve your performance by trading or not trading what you see. This is not the same as internalising a loss. Losses happen and they are part of the rich tapestry that makes this occupation so demanding. However if you do incur a loss, it is an opportunity for you to look at the market conditions and yourself to assess whether it is a mistake that you can avoid in the future. Often times it isn't but sometimes it is.
 

Attachments

  • ES-130402-Prep.png
    ES-130402-Prep.png
    139.7 KB · Views: 156
Last edited:
Is that the high tested before it does a little rollover?

e2a 17:35 - have been short from 66.75 for a little while now - I still have faith in this trade.
 
Last edited:
Out at 64 - jesus, another one that I had to work for.

Going to have some food now, proper write up later. I have partly come out because I am so, so hungry.

02/04/2013 16:33 ES-201306-CME Filled Sell Open 1566.75
02/04/2013 19:32 ES-201306-CME Filled Buy Close 1564
 
The 'Strong Rejection' - 60min/30min chart, timed off the 3min

OK folks. So today, I traded a set-up that I refer to as a 'Strong Rejection'. It is identified on either the 60m or 30m chart and is the first sustained rejection of a trend when new 10d highs are being made. It is normally followed by a sell-off which can either be a couple of points or something a little more ferocious. Once in, trade mgmt for me is about identifying the pace of the move and therefore suitable exit targets where I believe things will get sticky. When these work out, they generate a big reward.

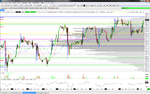
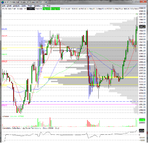
What I have done is annotate 3 charts. Chart 1 is a 3min chart which is my main viewport into the world so we will start there:

(1) The NVPOC for the overnight session is just below the 10d/5d resistance level. My expectation is that the level is going to be challenged today and I expect a new high to be made. Right off the open, the NVPOC at 61.50 was tagged and price stopped 1 tick shy of Support at 60.50. It means business today so even though it has opened out of range, I will not take an immediate reversal off the high as I guess the mugs will short at this point and this liquidity will be hoovered up.

I am seeing no signs of sellers stepping in yet and I have now adjusted my interest to 65.50 which is 1 standard deviation away from the settlement price. My expectation now it that this will be the next candidate reversal point.

Price continued to move up further without abatement.

(2) OK, now seeing signs of sellers stepping in but it is making new highs so am a little suspicious of this.
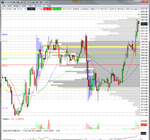
Switch to chart (2)

(3) On the 30min, I see no evidence of sustained rejection yet, nor am I seeing time and price breaks on the 3min. Continue to stand aside. However I do not think it will make it as far as 2 SD from settlement - it just doesn't feel pacey enough to get there.

Back to chart (1)

(4) OK made a high now but it seems to be slowing down, start tuning in.

(5) It has not made a new high now and the second test was about 20mins from the first test. For some reason tests of highs and lows on ES early in the session tend to be separated by about 20mins (roughly) - this fits the bill for me. I can see a time and price break forming here.
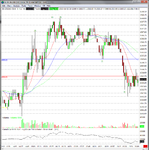
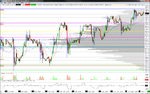
Switch to chart (3)

(6) OK, I've got a strong rejection here on the 30m and I can see clear evidence of time and price break on the 3min. Volume is dropping, buyers are drying up.

Now I take the short and get filled at 66.75.

What happens next though catches me off guard a little. It is heavily base building around this level with about 70k/80k/90k contracts traded around 66.75 here in a very condensed and blocky way. Now most people take this as a continuation pattern but the shape of the base is too 'messy' which tells me this is probably not a continuation pattern at all. The profile is very top heavy and unbalanced and this positively reinforces my view that this is a turn on the hourly forming.

Switch back to chart (1)

(7) OK it finally tags the previous high at 65. This is taking an extraordinarily long time to turn and this base is pretty big for a mediocre kind of day. Slightly suspicious.

Eventually it does go but I have a dimished level of trust to run this trade off the 30min chart, trailing above the high of the previous 30min candle. As it is now forming the extension of the lower value area (rather than a clean break and new value area), I look to see on the chart where the boundary is which is broadly around 63.50. I adjust to this being my target and observe how it behaves here. If it gets sticky, bail, if it plough's through then great.

(8) Got sticky, out. Not helped that it has moved 3pts in 3hrs and I am absolutely fncking starving.

So that is the 'Strong Rejection' when it doesn't quite work out. Now trades like today really try my patience. I much prefer the instant gratification/ferocious move type trade but tbh, most trades are bread and butter ones like this. On days like today there is a lot of listening to my gut for example:

- Questioning whether my call of it being a reversal rather than a continuation and understanding that the crowd will be ignoring the pace of the session and trading the pattern, not realising they are just consuming sell limit order liquidity, carefully laid there to game them.
- Deciding to look for an exit around the previous value area boundary rather than trying to run it for a bigger win, understanding there is no dynanism in the market outside of the initial balance it set in the first 60mins of the session.

For completeness:
Entry: 1566.75
Stop: 1568.25
Exit: 1564.00
Trade duration: Nearly 3 fncking hours!!!

Anyway, any questions fire away - I'll try my best to answer. Also let me know if this kind of detail is useful. It's quite involved writing to this level so I will only do it if there is demand.
 

Attachments

  • 20130402-ES-1.png
    20130402-ES-1.png
    110.2 KB · Views: 131
  • 20130402-ES-2.png
    20130402-ES-2.png
    125 KB · Views: 132
  • 20130402-ES-3.png
    20130402-ES-3.png
    118.3 KB · Views: 132
Last edited:
Today's prep enclosed. This week is going to be interesting for me - normally as we run into NFP trading on Wed/Thu settles down as most of the money is positioned. However theBernanke is talking on Thursday and if he says something 'interesting' which isn't priced in, it may end up moving and subsequently colouring the NFP print on Friday.

ES Settlement Call Vol Put Vol SD
1564.50 10.16% 10.87% 8.50

Avg Vol
10.52%

3 1590.25
2 1581.75
1 1573.00
0 1564.50
-1 1556.00
-2 1547.25
-3 1538.75
 

Attachments

  • ES-130403-Prep.png
    ES-130403-Prep.png
    137.7 KB · Views: 153
201k vol, -4k delta at open.

Nothing exciting for me at the open today. Looking for a downside test for value either to the 60 or 55 area which would tempt me in for a long back up to the high.

e2a: 14:54 - Now waiting to see if the news takes out the 60 level (which I expect it to challenge quite violently). Getting ready to go long once the buyers step in.
 
Last edited:
Long, 58.50, stop 56.50

e2a 15:23 - Now it has stopped rattling around, my strategy for the trade is to leave it and close either around the high or at the end of the session tonight.
 
Last edited:
Top