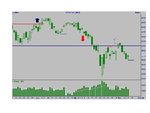
Thursday's session should be interesting. The FTSE printed a bearish in-neck candlestick, while the Dow went in the opposite direction towards the close, forming an inverted hammer. Though it looks bearish to me it apparently has recognised bullish reversal potential, increasing with the length of time price resides above 12257, Wednesday's open, putting a squeeze on the shorters. Seems far-fetched to me and I still see London diving in the am but we could see a rally towards the Dow open. After that - anybody's guess.
You are using an out of date browser. It may not display this or other websites correctly.
You should upgrade or use an alternative browser.
You should upgrade or use an alternative browser.
black bear
Guest
- Messages
- 1,303
- Likes
- 165
Little range or Big range or no................
Ftse in range (hrs) 5786-5862 mar fut, range formed in an old gap 18th-21st 01/08 providing some support and resistance. wider range could also have formed IMO to
if range breaks lower could be 5665 then FEAR factor could set in again,
last call was pants 🙂 up to 6150ish,😱 then 250 ish. Went down instead after failed break higher =
We get to short up there latter on then 😛
good trading all:clover:
Last edited:
black bear
Guest
- Messages
- 1,303
- Likes
- 165
Bank rate decision at 1300, jobless claims in US later. I'll pass on trading untl tomorrow
Split
Hi Split
dont blame you, they are fighting over a 10 pt patch of turf at the minute 😆
have a good one 👍
Bank rate decision at 1300, jobless claims in US later. I'll pass on trading untl tomorrow
Split
Midday
black bear
Guest
- Messages
- 1,303
- Likes
- 165
Midday
Hi KTF
prob spanish time, Split not adjusted for 😛
extra, T2W calender ?????????????????? never right for this one reads 7 am
Turned out a very pleasing day, with FTSE and Dow taking pretty much opposite directions, as suggested by their respective in-neck and inverted hammer candlesticks. For tomorrow, early FTSE reaction upwards looks likely. I have a FTSE buy order not too many points above the Dow's final bell level. The Dow made a doji-like pattern and could show a bullish upswing, which would emphasise any FTSE bullishness into the afternoon. If it does I will place a sell order on the FTSE below the week's close on Sunday night, looking to re-enter the primary downtrend.
Have a good weekend all.
Have a good weekend all.
black bear
Guest
- Messages
- 1,303
- Likes
- 165
Charts
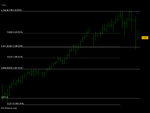
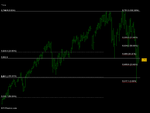
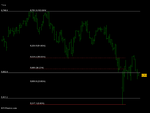
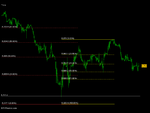
charts no talk, late for film, work them out yourself :cheesy:
charts no talk, late for film, work them out yourself :cheesy:
Attachments
Last edited:
barjon
Legendary member
- Messages
- 10,752
- Likes
- 1,863
Well, here we are then with a potential swing low to test the validity of the possible trend change.
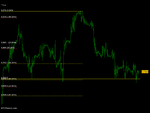
The decline has halted (so far) at around the 5700 level which has provided support a few times lately - and which is co-incident with fib50% retracement. These two factors may have already persuaded some to be long from near the 5700 level but the 3-bar swingers will be looking for a long entry when and if 5805 goes.
good trading
jon
Attachments
timsk
Legendary member
- Messages
- 8,836
- Likes
- 3,538
FTSE Week 6
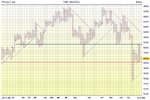
Support: 5700 (horizontal red line) Unchanged from last week
Resistance : 6050 (horizontal bloo line) Unchanged from last week
Far from being out of the woods, a lot of pressure is being put on support with hardly anything in the P&F chart to provide much in the way of optimism for the bulls. Look at the column of bloo 'X's and the ensuing column of red 'O's that fill the range between support and resistance. Blend the two together and visualize the result on a candlestick chart. What you get is an absolute mother of a 'Gravestone Doji'. According to Nison, the term is used in Japanese candlestick literature to refer to the gravestone of the bulls who have died defending their territory! Add this to the final column of three bloo 'X's - the minimum necessary for the chart to print a reversal - and the outlook is pretty bleak. (Anyone unsure of the bearish significance of a reversal comprising of just three 'X's, read my comments on the subject in post #28 from earlier in the thread):
http://www.trade2win.com/boards/uk-indices/28003-swingin-ftse-2008-a-3.html
And, to compound the bearish outlook, the DJIA 50 point P&F chart has printed a double bottom and has only to fill one more box to generate a sell signal. Suffice to say, the bulls really need to build on the current reversal and turn the meagre column of three bloo 'X's into something much more substantial to even begin the arduous task of finding their way out of what appears to be a rather large and inhospitable wood.
Tim.
Status: BULLISH - but only just!. . . it's not out of the woods yet. There is a bundle of resistance overhead and it has a habit of filling large gaps such as the one between Thursday's high and Friday's low.
Tim.
Support: 5700 (horizontal red line) Unchanged from last week
Resistance : 6050 (horizontal bloo line) Unchanged from last week
Far from being out of the woods, a lot of pressure is being put on support with hardly anything in the P&F chart to provide much in the way of optimism for the bulls. Look at the column of bloo 'X's and the ensuing column of red 'O's that fill the range between support and resistance. Blend the two together and visualize the result on a candlestick chart. What you get is an absolute mother of a 'Gravestone Doji'. According to Nison, the term is used in Japanese candlestick literature to refer to the gravestone of the bulls who have died defending their territory! Add this to the final column of three bloo 'X's - the minimum necessary for the chart to print a reversal - and the outlook is pretty bleak. (Anyone unsure of the bearish significance of a reversal comprising of just three 'X's, read my comments on the subject in post #28 from earlier in the thread):
http://www.trade2win.com/boards/uk-indices/28003-swingin-ftse-2008-a-3.html
And, to compound the bearish outlook, the DJIA 50 point P&F chart has printed a double bottom and has only to fill one more box to generate a sell signal. Suffice to say, the bulls really need to build on the current reversal and turn the meagre column of three bloo 'X's into something much more substantial to even begin the arduous task of finding their way out of what appears to be a rather large and inhospitable wood.
Tim.
Attachments
FTSE on Friday gapped up 50pts at the open but fell throughout sole trading until US support. Near-doji, possibly suggesting upward reversal imminent. But candlestick pattern is at least equally a spinning top, with inside range on the S&P only emphasising the market’s indecision at this point. In contrast to the Dow, the FTSE ended well above its low and the preceding low. Early price action is likely to be negative, but probably not showing enormous travel from 08/02’s close.
For early trade tomorrow - FTSE to fall sharply in early trade but not by far, and quickly stabilising to await US direction. I will be short from just below Friday's last price.
Trade I have heard suggested for tomorrow would involve a buy order above and a sell order below Friday's range. Whichever is triggered first, the other becomes the stop. To do this it would be nicer to have an NR7, when the range is narrower and improves R:R, rather then the 100pts we saw Friday, so I will take the buy Jon has highlighted if we breach 5806: if we go the other way I will not chase the price down but await another opportunity.
FTSE catch-up trade - opened short position after 7 and exited with profit just before 8 on Daily Cash. This shows good drop from 7am but needed to be out before 8 and lucky I was cautious as we have been trying to fill the gap since the open.
FTSE swing trade - we might fill the gap up to Friday's close and I will be watching developments for a long opportunity, through the day though I can't really believe we will breach Friday's high so early in the week.
FTSE swing trade - we might fill the gap up to Friday's close and I will be watching developments for a long opportunity, through the day though I can't really believe we will breach Friday's high so early in the week.
timsk
Legendary member
- Messages
- 8,836
- Likes
- 3,538
They failed. Badly. A reversal column of 4 red 'O's has printed today with price sitting at support. A drop of a mere 32 points tomorrow will generate a double bottom sell signal and the chart as a whole will change from bullish mode to bearish mode - with bells on. Based on today's chart, there are two words which perfectly sum up the likelihood of Jon taking his long at 5790 in the near future: 'snowball' and 'hell'!Suffice to say, the bulls really need to build on the current reversal and turn the meagre column of three bloo 'X's into something much more substantial to even begin the arduous task of finding their way out of what appears to be a rather large and inhospitable wood.
Cue a reversal 😉
Tim.
black bear
Guest
- Messages
- 1,303
- Likes
- 165
Ftse and dow in hr trade range
ftse cash support at 700 50% fibby hrs pullback
ftse at lower end of its range and marking up with sb s towards R1 as I typo
dow is the top of its range but as failed to break out
dow fut am hold the key and could give the ftse momentum to break out higher, strond dow open later and .................. mini BULL
Down quick 1st to close the gap then up up up and away
pinbar at 4-5 pm I think, could be 3-4pm :cheesy:
I will return later and find markets have 😱😱😱😱 me again 😛
Attachments
Last edited:
FTSE and Dow printed down days, S&P shows on Sharescope as red for down but is actually inside. But the FTSE shows an inverted hammer, tentatively bullish, while Dow and S&P show true hammer formations, positively bullish. FTSE led south, but US continued north, Dow and S&P closing within 10% of day's high. My preferred stochastics on Dow and S&P turned north today and ae a long way from overbought.
Suggests early FTSE trade tomorrow vigorously bullish, raising distinct possibility of gap higher, rising straight from the open and breaching today's high before the US even opens. I will be long before 8 for the early move as a daytrade and expect to see this confirmed and reinforced by the US, offering chance to go long at 5790 over a longer timeframe.
Suggests early FTSE trade tomorrow vigorously bullish, raising distinct possibility of gap higher, rising straight from the open and breaching today's high before the US even opens. I will be long before 8 for the early move as a daytrade and expect to see this confirmed and reinforced by the US, offering chance to go long at 5790 over a longer timeframe.
black bear
Guest
- Messages
- 1,303
- Likes
- 165
Down quick 1st to close the gap then up up up and away
thats me done I will let you lot have the bullish bit 🙂
remove 1 🙂, getting giddy 1 is enough
good longs if you take them everyone
thats me done I will let you lot have the bullish bit 🙂
remove 1 🙂, getting giddy 1 is enough
good longs if you take them everyone
Last edited:

