You are using an out of date browser. It may not display this or other websites correctly.
You should upgrade or use an alternative browser.
You should upgrade or use an alternative browser.
black bear
Guest
- Messages
- 1,303
- Likes
- 165
Hi Andy -
I'm not used to your charts - what are they? Confused as FTSE100 not at 6055.9.
Hi Tomorton
IG index
did them this morning
After hr price is marked up because Dow had a few good bars in the last hr, so they adjust out of hrs they expect good open monday I guess, they just tend to mirror dow
Use them to post because they are small files, DA ones huge and don"t travel that well.
Incidentally, I've noticed T2W users venting their frustration that their SB (e.g. Fins) locks off the FTSE around 8am so they can see prices changing but can't open / close positions. But they don't lock off the Dow etc. at the same time and these are tradable across the London open without interruption as far as I can tell. Their Dow quotes also seem to track the FTSE quotes at this time but with LESS volatility. So I am thinking it should never be the case that a trader is locked out of a good trade or has to watch an open FTSE position running away.
Maybe somebody picked this up ages ago and can add further observation.
Maybe somebody picked this up ages ago and can add further observation.
Incidentally, I've noticed T2W users venting their frustration that their SB (e.g. Fins) locks off the FTSE around 8am so they can see prices changing but can't open / close positions. But they don't lock off the Dow etc. at the same time and these are tradable across the London open without interruption as far as I can tell. Their Dow quotes also seem to track the FTSE quotes at this time but with LESS volatility. So I am thinking it should never be the case that a trader is locked out of a good trade or has to watch an open FTSE position running away.
Maybe somebody picked this up ages ago and can add further observation.
Yes, I'm with you there. I, often, open a trade on SP500 with Fins in the a.m. so that I can be open when I am not around in the afternoon. I've never, yet, tried to enter Footsie on the open so can't say, but if they are open for the US markets in our a.m. I see no reason why they should not accept trades for Footsie before the open, as well.
Split
Hi Split -
Some SBs are notorious for going over to 'Indicative prices only' or 'Market suspended' or suchlike when markets are moving fast: I had taken this to be a sign they were flapping and hurriedly re-adjusitng their risk exposure.
However, they also habitually lock off the FTSE around the open, which is often volatile, so you can watch prices moving but you can't open or close positions. Now I have a profitable reason to be looking at trades around the FTSE open I have a reason to also record what's happening for future interest.
timsk
Legendary member
- Messages
- 8,895
- Likes
- 3,609
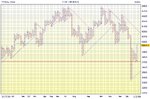
FTSE Week 5
Support: 5700 (horizontal red line)
Resistance : 6050 (horizontal bloo line)
The bearish status has finally come to an end; the P&F chart is now bullish! Following two weeks of wild and uncharacteristic behaviour, the index appears - for the time being at least - to have settled back into 'normal' patterns of movement. The week started with the penultimate column of red 'Os' which printed on Monday 28th. On the face of it, this looks bearish on the P&F chart. I always like to cross check the message on the P&F chart with that given on a bar or candle chart. In this case, Monday's close was well above the H/L half way point, indicating a good amount of buying interest. The close at 5789 meant that the index would only need to rise another 11 points for the P&F chart to print a reversal on Tuesday, assuming it didn't fall to 5700 or below. However, the really interesting day came on Thursday, when the index moved back down sharply to print the final column of red 'O's. Although this generated another double bottom sell signal at 5700 (red support line) the day ended just shy of 5900. This suggested that the double bottom sell signal was a false one which, in itself, is a bullish signal. The very strong close meant that the probability of a new column of bloo 'X's forming on Friday was very high indeed and, more importantly, that a high at or above 5900 would generate the first double top buy signal since mid December 07. The index did not disappoint. However, it's not out of the woods yet. There is a bundle of resistance overhead and it has a habit of filling large gaps such as the one between Thursday's high and Friday's low.
Tim.
Status: BULLISH!!!The P&F chart has, after all, been consistently bearish since 17/12/07, a picture that is mirrored - more or less - on the CAC, DAX and Eurostoxx.
Support: 5700 (horizontal red line)
Resistance : 6050 (horizontal bloo line)
The bearish status has finally come to an end; the P&F chart is now bullish! Following two weeks of wild and uncharacteristic behaviour, the index appears - for the time being at least - to have settled back into 'normal' patterns of movement. The week started with the penultimate column of red 'Os' which printed on Monday 28th. On the face of it, this looks bearish on the P&F chart. I always like to cross check the message on the P&F chart with that given on a bar or candle chart. In this case, Monday's close was well above the H/L half way point, indicating a good amount of buying interest. The close at 5789 meant that the index would only need to rise another 11 points for the P&F chart to print a reversal on Tuesday, assuming it didn't fall to 5700 or below. However, the really interesting day came on Thursday, when the index moved back down sharply to print the final column of red 'O's. Although this generated another double bottom sell signal at 5700 (red support line) the day ended just shy of 5900. This suggested that the double bottom sell signal was a false one which, in itself, is a bullish signal. The very strong close meant that the probability of a new column of bloo 'X's forming on Friday was very high indeed and, more importantly, that a high at or above 5900 would generate the first double top buy signal since mid December 07. The index did not disappoint. However, it's not out of the woods yet. There is a bundle of resistance overhead and it has a habit of filling large gaps such as the one between Thursday's high and Friday's low.
Tim.
Attachments
Timsk -
As thorough as ever Tim and I don't dispute the P&F signals, of all chart signals, they might be the most objective........... but...........it sounds ever so bullish.
For non-P&F people, have you tried flipping the chart over? Sharescope allows this - 'Graph', 'Invert scale' - or 'Ctrl + i' (you can always view a print of your chart from the back against a strong light). Then see how bullish you honestly feel for this week. Useful technique for keeping pattern analysis objective.
timsk
Legendary member
- Messages
- 8,895
- Likes
- 3,609
Cheers Tom - good points. I would like to clarify (although I sincerely hope that regular followers of the thread understand this point already) that the BULLISH / BEARISH status of the P&F chart is completely objective. It is governed exclusively by the direction of the previous double top buy signal or double bottom sell signal. It has nothing to do with my opinion. The strength of a buy signal is enhanced if the dominating trend line is a BULLISH SUPPORT line (blue on my charts) or, in a the case of a double bottom sell signal, the BEARISH RESISTANCE line dominates (red on my charts). Blindly accepting such signals from a P&F chart - or any other kind of chart for that matter - is akin to turning a risky business into financial suicide. Noughts and crosses, candles or bar charts are all fairly useless IMO unless the trader has the skills and ability to delve beyond them to get a handle on market sentiment. The endless argument about indicators on these fine boards and, doubtless, many other BB's all over the internet, makes me chuckle because candles and bars are - to many traders - no different to any other kind of indicator. What makes them different from your EMA's, RSI and MACD etc. is their purity - that they are undiluted. It's a bit like the difference between a glass of freshly squeezed orange juice and a glass of Sunny Delight. I know which I prefer!Timsk -
As thorough as ever Tim and I don't dispute the P&F signals, of all chart signals, they might be the most objective........... but...........it sounds ever so bullish.
For non-P&F people, have you tried flipping the chart over? Sharescope allows this - 'Graph', 'Invert scale' - or 'Ctrl + i' (you can always view a print of your chart from the back against a strong light). Then see how bullish you honestly feel for this week. Useful technique for keeping pattern analysis objective.
Tim.
barjon
Legendary member
- Messages
- 10,752
- Likes
- 1,863
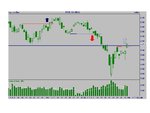
Interesting, tim
As I said earlier, a strict interpretation of the rules would have the swing trend changing to UP when 5973 went and the really bold (who were the only ones to profit from the down move with the more cautious "wait for a 3 bar correction" chaps lucky to break even) will already be long despite the 6000 hurdle nearby.
Me? I've only got the trend change dotted in at the moment and want to see another, at least, close above 6000 before I'm happy. Won't be taking a short either, though, before the dust settles a bit.
The overnight volatility has been high for the last couple of weeks and not nice if you're caught on the wrong side of it.
good trading
jon
Attachments
black bear
Guest
- Messages
- 1,303
- Likes
- 165
Longs
Hi Jon
As per swing rules you follow Jon no other index confirmed change to up yet
Adjust for volitility by reduction in size I think is the order of the day
Best entry is closest to being wrong IMO = short stops triggered over the high = should be worth a +150 pts as they rush for the exit :?:
I see nothing that makes me want to take a long entry, the trend is down unless your on the hrs, looks like a false start to me,:?: overhead R from 8am monday, if it clears last weeks high its going straight into monster R higher up, I am not saying or predicting anything, I am not saying it will not manage it but ...........
LONGS look Wrong to me Jon, they may well have their day or days but I for one would not like to leave them un-attended for LONG on the day time frame
There are no old Bold traders are there Jon :?:😆
good trading next week Jon and all:clover:
Interesting, tim
As I said earlier, a strict interpretation of the rules would have the swing trend changing to UP when 5973 went and the really bold (who were the only ones to profit from the down move with the more cautious "wait for a 3 bar correction" chaps lucky to break even) will already be long despite the 6000 hurdle nearby.
Me? I've only got the trend change dotted in at the moment and want to see another, at least, close above 6000 before I'm happy. Won't be taking a short either, though, before the dust settles a bit.
The overnight volatility has been high for the last couple of weeks and not nice if you're caught on the wrong side of it.
good trading
jon
Hi Jon
As per swing rules you follow Jon no other index confirmed change to up yet
Adjust for volitility by reduction in size I think is the order of the day
Best entry is closest to being wrong IMO = short stops triggered over the high = should be worth a +150 pts as they rush for the exit :?:
I see nothing that makes me want to take a long entry, the trend is down unless your on the hrs, looks like a false start to me,:?: overhead R from 8am monday, if it clears last weeks high its going straight into monster R higher up, I am not saying or predicting anything, I am not saying it will not manage it but ...........
LONGS look Wrong to me Jon, they may well have their day or days but I for one would not like to leave them un-attended for LONG on the day time frame
There are no old Bold traders are there Jon :?:😆
good trading next week Jon and all:clover:
Tim - all understood. And the swing charts for FTSE and US indices look even more bullish.
But Longs look too bold to me too Andy. I have a FTSE Sell order 30 points below Friday night's latest SB quote. Broader outlook extremely bearish but I await developments.
But Longs look too bold to me too Andy. I have a FTSE Sell order 30 points below Friday night's latest SB quote. Broader outlook extremely bearish but I await developments.
black bear
Guest
- Messages
- 1,303
- Likes
- 165
1 :red_india in with sb mar price 6007
full war party = 5 :red_india = 2.5% risk if all in play, looking for re-test of.....err
Lower down
timing spot on again 🙁
Out at 6000 +7
reason, Ohr range low = see if it holds, indian right in the middle of a x fire 🙂
Last edited:
Good morning Andy,
With your new trading facilities can you get into the market before the open? I liked the way the (what I thought) short trade pattern was setting in with the last hour before the open but aftewards the price got away from me.
The Eurostoxx pattern gave an opportunity to short afterwards that Footsie did not give---to me, at least----not that I'm trading Eurostoxx, particularly, but I think it may have given a better signal this morning
Split
black bear
Guest
- Messages
- 1,303
- Likes
- 165
Morning Split
Morning Split
arrrrr got away from me to split, just had one go(scalp) went +8 for a nano second then right back in my face and behind me 😡 closed at scratch on the way back so lost 1 com, looked ifffffffffffffy and was second time above pre marked level = gone in a flash
closed the sb one at +7 so suppose it sort of balances 😕(painters logic)
took lad to school and returned ......😡 looks so easy 10 minutes later
answer to Question
No
8 - 5:30, not done anything outside 4pm in the pm
You can place an order, so I guess you might get filled at a good level thats only traded at for a few seconds, not tried it yet, still in the wait and see camp most of the time.
did once before Crimbo (papertrade get the fill of the year at 7:57 @ S2 ( market order)can"t remember level but it was +120 in 1second 😛
got excited:clap:, then remembered it was only paper money🙁, had a coffee and plucked up the nerve to phone broker
errrrrrrrrrrrrrr would that have counted if real market/trade:?:
NO you daft painter it would"nt, what do you think we do ......... just give money away
errrrrrrr sorry to have bothered you 😱
only kidding he was very polite and informative.
Trades on thread are with sb, longer time frame, smaller stake and seperate bank, well thats the intention 😆 just dont ever seem able to adjust to watching trades go behind me more than once, not in my indian blood Split.
while I am here, if we get above 6020 mar fut, I can see ftse up to 6161 mar fut then 6245 mar fut, I will look to deploy indians in that area with the sb above are just manual drawn S&R (old supply-1st re-visit shows up with the sb charts anyway in the hr timeframe)
more detail Split open this morning @ 6034 straight down to 18 mar fut
Good morning Andy,
With your new trading facilities can you get into the market before the open? I liked the way the (what I thought) short trade pattern was setting in with the last hour before the open but aftewards the price got away from me.
The Eurostoxx pattern gave an opportunity to short afterwards that Footsie did not give---to me, at least----not that I'm trading Eurostoxx, particularly, but I think it may have given a better signal this morning
Split
Morning Split
arrrrr got away from me to split, just had one go(scalp) went +8 for a nano second then right back in my face and behind me 😡 closed at scratch on the way back so lost 1 com, looked ifffffffffffffy and was second time above pre marked level = gone in a flash
closed the sb one at +7 so suppose it sort of balances 😕(painters logic)
took lad to school and returned ......😡 looks so easy 10 minutes later
answer to Question
No
8 - 5:30, not done anything outside 4pm in the pm
You can place an order, so I guess you might get filled at a good level thats only traded at for a few seconds, not tried it yet, still in the wait and see camp most of the time.
did once before Crimbo (papertrade get the fill of the year at 7:57 @ S2 ( market order)can"t remember level but it was +120 in 1second 😛
got excited:clap:, then remembered it was only paper money🙁, had a coffee and plucked up the nerve to phone broker
errrrrrrrrrrrrrr would that have counted if real market/trade:?:
NO you daft painter it would"nt, what do you think we do ......... just give money away
errrrrrrr sorry to have bothered you 😱
only kidding he was very polite and informative.
Trades on thread are with sb, longer time frame, smaller stake and seperate bank, well thats the intention 😆 just dont ever seem able to adjust to watching trades go behind me more than once, not in my indian blood Split.
while I am here, if we get above 6020 mar fut, I can see ftse up to 6161 mar fut then 6245 mar fut, I will look to deploy indians in that area with the sb above are just manual drawn S&R (old supply-1st re-visit shows up with the sb charts anyway in the hr timeframe)
more detail Split open this morning @ 6034 straight down to 18 mar fut
Last edited:
Early selling on FTSE triggered my Sell order on FTSE Daily Cash but I had been expecting 70+pts down, instead we reversed up to the open and I had to get out with a small loss, so today's FTSE catch-up prediction only half-right.
However, we breached yesterday's low, making 04/02 a swing high, so I am short on the March FTSE. An early entry as ever, but happily at 10pts above the trigger point. Expecting US weakness this pm which will allow me to add to position.
However, we breached yesterday's low, making 04/02 a swing high, so I am short on the March FTSE. An early entry as ever, but happily at 10pts above the trigger point. Expecting US weakness this pm which will allow me to add to position.
Further squinting and research shows today's FTSE pattern to be an 'in-neck' candlestick, seen as a bearish continuation signal, confirmed when price action resumes below the low. I have added a sell order below today's low, hopefully to re-inforce the surviving short.