the best and worst of splashy's 1-2-3.
I put up some charts a couple of weeks ago showing how i trade ftse/dax but the charts were all profitable so i had it in mind to show a duffer when one came up just to show the dark side, as it were. Then, yesterday came upon us so it has just occurred to me that it would be neat just to show what can happen, the best and the worst.
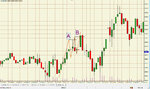
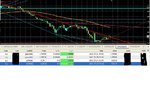
The dax chart is from yesterday and shows almost the ideal day. A steady strend - this could have done with being just a bit steeper early on so that it enables you to get one order out of the way before taking on another, or at least manage the risk as mentioned below. Four trades on Dax, 3 of them takeable. I apologise that the lines aren't in but i took them out this morning to make todays chart up.
Ftse's chart for yesterday was obviously simlar and also had 3 takeable trades out of 4 (but not the same one was invalidated). 8 completed patterns all together, 6 valid trades, 130 odd pips. Some of the currency pairs showed the same steady trend. Days like this happen around once per month and it can be as easy as picking money up off the floor. You just have to consider your levels of risk appetite/money management when holding multiple trades at any one time.
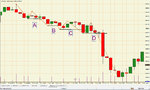
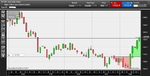
The ftse chart is from thurs 19th and shows the flip side. I think it was Robster that mentioned drawdowns - i haven't really had what i could call a bad sequence but this is what could potentially happen if money mangement is a bit iffy...
A bad day is not when i get no trades - a bad day is when the trades i take go bad. Trade A i took because it triggered on the happy side of the resistance line which i think was the days high. Trade B came very soon afterwards and looked a bit stunted, even had very similar pts 2 & 4 to pattern A. I know i said i trade the system with no discretion but i had forgotten about this bit so apologies there...i do trade with discretion when money/risk management comes into play. Trade B i took but only after it had retraced a few pips. This made the r/r for that trade move from 1:1 to 3:1 and helped me stick within my risk rules. If there had been a 3rd signal, i couldn't have taken it unless pattern A or B could have been moved to b/e. This can quite often happen considering the ftse/dax correlation so thats when you really need the price to be moving along so that risk can be managed, as per yesterday. Both trades were sent the wrong way by the news at 1.30, hence the danger of holding multiple positions without discretion and without 'doffing ones cap' to Mr Risk.