S&P 500 & other indexes - intraday. Plus chat

Morning all

10:00am EUR Consumer Confidence -20 -20
7:00pm USD FOMC Member Raskin Speaks
10:00pm CNY CB Leading Index m/m 1.1%
10:30pm CNY HSBC Flash Manufacturing PMI 48.2
11:05pm AUD RBA Gov Stevens Speaks
 
Ha ha
After 1 hot sunny day loads of people are appearing on TV with white rings around their eyes where they had dark specs on and a tide mark on their necks
:LOL:
 
Already attained my 2% of wedge target.
 

Attachments

  • S&P 500.PNG
    S&P 500.PNG
    115.3 KB · Views: 160
Last edited:
The legal eagles are having a court room fest world wide as Apple and Samsung take their patent battles to Sydney today
 
23rd July

Markets been working its way down overnight. We’ve already been down through the Wednesday low @ 1350. Volume has been relatively high for overnight action. Not huge but above average. I think the day session needs to confirm that volume can trade below there before we start to get longs bailing.

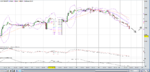
We can see the market has been working its way up gradually (orange arrow) but we failed to get through the top last time which in my opinion (green line), means the larger balance area is in play for another move down to 1300.

7-23-20122-57-33AM.png


So today
- Look for it to move back into Fridays range or attempt & fail. 1356.75 is the overnight high, 1357 is Fridays low, also an LVN, 1358.75 is Fridays close, 1359 is Fridays VPOC, so action around there should be interesting.
- Shake out the overnight longs on the open. Possibly after a weak & small move down.
- Carry on moving down with VOLUME to create a “grit your teeth & jump on it” shorting opportunity

That’s covered up, down & sideways!

Shorts – 1356.50-1357, 1354
Longs – 1339.75, 1335.25, 1332.75

Will also be watching the opening price, especially if we move down off the open & then fail a test of the open price.

If I were a gambling man, I’d say an upside breakout is on the cards rather than a trip downwards.
 
Missed the open - baby stressed out the wife close to breaking point. All made up now.

Got in late-ish and it seems to be going down but a tad slower that when I was watching it before the open. No idea if it's slowed down or not as I wasn't watching it so I got short anyway.

9:37 – got short – big down move overnight, iceberg @ 1337.50, short 1336.75. Sort of a ‘suck and see’ trade. Now hoping to ride a down move if we didn't do it all in the overnight...

7-23-20129-39-49AM.png
 
Here's my version of the tick - it's actually just the regular tick but instead of plotting it the regular ugly way, I just average it. Red arrow is when I entered which looked like the average tick might go positive. BTW - got the idea from a trading book...


7-23-20129-43-48AM-1.png


Under that is the pink 'relative volume' + 237k means 23k contracts above average for the time of day.

Now hopefully will twiddle thumbs as this works it's way down.

Anyone wants these - I have them for NinjaTrader or if you want them for a different platform, I can tell you how they are calculated. I think they make an interesting 'heads up'.
 
Top