my journal 3

putting it together, one more time

I am getting closer and closer to putting it all together, even though once again I don't have a complete formula to summarize the whole process.

We could divide this thing in 2 parts:

1) building the portfolio
2) scaling up and scaling down the portfolio

Building the portfolio

What counts here is picking (profitable) systems with this in mind:
a) % of wins (the higher the better)
b) absolute size of losses (the lower the better)
c) non-correlation of systems to underlying future (the rest will happen by itself, since most futures are correlated with one another).
d) quantity of systems (the more the better)

This works like coins, because if you toss one coin per day, you get heads or tails. But if you toss 100 coins, you are unlikely to get all heads or all tails. Therefore the more and the smaller systems you have, the better, because you'll get closer and closer to your expected value.


Scaling up and scaling down the portfolio

This part, as shown in the previous posts, works like this:
View attachment scaling_up_and_scaling_down_4th_vers.xls

Snap1.jpg

As a summary, you should scale up as your capital increases and scale down as your capital decreases. I think it's called "fixed fractional". At worst you end up with a little less than fixed contracts. But you get a "safe" shot at compounding.

In detail, in the chart above, all 3 portfolios have the same amount of wins, 24, and amount of losses, 18. It's a realistic situation, when things go worse than expected.

Red line
If you handle it the way we handled it with the investors in September, you're going to lose money like we did, despite the fact that we had more wins than losses (and bigger wins than losses). So, after a year of making money, we lost it all in one month, because of the added contracts: one month of losses was enough to wipe out a year of profit: that's what happens when you scale up on your way up, and do not scale down on your way down:

20100614_to_20110926.gif


Violet line
Safe but doesn't benefit from compounding, and only safe if on the way down from a peak. If you instead start falling from the beginning, fixed contracts (just like the previous red line) loses faster than Kelly.

Blue line
Great compounding and safety at once. Optimal method for a system that you expect to make money.

In this situation the blue line makes less money than the violet one only because the losses are so many. We do not expect systems to have such a small edge. 24/18 with win=loss is a profit factor of 1.33. That is not my profit factor. The typical situation is the one you see on the way up. But Kelly is necessary to account for situations where the unexpected happens.

This is what counts. The formulas might be unrealistic and oversimplified but the principle is clear. If things go well, you make much more money. If things do not go well, you lose a little more than fixed. If things go very badly: then you still do better with Kelly than with fixed contracts, because you will decrease the contracts all the way to having 1, whereas fixed contracts will keep them fixed:

if_loss_keeps_going.jpg

The only problem left is to adapt this assumption of infinite divisibility to futures, and to turn this whole recipe into a univocal and unambiguous formula.
 
Last edited:
scaling up/down with monte carlo resampled trades

Continuing from the previous post.

The next step that came to my mind is to use, instead of imaginary trades of +1 and -1, the resampled trades, from my blender, for the presently traded systems.

This is the run of resampled trades that I am choosing, something in the middle between some 93% and 99%, which is 96% chances of survival that I've seen:

Snap2.jpg

It bears a risk of blowing out of 96% in theory. In theory if I had the same future as I had past, I would have a 4% chance of blowing out - without scaling down. This because there's a probability of 4% that I'll lose more than 7k, and I have 10k. And with 3k I can't trade any more, because I don't have enough margin.

Let's see what happens if I assume infinite divisibility of futures contracts, and set this run of trades to be allocated money according to the three types of money management shown in the post above.

I'm gonna have to adapt a few things, to make it as realistic as possible.

[...]

Ok, here it is, on a logarithmic scale:

Snap3.jpg

This says I will own the world pretty quickly. But of course there's a catch, many catches. I cannot do continuous scaling up (nor scaling down) on futures. You can only buy/sell so many contracts before starting to affect prices. And now I have to find a way of checking what exactly happens with the drawdown, margin considerations all that. What's reassuring is that the method with the scaling down is very close to the method of just scaling up (just on the chart, and because of the log scale).

This is going to take a while. I will take a break for a few hours.

[...]

Ok, let's assume a scaling up/down of the selected portfolio every 20k I make/lose. I'm going to use excel's trunc() function. This is good enough, even though it means there's no scaling down right now (for any of the 3 methods). But I need to get an idea of this thing, so I need to simplify.

Ok...

Even with this thing with scaling up/down every 20k, the method of only scaling up returns the most money and without blowing out the account. But this only happens because that probability of blowing out the account is not met at the start. But the 5% probability of blowing out will be met every... 6 months? 8 years? I don't know, but for rule-of-thumb reasons I have already discarded the "scaling up only" method. So I will focus on what I have.

Simplify, simplify, simplify. Discard, discard, discard.

I don't have to write an academic paper.

I'm neither gonna use fixed contracts, nor scaling up only contracts. But before focusing on "kelly method" (scaling up and down), I will post my work here:
View attachment scaling_up_and_scaling_down.xls

[...]

Ok, I had to focus on just kelly, and even this is not enough, because the scale is out of proportion, since it makes too much money. So I am now on just the first 1000 trades - it'd take 20 months for these 1000 trades to happen.

Snap4.jpg

Am I ready to lose 200k up there?

It's worth to compare it with the discarded methods.

Snap5.jpg

Fixed contracts is out of the question. "Scaling up only" always looks good until you come across an unexpectedly long drawdown, so I discarded it.

But at any rate you can see, even if it's not unlucky, that the drawdown in % terms is bigger than for my preferred one, kelly (or pseudo-kelly).

...

I am focusing on the first 600 trades now:

Snap7.jpg

What's clear is the fact that, no matter how unlucky I may have been (it makes no money in the first six months), capital compounds much more slowly because it takes an extra 20k to scale up and multiply the portfolio by one extra unit per system traded, and so capital is much more sensitive at the start, when making 20k means making 100% on the capital invested.

So here's what I'll do: at the start I will scale up/down one system every 2k made/lost, on average (the blender will have the final word). Then later I will scale up not individually but on the whole portfolio (which will have to be the optimal portfolio based on ROI, variability and correlation considerations). Of course it's much easier/safer to scale up/down on a whole portfolio than on individual systems, which could cause the portfolio to lose its balance.

I am done. I feel satisfied.

Here's the final file:
View attachment scaling_up_and_scaling_down_FINAL.xls

I'm gonna take it easy for the next few days. Not much more to create: the systems are there, the assessment of their performance is there, the portfolio scaling up and scaling down is there. It all comes down to these three groups: edge, assessment of edge, portfolio management (scaling up/down). From here on, I'll just need to fine tune these concepts, and, ideally, one day turn this whole thing into one coherent and unambiguous formula.

With the investors I had both edge, and assessment of edge, but we were missing the scaling up/down part (the portfolio theory) and that's how things went wrong. I think now I have all the ingredients. But I still need a univocal recipe - a formula. This is going to take some consulting from a mathematician. I'll have the necessary money only in a few months. Then I'll hire the mathematicians, one at a time, and see if we can come up with something. The majority of them, most likely, will not be suited for the job.
 
Last edited:
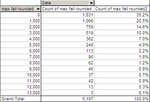
I took it one step further, within the blender, and got it to calculate, with a given portfolio scaling up/down plan, what my chances of future drawdown are in the next 8 years (of monte carlo resampled trades):

Snap1.jpg

It says I have roughly a 3% chance of losing between 30% and 50%. Of course the further I go up in equity, the lower these chances get, because the scaling down slows down the losing, and I can do no scaling down if I am at 10k. So, all the big losses in % terms tend to happen at the start of trading:

Snap2.jpg

But that is also good, because I tend to have more tolerance for losses at the start. And also, I could curb it by instead of scaling up/down the whole portfolio, doing it contract by contract.

This whole thing seems to work acceptably if I scale up/down one portfolio unit per 40k dollars. In other words, when you get to 40k you double up, or better: you start adding them one by one, because otherwise as soon as you fall below it, you have to immediately scale down. Or you double up when you get to 80k and hold them still until you fall back to 40k... many methods which all become alike once you get to a high level of capital, where one step earlier or later doesn't make much difference.

I just posted a chart that shows an objective of 10 billion dollars, but of course I'll be happy if I just make a few thousands per month - without blowing out after 3 months, as happened before, several times.

[...]

Once I get home (I am at work now), I have to try this experiment, to assess, empirically (since I don't know enough math to do it analytically), the effect of scaling down:

1) take the first 500 trades where in the chart and table above you see the great volatility, that you think is due to the inability to scale down

2) repeat those trades for the whole duration of the previous sample, so 10 times.

3) compare the two charts and tables and see how things change.

[...]

Yeah, look:

trades_plus_capital.jpg

This above is a comparison of log returns (y-axis) and max % fall (secondary y-axis), before changing the trades. Since the trades at the start are worse than the trades in the rest of the sample, and, as I noticed yesterday, the big % falls happen at the start. But let's find out how much this is a consequence of the sequence of trades and how much of a lack of scaling down due to limited capital at the start. I do this by repeating the first 500 trades, as described above (points 1, 2, 3). And I get this:

just_capital.jpg

The trades are no longer different and the final capital now goes from 7 billions to just 70 millions, one hundredth. So the first period of 500 trades is that much worse. But that difference is not all that caused the initially high levels of % drawdown.

The mere difference in capital keeps us from scaling down (you can't divide a futures contract in two), and this in turn doubles the drawdown in the first period, with the same trades repeating over and over again throughout the period.

You can also notice that after a while the amount of contracts is so high that it becomes - at least with this sequence of trades - irrelevant whether you have more capital than 100k. By the time you reach that level, the amount of scaling down you can do is sufficient to almost reduce your drawdown in half (25sh% vs the initial 50sh%).
 
Last edited:
Cornish-Fisher Expansion, "R", Package PerformanceAnalytics

I was reading a paper by this person:
Zhipeng (Alan) Yan
Zhipeng

The paper is here:
http://people.brandeis.edu/~yanzp/Study%20Notes/Risk%20Management.pdf

It's actually "study notes" on a book by Hull.

And it turned out that the closest thing I could find to what I am doing is this:
Cornish – Fisher expansion: estimate percentiles of a probability distribution from its moments that can take account of the skewness of the probability distribution.

[...]
But then I got lost in their formulas, for a change, so I searched on elitetrader.com:
Forums - Risk measure taking into account of fat tails...
I used volatility which is based on standard deviation and based on normality assumption.

Any pointers to better risk measure taking into account of fat tails?

I am asking here instead of asking on a Math forum because I am looking for practical and nice solutions, instead of current research papers...
So true!

Here's what one user replied:
Read R: Econometric tools for performance and risk analysis. -- especially the section on VaR -- and then make use of his free, open-source Cornish-Fisher functionality, if you're so inclined.
Then I searched on riskglossary.com:
Cornish-Fisher Expansion
The Cornish-Fisher expansion is a formula for approximating quantiles of a random variable based only on its first few cumulants. In finance, it is often used in value-at-risk (VaR) calculations.
On wolfram.com:
Cornish-Fisher Asymptotic Expansion -- from Wolfram MathWorld
http://library.wolfram.com/infocenter/Articles/6670/alchemy.pdf

Of all these things I found, I think the closest to what I need is the link found on that elitetrader.com's thread:
R: Econometric tools for performance and risk analysis.
Description

PerformanceAnalytics provides an R library of econometric functions for performance and risk analysis of financial instruments or portfolios. This library aims to aid practitioners and researchers in using the latest research for analysis of both normally and non-normally distributed return streams.

We created this library to include functionality that has been appearing in the academic literature on performance analysis and risk over the past several years, but had no functional equivalent in R.
Many of the things Peterson and Carl say on that link ring a bell. For example:
We have also included a function to compute the KellyRatio. The Kelly criterion, properly applied, will maximize log-utility of returns and avoid risk of ruin. Utilizing the Kelly Criterion to determine leverage or investment size on a strategy is guaranteed to avoid risk of ruin and eventually (over a long enough time horizon) create wealth, but it may be incredibly volatile, with a N% chance of being down N% at some point in time. Even when an investor or analyst does not intend to utilize the Kelly criterion as part of the investment sizing strategy, it can be used as a stack-ranking method like InformationRatio to describe the “edge” an investment would have over a random strategy or distribution.
This is exactly what I've been doing in the last 48 hours.

There's a lot more on that website than the quoted page. These are other important links on their software:
R: Econometric tools for performance and risk analysis.
Index of /brian/R/PerformanceAnalytics

Maybe there's even too much. I'm gonna try to download their software before I get too scared of the amount of material to read.

Ok, here's all the info on the download and related files:
CRAN - Package PerformanceAnalytics

Something related here:
R-Forge: ReturnAnalytics: Project Home

Manual here:
http://cran.r-project.org/web/packages/PerformanceAnalytics/PerformanceAnalytics.pdf

I think I need to install "R":
Download R-2.14.2 for Windows. The R-project for statistical computing.

R (programming language) - Wikipedia, the free encyclopedia
R is a programming language and software environment for statistical computing and graphics. The R language is widely used among statisticians for developing statistical software[2][3] and data analysis.[3]

R is an implementation of the S programming language combined with lexical scoping semantics inspired by Scheme. S was created by John Chambers while at Bell Labs. R was created by Ross Ihaka and Robert Gentleman[4] at the University of Auckland, New Zealand, and now, R is developed by the R Development Core Team, of which Chambers is a member. R is named partly after the first names of the first two R authors (Robert Gentleman and Ross Ihaka), and partly as a play on the name of S.[5]

R is part of the GNU project.[6][7] The source code for the R software environment is written primarily in C, Fortran, and R.[8] R is freely available under the GNU General Public License, and pre-compiled binary versions are provided for various operating systems. R uses a command line interface; however, several graphical user interfaces are available for use with R.
I've installed R and I've installed their package, but it's not like this thing is as interactive and user-friendly as my Microsoft combat flight simulator.

I don't know if I'll make it through this thing. It seems quite complex. No one is helping me as usual. I know several math people, but all lack the motivation. I lack the knowledge.

I'll keep browsing through this thing to see if I can gather some useful ideas at least.

Ok, I think I have to download "Zoo" and "Xts" as well:
CRAN - Package zoo
CRAN - Package xts

I did, and installed them. But I still understand nothing. Hey, and these are supposed to be the user-friendly guys, who read all the academic papers and put it all in one simple R package for me. And no one helps me.

However, I shouldn't give up because this is the first time that I find a package that puts together:
1) academic papers, which I've been reading for months
2) probability theory (been reading for months)
3) statistics (been reading for months)
4) kelly (been reading for months)
5) sharpe ratio
6) Modern Portfolio Theory and markowitz

This package puts everything together and that's what I was looking for, so what do I do now? Do I ask for help to some of the math guys I argued with because they told me that -2^2 is equal to 4?

[...]

Ok, I found a tutorial:

R Tutorial #1 - Download, Installation, Setup - Statistical Programming Language R - YouTube


Ok, I made it and installed the Package PerformanceAnalytics:

Snap1.jpg

I had to stick the whole folder into the library:
C:\Program Files\R\R-2.14.2\library

Now I'll take a break. I think this is going to take a few weeks. R is definitely not very user-friendly. It's programmer-friendly, but not user-friendly.
 
Last edited:
My boss has taken to abruptly bursting into my room lately, without knocking even. Very annoying and disturbing, but there's a "but", and I'll explain why I am not complaining to him or to anyone.

I wish he told me what he wants to communicate to me by doing that. Since he's a bit of an idiot, I am not even sure he's doing it on purpose, or that he knows exactly why he's doing it.

All in all, I am pretty satisfied with the present situation, though, so I am not going to get confrontational. The reasons I am satisfied are:

1) my boss is letting me stay into a single room practically, since my roommate has been away for over a month, sick - maybe due to the voodoo thing I did on him, wishing him a long hospitalization. But it didn't work on vito, so maybe it's just the god of randomness. Maybe the boss is subconsciously pissed that I am all alone, with the door closed, in a room, and he knows that I might be studying my own stuff: yesterday he caught me doing equations - which is not really equivalent to watching pornography or playing some video game... at any rate he never told me anything, about anything I ever did, but I suppose he might resent the fact that i clearly study my own stuff, big time, all day long. That is to say, after I am done with all the work.

2) boss has a live and let live attitude, so he's not overloading me with work, and that is why lately I've been able to study portfolio theory for about 2 hours per day.

So, all in all, it is not safe or convenient to get confrontational, because he could at any time, and within his rights, move me to a crappy room, with 10 other people, or dish out enough work to fill up my six daily hours here. So i am not complaining. I am just reasoning on why he is doing it and if I can do anything to make him stop, because it bothers me. Even asking him would not be safe, because everything else is just perfect and I have everything to lose from getting into a fight with someone because he bursts into my room twice a day, and only has been doing it for a few days.

...

Yeah. I am pretty satisfied. All alone in a room, with two encounters per day with the boss, who tells me to do something I'm already doing, or comes here for almost no reason... practically I am doing everything I need to do by myself, I don't even need to meet him, but maybe that's why he's bothered by this - the fact that I am having it so easy, and that he's not really ordering me to do anything ever. If this is the price I have to pay for being able to study my own thing, and being left alone for the rest of the day, then let's welcome these crazy interruptions by him.
 
Last edited:
Continuing from here:
http://www.trade2win.com/boards/trading-journals/140032-my-journal-3-a-89.html#post1819690

It's odd but true. With this kind of edge, the one I am seeing for my present 14 systems, it would seem convenient to simply scale up all the time, without scaling down. If things went in the future as well as in the past, all I'd risk is 50% of the capital (meaning a temporary drawdown), and, if I accept this, I make 10,000 times more profit in the end.

However, I may find some bad surprises in the future and so what seems like a 50% decrease in capital could turn out to be an 80% decrease in capital, and that's just like a destruction, emotionally. Even though... who knows, in the end I might still make more money that way.

If instead I use scaling down, then I end up losing half as much, 25%. Much safer that way. And it still makes a lot of money. I guess here the choice is between being Jesse Livermore and some unknown guy. And I don't want to be like Jesse Livermore, blowing out my account periodically.

[...]

But there's more to it. I said that with the method of "up but not down" or "increasing but not decreasing", you risk a temporary drawdown of 50% if things go according to plans, or 80% if things do not. That was wrong. You could be even unluckier than that, and there'd be nothing stopping your fall towards zero.

Scaling down ("fixed-fractional") is like an insurance and it costs some money, but as you lose you slow down, just in case you're wrong. Fixed contracts and "increasing-but-not-decreasing" contracts is like saying "I can't be wrong", and if instead you're wrong or you're not as good as you thought, then this is what happens (from a previous post) in theory:

Snap1.jpg

And this is what happens in practice:

20100614_to_20110926.gif

Given that we have established that wins have a random order and therefore losses do, too, what ensues is that you could have a potentially unlimited string of losses. And therefore fixed fractional is the only way to go, because no investment will ever be safe enough, and only infinite divisibility of your investment could guarantee you from blowing out.

What I still haven't figured out is how to apply the simple Kelly formula to my scaling up, and the reason is that I am math illiterate but also that trading futures is not like investing money or is it?

I mean... let's get back to QuantWolf's calculator:
Coin Toss Simulator for Fixed Fraction Betting

Ok. I am on it.

Let's pretend that instead of money invested we use 10k of capital with "contracts/systems invested".

So, 100% of money invested would simply mean 10 systems/contracts, because in fact you could trade 10 systems/contracts with as little as 5k.

As my period, I will not consider one trade but one week, because otherwise I get weird results... and that's where the problem begins with: having to adapt things makes the results unreliable.

Ok, in one week, I have a 66.6% chance of winning, and I could win 2k, which is 20% for the calculator. And I have a 33.3% chance of losing 2k.

Let's try...

Screwed up again:

calc.jpg

I mean, "screwed up values".

He's saying something as if I should invested 6 more contracts, about double the leverage. Same systems but double the contracts...

Oh, I see. He's assuming infinite divisibility of capital again. I keep forgetting about this.

So, i think this calculator/formula (on a previous post I got the same results on excel with this formula) could very well work if I had at least 200k.

So all I'd need to do is get all the p&l for all the weeks traded, consider the amount of capital/margin necessary for those systems/contracts and then plug the values.

But things could be worse in the future, so I guess I could easily come up with safe estimates for the future edge of my systems, to be plugged into that calculator right now.

With an optimal portfolio (to be divided infinite times) comprising 1 contract every system (I am simplifying things here, because of course one silver contract is not the same as one GBP contract), what will my week look like?

This hypothetical portfolio would require 10k, and would trade 10 contracts. The best simplification so far.

Again, I would have one third of unprofitable weeks, realistically.

Realistically I would make 3000 per month. Wait... right, let's even expect less. I would make 2000 per month.

Realistically this would come from 3 weeks of +1000 and one week of -1000.

Ok, I am ready.

calc2.jpg

Damn! What the ****.

Kelly again tells me to invest 3 times as much, which means... trading 30 such contracts.

In which case, I'd lose and make 30% per week.

So what is wrong with this?

Two things:
1) again, I do not have infinite divisibility of capital and that is why Kelly's figures sound so wrong
2) I never realized that in the back of my mind I also was aware that I could lose much more than 10% in a week.

But then the question is: how do I tell Kelly and this calculator that I have a 1% chance of losing 4000 in the period, a 10% chance of losing 1000, a 30% chance of losing 100, and so on?

Let's see what happens if I extend the period... to a month.

In a month, finally, I have some chance of losing 10k.

10% chance of losing the entire capital, and a 90% chance of making an average profit of 40%, 30%. Yeah, this is realistic.

Ok, let's see what I get.

calc3.jpg

Now this finally makes sense. So I learned that I should always plug into Kelly's formula my worst fear: blowing out. And that I should extend the period to include my worst fear, whether those trades happen in a day or in a week.

So now the formula is telling me that I should reduce the leverage/contracts to half as much.

Which means that if I double the capital, I should be ok.

20k every 10 contracts.

Ok, and now it's telling me that I should invest a bit more:

calc4.jpg

I get the point though.

In the meanwhile Vito is saying a lot of stupid things in the room next to mine. Good thing he is not in my room.

So, I should follow these steps:

1) put together an optimal portfolio
2) see how much margin it requires and use the minimum it requires (considering the systems trade at different times)
3) calculate average % monthly return on that margin
4) calculate the pessimistic % probability of a loss that could blow out an account with that margin in one month (if it doesn't blow out, it most likely makes money every month).

Then I come up with the kind of capital needed for that portfolio.

Ok, let's try it.

1) optimal portfolio trades 20 systems
2) it requires 20k of capital/margin
3) the pessimistic average monthly return is 5k, which is 25%
4) pessimistic blowout % probability is 10%

Ok, good:

calc5.jpg

It's telling me that for such a portfolio I should have twice as much capital. So I should have about the same capital I was imagining with my excel workbooks in the past few days: 40k per optimal portfolio.

That is an average of 2k per system.

I should add/remove a system (synonym of contract since now I am trading one contract per system) every 2k I make/lose. But this is on average. Because the smaller the probability and size of a loss by a system, the smaller the capital allocated to it. On average it should be about 2k per system/contract.
 
Last edited:
I am still struggling with R. A bunch of problems with settings of all sorts. Excel is far superior. But I cannot find an equivalent of PerformanceAnalytics for excel. The strength of PerformanceAnalytics is that it puts together all the papers ever written on risk into one software tool. But the software R sucks (compared to excel). It's the software academics use, and this explains why it sucks. Unless something is impractical, academics won't use it. They need to show they're persistent and cultured with everything they do, so if something is easy/simple/quick, they will discard it. Also, R is free, whereas excel you have to pay it. So it's the same reasoning: better to use something crappy that is free, rather than something efficient that is costly.

So I can't use, or rather... I am most likely going to discard R (and PerformanceAnalytics) due to my limited skills and patience. It sucks but these academics and their love for what's impractical are forcing me to do so.

Then there's all the Palisade software, an excel add-in, but I can't use it either, and I don't think it will do what I need. And it will do a lot of things that I can't really understand so I'd rather not use it.

There's a lot to learn as far as risk and software measuring it, but each time I do, I end up realizing that my own thing on excel was better.

I am kind of tired of this studying.

SUMMARY OF WHAT I'VE BEEN DOING FOR THE LAST 5 MONTHS

Let's sum it up and find out what worked and what I should insist on:

MATH: GOOD - DO MORE
1) probability was very useful - it originated from my math studying
2) statistics was also useful, though not as much - also came from math
3) formulas and summation notation was the biggest failure: notwithstanding my math studying I was unable to understand all the formulas in these academic papers I've been reading

So far: more math. Math is good, let's do more.
ACADEMIC PAPERS: PARTLY A WASTE OF TIME - ENOUGH
4) markowitz, sharpe... it was good, because it gave me this important concept of return vs variability. But I could have gotten it by reading one sentence rather than by watching dozens of videso and reading dozens of papers, and what's worst is that they all care so little about explaining it to you that I still haven't got a clear understand of the formula, wherever it may be, and if such a formula exists. This is due to my math problems, but also due to these academics not caring about explaining things.

5) other lesser-known academics: I got more concepts from them. Better use of my time.

All in all, I already understood all the most important concepts from these dudes. Diminishing returns from this point on. The objective was to just learn enough to make money, and not to turn into an academic. I've learned the basic concepts so I'll probably stop reading academic papers from here on, and shift the focus back on trading literature such as Vince and company.

TRADING LITERATURE: LIMITED BENEFITS BUT DO MORE
6) Besides Vince and Chan, both of which I should keep on reading, there's authors that are between trading literature and academic papers: what's his name again? Thorp:
http://en.wikipedia.org/wiki/Edward_O._Thorp
Chan, Thorp, Vince. I will put the focus back on them.

TRAVIS' OWN REASONING AND EXCEL FILES: DO MORE
7) Then of course I should follow the most important thing: my own train of thought. And create my excel files accordingly. I should not endanger my own train of thought for the sake of reading academic papers, but if I see that I am getting nowhere then I should read, most of all, Chan-Thorp-Vince, in order to get ideas.

MATH TUTOR AND/OR DISCUSS WITH OTHER PEOPLE
8) I should have and would have done it here, if there weren't so many trolls, who forced me to enable the "only posts from contacts" option. Now I don't get any more posts from anyone. But it's still better than getting a stupid post per week, when you least expect it, saying something like "travis, you're a loser" or "shame on you for losing all this money".

This means I cannot rely on this forum (except for the precious private messages I get sometimes) for insights, except my own of course. Partly it's because I got into arguments with half of the few good people who posted here. That's my hyper-sensitivity. I got offended, too easily. I can't change it. I had a father who berated me all my life, so I am hyper-sensitive to criticism.

FORUM SEARCHES
So I can't rely on this forum for sources of ideas. I should however rely on forum searches, here and on elitetrader.com.

Also, I need to reason with intelligent and mathematical people. To find them, I think I might need to pay them, because I found none on the internet, and my friends are all lazy and not interested in trading. I need to find one good math person to discuss with. I need such a person desperately. Maybe I don't even need a tutor, or maybe I do.

I yet have to find such a person.

1) Ams. is an engineer, has the knowledge but comes and goes - totally unreliable.
2) NS: economics major - unreliable and not competent enough
3) ...

Must find one person. Just one.

UNEXPECTED SOURCES OF IDEAS AND UNDERSTANDING
At the same time I must not forget that I found great sources of knowledge and understanding in the most unthinkable places. The most abstruse paper will have in many cases a very clear abstract, introduction and conclusion. I could read these parts of all the papers, and skip the 90% of pages in the middle. For example, I am discarding their software, but this explanation of their software, PerformanceAnalytics, is in reality an excellent summary and explanation of all risk measures to date.

The same applies for all other books, and... basically I have to follow my train of thought across all these different sources of knowledge. What is most important is my own train of thought. So fatigue can be and should be avoided. If it doesn't come easy, I should just forget about it. Except for math, where some fatigue is the norm.
 
Last edited:
6 months later, some conclusions

Ever since the experience with the investors ended, six months ago, when, having lost (cfr.chart posted in previous posts) all profit made, plus 11k, we halted our trading for good, I've been wondering what went wrong, and I've been studying math and portfolio theory. Six months later, here's some conclusions on the causes I've identified:

1) We didn't choose the best systems: lack of forward-testing and excessive trust in back-testing.

2) We chose some systems with too much leverage (silver, copper, gold), and allocated too many contracts to other systems, and that made the portfolio lose its balance. Now I know that systems should be weighed equally, and chosen based on the frequency and size of their losses, and lack of correlation to the underlying future. Otherwise diversification goes down the toilet. It shouldn't matter how good a system is: you can't let it matter too much for the portfolio (not more than 10%).

3) We chose correlated systems that we thought would add diversification but instead removed it (in some cases, it was like giving more capital to the same systems).

4) Most important one: Kelly was half ignored. We scaled up when profit increased, but did not scale down as our profit decreased, and yet profit was the only thing keeping the investors in the game. When it became negative, they quit - as agreed at the start. This because we reasoned in terms of "maximum drawdown", but that concept is invalid because losses and wins are just a random sequence, and the fact that such a sequence produced a certain drawdown in the past doesn't imply that it's the "maximum drawdown". In the same way, the past correlation between the systems is not a good measure of correlation: it's better to compare each system to the underlying future it trades.

All right, here's the chart that shows the whole traded period:

20100614_to_20110926.gif

After all these months, and all this studying, I haven't found an automated univocal and unambiguous formula taking care of the whole process: from appraising the individual systems, to putting together a portfolio based on capital, profit, variability of the systems, to deciding how much to invest on the systems and the scaling up and scaling down of the portfolio. I haven't done it yet, unfortunately. What I did do is having a good understanding of all the right ingredients and principles necessary. I do not have the math skills to put it all together in one formula. I'll keep trying, but I think I'll need to work together with a mathematician.
 
Last edited:
zenwealth.com

This is an excellent website for risk, but I cannot understand most of it. Maybe because I am tired, because my eyes are, or because I am math illiterate, or because I am stupid. But let's mention it for my three readers, or for myself in the future:

Two Asset Portfolio Calculator
Measures of Risk - Variance and Standard Deviation
Portfolio Risk and Return
CAPM Quiz
Diversification
Risk and Return Equations
Capital Asset Pricing Model

The thing with this website is that it looks very user-friendly, because it's so clear and it has such an orderly web design, but as you delve into the material you quickly find out that is anything but easy.

However, someone will find it useful for sure.

I was going to say that it takes a Ph.D. to create this website, and here it is: "Mark A. Lane, Ph.D".
 
Last edited:
umpteenth google search: "fixed fractional"

fixed fractional - Google Search

Fixed ratio vs. fixed fractional:
Fixed Fractional and Fixed Ratio Money Management Styles - For Dummies
Fixed fractional trading assumes that you want to limit each trade to a set portion of your total account, often between 2 and 10 percent. Within that range, you’d trade a larger percentage of money in less risky trades and at the smaller end of the scale for more risky trades.
The fixed ratio money management system is used in trading options and futures. The idea behind fixed ratio trading is to help you increase your exposure to the market while protecting your accumulated profits.
First of all, I think I have a problem with the way they interpret fixed fractional, and this is in reference to much more than I quoted above (cfr. link for details). I can't use just trade risk (which they define as "amount of money you could lose on the transaction") to decide how much I allocate to a trade. Even Kelly wouldn't agree with that. I also need the probability of that loss, and, in a portfolio, I also need the frequency of trading of that system, because one thing is if it trades once a year, so that huge loss can only happen once a year, in the middle of other thousands of trades, and another thing is if it trades 10 times per day, and that loss could happen 10 times in one day.

So once again, it is about: max loss, probability of it, and frequency of trading of that system.

But I am learning that "fixed ratio" is the application of fixed fractional to futures. So this is good. Other than this, the formula is simple, but actually too incomplete even for how simple it is, because once again it's not considering anything regarding Kelly.

It does however introduce the principle of scaling up and scaling down, which is how far I got, too. But what I'd like to have is fixed ratio mixed with Kelly.

Here's another link that compares fixed fractional with fixed ratio:
Fixed Ratio and Fixed Fractional Money Management - InformedTrades
Fixed fractional, however, requires unequal achievement at different contract levels. For 1 contract every $10,000 to move from 1 contract to 2 requires a profit of $10,000 from 1 contract. To move from 10 contracts to 11 still requires $10,000 profit but from 10 contracts. So for smaller account sizes it will take a long time for the money management to actually kick in and for larger account sizes the number of contracts traded will jump wildly around.
Fixed ratio adds delta to the calculation. The delta is a factor which is required to move to the next contract level. The lower the delta the more aggressive the money management is.

The formula is:

equity required to trade previous contract size + (number of contracts x delta) = Next level.

Eg starting with a base of $10,000 for 1 contract and a delta of $5,000:

Contracts - Equity Required $

1 - 10,000

2 - 15,000

3 - 25,000

4 - 40,000

5 - 60,000

6 - 85,000

Comparing the above table to that for fixed fractional it can be seen that at the lower account levels less equity is required whereas as the account grows the number of contracts traded becomes less aggressive.
I don't like this either. I don't see why I should become less aggressive. And once again it ignores Kelly.

Elitetrader.com on the same subject:
Forums - Difference Between Fixed Fractional and Fixed Ratio?
tommo:
I like fixed fractional risking a predefined % of your account on everytrade because its simple and you are compounding when things go well and scaling back when you arent.

From what i understand fixed ratio does the same, but...
MGJ:
Fixed Ratio is explained in (this book) by Ryan Jones.
intradaybill:
Take a look at this:

Fixed Ratio Position Sizing

IMO, fixed ratio is NOT a risk management method but an attempt to maximize equity growth GIVEN that profit accumulates. In another sense it is a formula for pyramiding.

%Kelly is much more effective provided you have a profitable trading system:

notfound

I am surprised so many people still confuse risk management with equity growth maximization.

The only method that guarantees trader control over risk is the fixed fractional.
I told you so. This guy agrees with me on everything, plus he adds more useful insights.

Let's keep going.

The Leet Trader: Fixed Fractional position sizing
Most of us who have dipped their foot into the market are generally concerned about making money. The first rule I see of making money is to not loose what I already have. While its next to impossible not to loose a trade or two its imperative that I do not loose all or most of my trading capital...
At the end he provides two links to two software packages, but you have to pay, so I'll move on.

This seems promising:
http://www.tradingrecipes.com/files/pw.pdf

I have to take a break due to work from the office, where I am right now.
...
Ok, back.

Yeah, he reaches my same "mind-blowing" conclusions:
First, TRADING RECIPES has given me a time-oriented perspective of the power of
systematically compounding through reinvestment. Below are shown the increases in reward
and risk with fixed fractions from 4 to 7%, using my 15-market portfolio from 11/20/89 to
8/9/99, a total of 297 trades. If I had continued with my recent 4% fraction over the whole 11-
year period, my $200,000 starting capital (discussed in Part 5) would have produced a net profit
of $742,000,000, with a 39.5% maximum drawdown. What a mind-blowing prospect!

HTML:
f (%)                4.0  5.0  7.0 
NP, M$            742  1456  2766 
MDD, %          39.5  43.0  51.8
At f = 7%, profits would have approached 3 billion. Above that, margin calls would be a
problem. I have mixed feelings about such outcomes. Such giant profits demonstrate the power
of position-sizing methods, but to me seem a bit scary--perhaps obscene. At any rate, I do not
aspire to a decade of such escalation. I do not welcome the prospect of having to deal with such
big bucks. So far though, I am becoming accustomed to handling increasing numbers of
contracts, instead of reinvesting the money in mutual funds.
They've got a demo, with the ms-dos prompt. I can't deal with it. Not efficient enough:
Trading Recipes Multi-Market Multi-System Backtesting Platform for financial traders (Portfolio Trading)

But he's dead on target and everything he's saying corresponds to what i've found out.

On his website I found a document that mentions kelly (with a custom google search):
http://www.tradingrecipes.com/files/csmith.pdf
That's an interview to a very successful (anonymous) trader and he mentions kelly several times.


I think I am gonna stop with my search for now, also because I am having some nice intuition right now, which I got from something I read. I just realized this: if you underbet, you'll have the advantage of a lower volatility. Look at this chart:
Snap1.jpg

Which I took from this file:
http://www.trade2win.com/boards/att...401-my-journal-3-kelly_criterion_20120225.xls

Which I took from this post:
http://www.trade2win.com/boards/trading-journals/140032-my-journal-3-a-61.html#post1797886

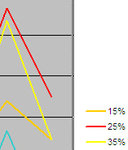
Optimal Kelly bet is 25% of capital. Such a curve reaches its final optimal profit by going up 3 and down 2, more or less.

Snap2.jpg

If you bet 15%, you're underbetting by 10%, and yet you reach the same destination you would reach by overbetting 10% but with smaller swings.

So this is telling me that, differently than I've been thinking, there are two advantages to underbetting:

1) if you underbet you stay on the safe side, as far as away as possible from the risk of blowing out, which is closer to overbetting.

2) if you underbet what you lose by not compounding your capital you gain by a reduced volatility in your equity line.

The beauty of math. This took me months to realize, whereas it would have taken a math guy a few minutes. The nice thing is that there's a lot more non-math people who will be screwing themselves because of this ignorance... that is unless they're reading my journal. So my three readers will benefit from this.

Anyway, by underbetting you can't go wrong, because, on top of staying away from blowing out, you also compensate whatever compounding you'll lose with a decrease in volatility. Which means you'll be less scared and frustrated when losses will take place.

But just how much should you underbet?

There's the blender for that, but also there's this: how much profit are you happy with? Then underbet that much. Of course right now I don't know what I am doing exactly, if I am overbetting or underbetting, but more or less I have a 10% chance of blowing out with the present investment. That's my estimate, since the blender says 3%.

Not a completely logical and coherent post, but very important and completely new insights were digested.
 
Last edited:
the situation degenerated at the office

Continuing from here:
http://www.trade2win.com/boards/trading-journals/140032-my-journal-3-a-89.html#post1819910

Just two days ago I was noticing how...
My boss has taken to abruptly bursting into my room lately, without knocking even. Very annoying and disturbing, but there's a "but", and I'll explain why I am not complaining to him or to anyone.

I wish he told me what he wants to communicate to me by doing that. Since he's a bit of an idiot, I am not even sure he's doing it on purpose, or that he knows exactly why he's doing it.
This thing had to evolve... I could sense it.

Today, seizing the opportunity from a trivial mistake I had made, the boss actually the nerve to yell at me. Pretty depressing and upsetting. I pretended it was ok and said "yes, will do so" type of thing. But then I wrote him an email saying "hey, I work well enough to not deserve such a treatment".

Then he came back and said to me that I should notice such things, and he brought up "if you weren't doing those math exercises".

So I got the exact point and explanation of his behaviour of the past two weeks. He's feeling that I am neglecting my work at the office to do my own math exercises and similar work, all detailed on this journal. And he does have a point that I am doing a whole lot of personal work, but he's wrong that I am neglecting my work at the office.

But what matters now is that I do not want him to get this impression, so this is a problem I have to solve.

I feel no guilt because just a few weeks ago I had even told him, against my father's advice, that I had two free/empty hours every day. Now I know why I am always sincere: to prepare for these situations.

And when I told him about the "two free hours", he was ok.

So this guy is kind of contradictory - but that's ok, too, because he's stupid. It seems as if it's ok to spend those two empty hours as long as you spend them talking to people or on the phone (like everyone does), but it is not ok to spend it studying on your own subjects.

This is fine, too. He has the right to ask me to do what he wants in those six hours I am the office. And I'll help him deal with his own reasoning, given that he hasn't understood that it bothers him that I have two empty hours, since he told me it's ok. I guess he feels that I have it too good. And I do indeed.

So I wrote him a second email saying: ok, from now on, since it bothers you that I do math during my two empty hours, and it bothers me that you yell at me because you're bothered by me doing math, then please tell me whatever else you want me to do, and tell me whatever upsets you, because I'd rather work for six straight hours than to be yelled at.

This despite the fact that everyone is slacking off all day long.

But I guess he feels like he's being disrespected by me as a boss. So I do not want him to feel disrespected and he has the right to make me work all the hours I am there. What he cannot do is yell at me, and I will make sure it doesn't happen again. I put up with it for one week just to make sure it wasn't due to a momentary frustration of his. But if he's targeting me as a punching bag or whatever, then I'll deal with him effectively: I can mop the floor, you can fire me, anything. But you cannot yell at me.

I can take anything for the sake of not being transferred to another office, because I am having a peaceful time where I am, but of course I cannot take being yelled at. Especially if I think I can avoid it. And given that I do not deserve it. No one does deserve it anyway. But I am certainly the person who deserves it the least, and the boss confirms to me his stupidity for the simple fact that he dared to yell at me.

That's partly why I am not too offended, and I managed to stop him (I think I did), without losing my temper. Had it been someone else, I would have gotten up and left the office. Instead I replied quietly and calmly. I feel pretty good about my reaction. Of course I was still offended, but much less than I could have been.

Among the other things, I must not forget that he's always coming to my room to talk to me, which is different from someone calling me to his office and lecturing me in front of everyone. I mean, this guy acts like I am the boss in some ways, so he's somewhat schizophrenic/borderline or whatever it's called. Like... one day it's "thanks, you're perfect" and the next day it's "what the **** did you do?!". I am going to go easy on him, because overall he's been treating me nicely for a whole year, despite the ACE nightmare we have all experienced from February until June of last year, thoroughly detailed on "my journal 2".

Needless to say, because of this yelling I received today at the office, I am at great risk of engaging in frustrationary trading. Which actually already happened, but I forgot about it, because it went well, and I made several hundreds. Actually, today I reached a 200% profit since i resumed trading on January 11th. Yeah, I know: I rule. From 4k to 12k in 2 months. I definitely rule. Oh yeah, I am so good. Oh, and I am saying 12k but it's not precisely 12k because I actually withdrew a few hundreds in the last two months, to pay for the server.

But now I am at risk of a frustrationary trading which will blow out my account. I need to quickly get into the bath tub and stay away from my laptop until the markets close. At the cost of getting drunk. This is one of those typical days where I start a random discretionary trade, to make a quick 200 dollars, then it goes against me, then I doubled up and then I add contracts until I am losing thousands of dollars in just a couple of hours, and then I "have" to keep the position open for an agonizing few days, trying to recoup my losses.
 
Last edited:
frustrationary trade: LONG on QG

Look:
Commodity:Natural Gas/WikiChart

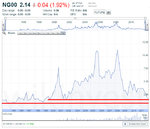
It's never been this low in 13 years. Of all the trades I could do, this frustrationary trade is the least dangerous one. I think it has great potential to the upside and almost no potential to the downside:

Snap1.jpg

I dedicate this trade to my yelling boss and to all the assholes who made me do it.

[...]

You know what?

I am sad, because of this discrepancy there is between the image I have of myself and the image others have of me, at least at work. I mean, all my friends appreciate me as much as I appreciate myself. They consider me as great as I consider myself, and they let me get away with anything. But at the office, especially lately, I've been seeing a lot of discrepancies between my self-image and the feedback I am getting from them. It really bothers me and it makes me want to isolate myself. I don't want to interact with people who do not appreciate me and whom I do not appreciate. There is definitely a problem, which, unless I quit my job, will get out of hand.

This discrepancy is kind of like the ratings of this journal. I think I deserve five stars, judging from the other threads, and yet I am not getting my deserved five stars. And this makes me want to reject the forum, the majority of users on the forum, and keep them from posting here. There is no way anyone will convince me that the idiots who have been posting stupid things in my previous journal have a point, or are worth listening to. They're idiots period. Disrespectful idiots. In the same way I feel for life: I am disappointed by people and I just don't think that people in general are intelligent enough to appreciate me.

To tell you the truth, I think I had seen the same problem in:
1) elementary school
2) junior high school
3) high school, in italy and the states
4) college
5) first job at a bank
6) second job as a web designer

In my work life, I cannot accept being normal, and others do not acknowledge my superiority. I think this is where all my problems come from.

And in trading I am looking for something that will confirm to everyone how special I am. That's why I am putting so much hope and pressure in my investments.
 
Last edited:
Continuing from here:
http://www.trade2win.com/boards/trading-journals/140032-my-journal-3-a-91.html#post1821596

I think i've made my mind up. I won't be doing any more math/finance at the office from now on. Nor writing on the journal. I will just focus on my work for my daily six hours. Yeah, of course the others screw around half of the time, but I'd rather be on the safe side and not have to hear a yelling boss, and to be on the safe side, i need a totally clean conscience. So I'll work a full six hours, while everyone else just screws around the whole time. I figure if my trading keeps going so well, I can afford to stop focusing on it, and I can afford for the next few months spent at the bank, to work and be squeezed as much as they wish. The boss is partly an idiot, as I said, but I need a clean conscience. I can't have a dirty conscience just because everyone else has one. If I am called on, like today, and yelled at, in order to reply, I need to be irreprehensible. My idiot boss must not dare to yell at me or object to anything I do. I must be able to incinerate him with a gaze.

I will post less as a consequence.

Also, forget about the weekly updates for a while. It got to a point where it's just showing off. There's no point in showing off. I will post them in case of a drawdown or something interesting. If I keep on making money, I won't post them.
 
fixed contracts vs increasing but not decreasing vs increasing AND decreasing

Some more reasoning on this, from a math illiterate person.

The real reason (and mathematical relationship) why it is safe to scale up as capital increases provided that you also scale down as capital decreases is: how many losses can you take before blowing out?

Since I am math illiterate (with math it would take no time to figure it out), let's analyze the mentioned three scenarios, one by one:

1) fixed contracts: capital grows the slowest (no compounding), but the losses you can take increase as capital increases
The number of contracts is fixed, and, as capital increases, you get farther and farther away from blowing out, because the absolute number of losses you can take increases. At the start this would seem worse than kelly, because you don't scale down, and you will lose the same amount as capital decreases. But in reality at the start even with kelly you cannot scale down, because you cannot trade less than 1 contract (there's no infinite divisibility of bets, especially with futures). So this is the safest method for futures. But you forgo the benefits of compounding.

2) scaling up but not down: capital grows the fastest, but the losses you can take are fixed
The losses that can be withstood are always the same amount. You start with 10k, and invest in 1 contract, and you can take 10 losses of 1000. You reach 100k and invest in 10 contracts, and, again, you can take 10 losses (per contract) of 1000 dollars each. This assumes the concept of "maximum drawdown" (for example, the maximum drawdown of 10 losses), which is something you cannot assume. This is the mistake we made with the investors (other than enabling the wrong systems/contracts). The losses you can take are a fixed number.

3) scaling up and down (fixed fractional): capital grows faster than fixed and slower than "up but not down". The losses you can take are theoretically infinite, but in practice aren't and they increase as capital increases (but not as fast as with fixed contracts)
As capital increases you increase the absolute number of losses you can take. As capital decreases they also increase. In theory, with infinite divisibility of bets (not the reality of futures), you can lose as long as you want. But not in practice, because you cannot trade less than 1 contract. So if you have a small capital like I do, at the start this is as safe as "fixed contracts". And, as you increase your profit, it gets safer but it is never as safe as fixed contracts. However, you cannot give up on compounding, so this is the only way to go about it - ideally by underbetting. Summary: the losses you can take are theoretically infinite but in practice it is never safer than "fixed contracts". Safety and absolute number of losses increase as capital increases, but not as fast as with "fixed contracts".

All these categories and their implications are summed up by this chart (from a previous post):

Snap1.jpg


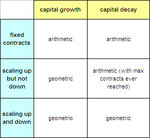
And it's also summarized in this table that I just created:

Snap2.jpg

These are the 3 equations that summarize what's going on (excuse my math), assuming a profit/loss of 10%:
1) fixed:
1 + 0.1 losses - 0.1 wins

2) up but not down:
1.1^wins - 0.1 losses * previous equity peak

3) up and down:
1.1^wins * 0.9^losses

Related links:
Geometric progression - Wikipedia, the free encyclopedia
Arithmetic progression - Wikipedia, the free encyclopedia
Gambling and information theory - Wikipedia, the free encyclopedia
http://www.edwardothorp.com/sitebuildercontent/sitebuilderfiles/Good_Bad_Paper.pdf
http://www.edwardothorp.com/sitebui...Column_24_UnderstandingTheKellyCriterion2.doc
http://stevanovichcenter.uchicago.edu/seminars/Handbook.pdf
Table of Contents
http://www.bjmath.com/bjmath/proport/riskpaper1.pdf
FAQmanager - frequently asked questions
Geometric vs Exponential Growth - Straight Dope Message Board
Web Simulation Portfolio - Transparent Reality Simulations and Web-enabled Simulations
 
Last edited:
Snap1.jpg

It looks like a painting but it's a brainstorming session.

Having established that fixed fractional is the way to go, I am now facing the problem of how to reduce the size of my bet as much as possible.

The optimal portfolio might be as big as 30 systems and requiring a capital of 50k.

I am now thinking of how to assess a system so I can divide the portfolio itself into 30 smaller steps of scaling up/down.

This way I will be able to better protect my capital in this initial phase, and also I will be able to scale it up.

But I need to understand what characteristics of a system affect its contribution to the portfolio in terms of potential drawdown, which is more important than potential profit. I mean: a system that adds a small profit but virtually adds no downside risk is better than a system that adds a lot of profit but also a lot of downside risk.

I need to find a measure, and if I do not find it, I need to rate every system on a scale of preferability, an order to follow when scaling up/down.

Being math illiterate, I can't find it right away.

I suspect the factors are:
1) frequency of losses
2) size of the losses (but also of wins?)

But I need a formula and I cannot measure each individual loss.

Would profit factor be enough to know? No, because it's like the sharpe ratio and both of them do not measure the absolute size of trades and therefore of losses.

I need something to tell me the size of the losses.

So, accuracy and absolute size of the losses should matter.

So could this come from profit factor and from average loss?

I'll pick a few systems and see what happens to them on the blender, individually and see how these blender results compare to these mentioned characteristics.

I am going to study:
SI_ID_01, big trades, good profitability
EUR_ID_05, average trades, excellent profitability
GBL_ID_02, very small and rare trades, excellent profitability
GBP_ID_02, very small and frequent trades, low profitability
CL_ID_05, medium and frequent trades, good profitability
NG_ID_04, big trades, excellent profitability
ZN_ON_02, rare trades, medium size, excellent profitability

I don't know what the results will be. I would need to create a measure that enables SI_ID_01 for last, despite its accuracy, because its losses are huge.

Let's see.

Let's first create a table with all their characteristics (mostly forward-tested data):

Snap2.jpg

Ok. So... if i rank them by "my ratio", decreasingly, I get this:

NG_ID_04
ZN_ON_02
CL_ID_05
GBP_ID_02
SI_ID_01
EUR_ID_05
GBL_ID_02

This can't be telling me what I need to know because, SI_ID_01 cannot be the right system for me right now: with one loss it would wipe out my account. Aside from the fact that I cannot even afford its margin.

Ok, so "my ratio" is failed.

I am going to get to the final conclusion, that just came to me:

I have to pick them by sharpe ratio or profit factor (minimum requirement of accuracy), and then enable them by average loss or standard deviation (downside risk on portfolio).

But I am also thinking: while the portfolio grows, shouldn't the frequency of trading also the matter? If a system has 1 trade per month, what is the chance that its average loss will happen repeatedly in one month? Certainly less than an equivalent system that trades 10 times per month.

So the frequency of trading should matter because it could affect the drawdown.

But how do I include that measure... got it.

I am going to multiply the average loss by the probability of a loss by the number of trades per month. This should give me the average amount of absolute losses per month.

Provided that the system is good enough (sharpe ratio above 2), this should tell me a precise scale for enabling them.

But then, shouldn't I include what could happen between one loss and another?

Nope, I can't do this, because if a system makes two millions and loses a million every month, it will look ok, but it'd still be the most dangerous one.

So I will choose the good systems, and then see what comes out of this product.

Wow, awesome. They're precisely the systems I've enabled.

[...]

Wow, what a fool, almost. Here's what I said just a few minutes ago:
I am going to multiply the average loss by the probability of a loss by the number of trades per month. This should give me the average amount of absolute losses per month.
It's true but then I thought about it, and it's much simpler than the way I calculated it:
Snap3.jpg

So, what I am really after is the average monthly gross loss, but isn't it similar to the average loss? Let's make sure they're not the same thing....

...Right, it's not the same thing. They're correlated but it's not the same, because if a system loses on average 3 times per month, and another one loses once every month, if the average total gross loss is the same, they'll be the same to me, but the average loss will be different.

But wait, then how can I consider these two systems the same thing? The first system will not have the same likelihood of losing 3 times in a row as the second one has of losing one time in a row.

So, I have to do this all over again.

Why was it working so well?

The best thing there is average loss once again, which is very related to the standard deviation I was using. But average loss is much clearer so I'll get back to it.

So I need 1) accuracy of system and 2) average loss, and I'll know how to choose my systems. ROI concerns only come later.

What a beautiful simplifying mind I have. All I need is a few simple concepts, in the right relationship. I have a gift for simplifying things. I hadn't realized how powerful is the mere "average trade". No need for complex formulas. Average trade is a very powerful information.
 
Last edited:
18 systems enabled

I'm very frustrated (from the boss yelling at me at work) and for next week I've enabled a few more systems, bringing the total to 18.

The volatility has decreased lately. There's fewer trades and smaller wins and losses. So this would mean less danger for me. Less downside risk.

If things went according to the average of the past year of forward-testing, here's what I could expect:
25% probability of losing 1700 dollars.
75% probability of making 2600 dollars.

I have chosen to enable all these systems because if I don't, I will place a bunch of discretionary trades anyway. So I am much better off letting the systems go crazy. At least they know their stats, and don't let their hopes cloud their judgment.

I also checked everything on the blender, and my chances of blowing out are just the same. The difference is that if I blow out I blow out by that much more. It means that I still have a 3% chance of blowing out, according to the blender, but the up and down swings go further. So I either go up faster or go down faster, but the probability of blowing out is just the same. Quite interesting.
 
Last edited:
more on the scaling up/down hierarchy of systems

I have created a checklist of requirements for each of my systems (taken individually), that should bring me closer to the hierarchy for systems to be enabled/disabled.

1. forward-tested trades >= 10
2. forward-tested sharpe ratio >= 2
3. back-tested sharpe ratio >= 2 or forward-tested trades >= 20 or (forward-tested trades >= 15 AND identical systems on similar futures have sharpe ratio >= 2)
4. Return On Investment >= x (to be decided)
5. evaluate correlation to underlying future and long/short trades (to be evaluated manually)

For the systems meeting these requirements, the order of enabling/disabling will depend on the average loss.

This is very related to kelly, and, as a consequence of this, I might even reconsider my decision (cfr. previous post) of enabling 18 systems for next week.

I've come up with about 30 systems, and they're the same I had already identified as the best.

Now I will rank them by average loss.

Actually I am going to end up enabling even more systems, for example:
AUD_ON_01
CL_ON_03

Average loss for these 20 systems ranges from 100 to 600. The ones having higher average loss are better in terms of accuracy.

Now i have to check to correlation of all 20 systems to their underlying future.

...

Damn. I have a problem with CL_ON_03. It's been losing a ****load of money in the last few months. And it is correlated to the underlying future CL. So I have to disable it, especially because CL doesn't look like it will be rising in the near future.

I also have a problem with CAD_ID_01: heavily correlated to underlying future, which has been rising in the past few months.

Ok, so I am basically swapping the CAD_ID_01 for the AUD_ON_01, and have only considered adding CL_ON_03 but won't do it because it's too correlated to underlying future.

...

Ok, with this new portfolio I have:
25% of losing 1700
75% of making 2500

Same as earlier, more or less:
http://www.trade2win.com/boards/trading-journals/140032-my-journal-3-a-92.html#post1822200

The difference with what I had done a few posts above is that this portfolio actually made less money in the past, but I am choosing it because it's more likely to work in the future. This is when you know you're using your brain: when you're choosing a portfolio that has worked worse, because you think it's more healthy, and more likely to work in the future. It's easy to say that the best national soccer team is the one that won the last world cup. It's not as easy to predict that the world cup will be won by a team that didn't win it last time. You should be suspicious when you see that you're picking exactly the portfolio that has performed best. Just as you should be suspicious, when optimizing a trading system on tradestation, you're picking the parameters that yield the highest profit.

...

I yet have to decide the hierarchy of enabling/disabling.

Once all these requirements are met, I am left with about 30 systems.

Two systems with an average loss of 100, for example, are not the same... nope, they're the same. One has a better back-tested sharpe ratio, and viceversa.

Let's review those losing 200:
GBL_ID_02
NQ_ID_02
NQ_ON_01
YM_ID_06
YM_ON_01

They are all different. But does the difference matter in the frequency of trading? Nope. GBL_ID_02 doesn't hurt my portfolio just because it trades once a month. The accuracy does matter.

But even the accuracy... is not that important, given that they've all had to meet that list of requirements.

Yeah, I got it. The only thing that matters here, after all the other requirements are met, is pretty much just the average loss.

Amazing how much I was able to simplify this whole thing.

So the ones with 100 as average loss should be the first wave of systems to be enabled. Then the 200s, then the 300s.

But then I am wondering: shouldn't I enable 2 contracts of the 100s when I enable the 200s?

This is really a tough question for a non-mathematician.

No, but wait: it simply cannot be done right now, for margin concerns. It doesn't matter if a system loses only 100 dollars on its average loss: its margin is just as high as the others (more or less), and therefore it will be better to diversify and enable two different systems rather than 2 contracts of the same. Only if I had a much larger capital it would make sense to enable two contracts for the 100s and one contract for the 200s.

Let's test all these ideas on the blender.

...

Wonderful:

Snap1.jpg

Just as expected. When I stick in the blender the trades by the 100s (systems having 100 for their average loss) and 200s, I get a very low fall.

Let's add the 300s:

Snap2.jpg

Only just about 1 step down gets added. Pretty nice. Still low profit and pretty low profit factor. It means that the quality of these first few "safe" systems is not as good as the quality of the others.

Let's see what happens when I triple the contracts on the 100s, double the 200s, and keep the 300s constant. Even though in reality I cannot do it due to limited capital (as said above, it is more convenient to use the available capital to diversify).

My prediction is that the shortfall probability won't get much worse, but the profit will double.

Yeah, profit doubled, but drawdown didn't stay the same:

Snap3.jpg


Let's just double the 100s, and add the 400s.

Snap4.jpg

About the same profit, but a lower drawdown. This means, aside from mathematical relationship I can't understand, that adding more systems is slightly better than doubling up the existing ones, no matter how smaller their losses are. Yeah, because it's like tossing more coins. Even if they're more important, and will weigh more in the total result... I don't know. That's the way it is here, and I can't ignore it, even though I do not understand the exact math behind it.

For sure now I have understood that I will see my systems in terms of "hundreds", "100s", and I will enable/disable them one at a time on an average loss hierarchy. This until I'll have so much capital to simply devise one final optimal portfolio, to be scaled up/down all at once, whereby the systems trading 1 contract will have 2, and those trading 2 will have 4. To have such a portfolio I'd need at least 60k, because I have a system on silver, which, by itself, needs 30k of margin. When I trade that system, all other systems should have at least 2 contracts, or the portfolio will be unbalanced.

Here's the summary of what I am trading now, by 100s $ in average loss, with forward-tested sharpe ratio, and average trade:

Snap5.jpg

One system, ZN_ID_06, doesn't show because it doesn't meet all the requirements, but i've enabled it because it has an average loss of 100.

...

Other than the accuracy (sharpe ratio, profit factor), which can be a bit less for those with smaller average losses, I will enable/disable them by the 100s. The lower the average loss the longer I can keep them despite the drawdown.

Regarding a formula summarizing all this concisely, I can't do it all alone. As I said before, I need a mathematician to help me.
 
Last edited:
two tasks: analysis of September systems and scaling down schedule

Tough day at work. Despite not sleeping very much, I had to go early, because it was my first day after the boss yelled at me - first time in my life or similar. I was really upset, but I decided that the first strategy is to be irreprehensible, rather than yelling back. Then, as an extreme resort, I will yell back. Like in two weeks.

I guess I had to give in. I realized that:
1) I am wealthier than the average employee
2) I go to work riding a cab instead of taking the subway
3) I am on a part-time schedule
4) I have a single room (double room with roommate hospitalized) instead of being in a room with 10 people
5) ... so many more things

I guess it's only fair that, whereas the others can screw around all day long, I am not allowed to spend two hours a day doing math or financial things. The boss resented this - I finally understood what the yelling was all about. So, he has a right to resent me, and I have the duty to stop. Little does it matter what others do - I was studying while they were wasting time. But I guess the law is stricter for someone who is considered privileged otherwise.

So basically today I went early, stayed longer, and I did nothing but work all day long. I didn't even take a break. And I left the door half open, so the boss doesn't feel I am locking him out of my room, and so he doesn't feel bad about checking on me. What an idiot. Anyway. I am going to do this, because I cannot allow anyone to yell at me. I don't deserve it, and I'll do anything to prevent it. And of course, the first set of things to do is to be irreprehensible. The second set of things is to kick him in the balls, but I think the first strategy will work fine.

As a consequence I was totally unable to even check my personal email at work, nor the forum, nor the trading, nothing at all. Because I've decided to quit cold turkey. From now on, just office work, and no other personal work. I will likely blow them away. Not that I ever got any rewards for working all day long without any breaks. But I'll do it anyway, because this guy has decided that I was having it too good.

So anyway.

Now I have to get to work on two ideas that I had while I was at work, because, despite the fact that I was doing work for the bank, I was still having ideas about trading.

Today's work:
1) analysis of August/September systems and 2) scaling down schedule

1) I have to check which were the systems that failed in September, that caused the investors to halt their trading, what happened to those systems, and if I am trading any one of them.

2) I have to devise a scaling down plan, with the exact names of the systems to enable depending on how much capital I lose and the exact consequence in terms of drawdown as predicted by the blender.


...

Here's my first task:

Snap1.jpg

Three fourths of these systems were either unprofitable and still are (lack of forward-testing) or were so correlated to the underlying future that they all lost at once. These are the 13 most unprofitable systems we traded. I am going to add a new column on my database, called "correlation to underlying". It's going to be very useful, because that way I don't have to check this manually every time.

...

Now on to task 2:

Snap2.jpg

The easiest thing would seem to simply enable/disable by the 100s, but there's a catch. The accuracy also matters. If a system loses 200 once every 10 trades, how much better/worse is it than another system losing 100 every 5 trades? I need a math guy for this, but once I solve this, I don't need anything else.

Maybe I can be that math guy. Let's simplify. A system loses 200 every 4 trades, and another loses 100 every 2 trades. Such a system has a 50% chance of losing 100, 25% of losing 200, 12.5% of losing 300, 6.25% of losing 400. But this is still not enough, it depends also how big the wins in between are. It cannot be simplified this much, can it?

I might get some help from expected value:
Expected value - Wikipedia, the free encyclopedia

The other system, losing 200 every 4 trades, has 25% of losing 200, just like the other system, but what about losing 400? Exactly the same, 6.25%.

I might be on to something, if we exclude the relevance of wins for a second.

Ok, profit factor is very correlated to expected value but their ratio changes depending on the trades, so I don't know which one will help me measure this deal better. I'll keep trying, dude. I am not a math guy.

Let's take one extreme examples of two sets of trades:

100
0
0
-2
-2

EV 19.2
PF 25

vs

100
0
0
-2
0

EV 19.6
PF 50

System 2 is not twice as good as system 1, come on. So in this case EV rules.

Oh my god! What an idiot I am! I just found out that Expected Value is the same as average trade!!!

Mother ****ing academics. I went as far as reading bernoulli to learn about expected value and it is the same thing as average trade - mother ****ers...

The question still is: which performance measure will tell me at which point of performance a system losing 200 on average loss will be as good as another losing 100 per loss (but with more frequency)?

Let's test the previously mentioned situation:

100
100
100
-200
0

EV 20
PF 1.5

vs

100
100
100
-100
.100

EV 20
PF 1.5

Both PF and EV in this case tell me the two systems are the same. Lower average loss should not deceive me into thinking one system is better.

...

Getting there...

View attachment 133970

You see here? This is a typical situation I am faced with. One system has 100 average losses, and another has 200 average losses. But the 200 losses are half as probable, and that sets it equal to the other, and both Expected Value (average trade) and Profit Factor agree on this if that extra trade is zero (cfr.previous example). But how do I precisely assess that the first system is slightly better because it places one extra trade that is profitable?

Snap3.jpg

[...]

A lot of thinking down the bridge. I am lost again. I need a mathematician. Right now I am at this: how can I know, from a ratio, how much better needs to be a system having 200 as average losses, to be as good or better than another system losing 100?

I need this, in order to establish an automated hierarchy for enabling/disabling systems based on different levels of capital.

What is very clear right now, which was not clear before is that first of all Expected Value is the same as average trade.

And that average trade, sharpe ratio, profit factor are all very correlated.

I think, as a rule-of-thumb (but it's not good enough), I could look first at average loss and then at the average trade, which is already on that table above, which I'll paste here again:

133968d1333386338-my-journal-3-snap2.jpg


At that point, a system losing 100 but with an average trade half as much as another system losing 200, should be equivalent... but then again... there's two many variables I am ignoring, and... in order to get it right, i would have to rely on my intimate knowledge of all my systems, rather than on a formula which I cannot formulate. I need a math guy.

Midnight, The Stars and You [HQ] (The Shining ending credits) - YouTube
 
Last edited:
measuring correlation of system to underlying future rather than to other systems

I was recently asked a question by a reader on why I am measuring the correlation of my systems to their underlying future rather than to each other. I have addressed this before, but my answer this time was even more complete, so I'll quote it:

...the fact that a system is not correlated to its underlying future is itself a guarantee that it has random success/failure and it won't be correlated to the other systems, because all the underlying futures are correlated between each other.

Furthermore:
1) systems being uncorrelated to one another is not a guarantee of the same thing, because it could be mere chance,
2) it is hard to measure because they trade on different timeframes and frequency of trading and
3) it's practically impossible to do when you're dealing with 120 systems. Things just get out of control that way, whereas they do not when you do things my way.
 
Top