good one:
CapitalatWork
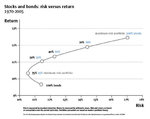
Figure 1: Efficient Frontier

Holy cow... after days of work and criticism, it turned out that the best representation of my own systems is the scatter plot used to represent the efficient frontier. Congratulations markowitz.

I still have my ratio that puts x-axis and y-axis of the scatter plot together, but there was scales out of proportion and overlapping of information if I represented it in any other way than this (chart above).
The only big difference that I introduced, not necessarily to markowitz, but to my understanding of the sharpe ratio, is that I am no longer dividing... using average trade over standard deviation (of the trades), but I am using the ROITVOR version, which is yearly profit over margin and standard deviation over profit (y-axis). I then divide the first by the second and get the ROITVOR ratio, but right now I don't use it because my scatter plot is fantastic as it is and i don't need to look at a ratio that divides the value on the x-axis by the value on the y-axis. I have all that information on the scatter plot, and it is kept separate, which is best. Then, of course, if I'll need a univocal value, that's the value I will use.
Dude, this is complex ****. I am getting better, but I still suck.
...
The info I am now missing on the chart, but it's for the best because it'd be too confusing, is the absolute margin, the absolute standard deviation, absolute loss... it's all relative now.
So, it's obvious - anyone knowing the efficient frontier concept can tell immediately that NG_ID_04 is incredibly good, returning 400% (on margin) with a very small standard deviation (on profit), but there's a problem. I do not know how much, in dollars, that standard deviation is. So I don't know if I can afford that system. Of course intuitively I'll know that I can't afford a system on silver, but for the others, anything could be possible. It could be that a NG system has a low standar deviation and a good profit, and so it scores high, or it has a large standard devation and a huge profit, and it scores high because of that.
So I am having second thoughts about this representation. But none about the y-axis. Return has to be % return on margin.
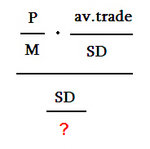
And I don't think I can divide standar deviation by margin, too, because if I do, this would happen:
And it would be equivalent to dividing Profit by Standard Deviation and then I'd lose track of Return On Investment. No doubt about this.
And yet, it's clear to me that markowitz and the others are talking about standard deviation on the capital invested. But they're talking about stocks. What is the equivalent for futures... let's do a search:
https://www.google.com/search?q=efficient+frontier+for+futures
...
Unsuccessful.
Should I just put on the bottom the standard deviation?
I can't, because a system trading silver will have a higher standard deviation, and unfairly so... as i was saying this morning...
Hold on...
I do not have to use this measure to rate anything, so this would be there only to tell me... got it!
I am going to keep it as it is, and add the absolute standard deviation next to the names, with hundreds, rounded (divided by 100 dollars):

Ok.
So now for example I can compare everything from this scatter plot, and in particular GBP_ID_02 with CAD_ID_03:

Let me make sure there's no useless info on this chart.
For one reason (high accuracy) or for another (frequent trades) GBP_ID_02 performs much better than CAD_ID_03. It returns 200% per year vs. 30% per year. It's due to the frequency of trading because it's got a profit factor which is worse, and a win rate which is lower. Smaller wins to losses, lower % of wins, and yet it performs 6 times better: I would have been fooled by profit factor, sharpe ratio, % of wins... unbelievable.
So, what else? That "4" next to both of them, tells me that I can expect a standard deviation of 400 dollars, which means an average loss more or less of that size (slightly less, since the average trade is positive, because the systems are profitable), and a max loss... who knows about that? I can check, but the standard deviation has little sensitivity to it.
So how do I know which one to trade? I know the margin, I can afford both. I can afford both in terms of losses... but my blender told me the GBP would lower my survival rate and for now it doesn't make sense to add it, because I should be making enough to keep moving forward.
So I ultimately decided not to add it. So many things to consider, also that are still not in the scatter plot.
For example, number of forward-tested trades. They're both satisfactory.
My eyes are killing me. I have to stop the reasoning and the writing here, for today.
[...]
Will write some more.
Look here:

Basically, I am quite confident about the systems in the green square. I'd be making a mistake if I didn't trade those (in the square) with a standard devation of less than 500 and a margin that I can afford.
For some reason there's something more to it than what's shown in the chart. Accuracy is important, too. It's not ROI and it's not st.dev.divided by profit.
It is profit factor, and it is sharpe ratio.
I'm about to go crazy, with all these variables and the many ways they can mix.
The principles are that I cannot make it too complex, and that I want to try to make it as complex as possible, so that's what causes this endless conflict within me: i try to push it a bit further, but then I fall back on my ass, by not understanding all the implications of my changes.
The objective is to automate everything, but in order to do this... hey, "maximize sharpe ratio" as everyone says just isn't the recipe. It's tempting to think that way, but it isn't.
Also, it's unclear if I am after either of these or both:
1) make more money, doesn't matter how
2) do things properly, doesn't matter if they produce money
Automating this whole thing may not even bring money, but slow down the process of making money.
I am endlessly moving back and forth between automating and synthesizing the whole process, and gathering good systems in a pragmatic way.
If I make money, then I can pay some math... any math professor to coach me.
So I should focus on practice, and money.
But I am afraid of quitting this thing and never picking it up again. Given that it's so unpleasant.
Also, after 4 months of math review, thousands of exercises, to be ready for this feat, I'd feel like an idiot if I quit.
At any rate, I must say that it has helped me already. The blender totally came out of this. And its predecessor, too. They came out of the probability theory I studied.
All right, **** it. Let's take a break for my brain, by being pragmatic. Let's stop for a bit to try to be coherent, logical, and putting it all together theoretically, and let's just go about finding good systems to add to my portfolio, and...
**** this whole thing.
Let's put profit factor on the x-axis. I've already got st.dev. in the ****ing name of the systems.
Let's be practical.
Profit factor tells me the accuracy of a system more clearly than anything else.
Return On Investment tells me how profitable.
One tells me how accurate, the other tells me how profitable, and the st.dev. in the name tells me how affordable. The margin, I know immediately by the name.
Ok, I'm gonna go down the practical useful path and screw the academic path.
**** the efficient frontier, **** them all. You know why? Also because I don't get why I am dividing st.dev. by profit. I want everything to be clear, or I can't do it.
These ****ing academics make it look so neat, but do not go through the trouble of explaining it to me clearly - you assholes. They only explain it to one another.
So **** them. I tried, but I could not figure it out, so **** them all.
[...]
Ok. Good. Done. I got rid of some outliers, systems that i could not trade for various reasons: mostly lack of capital and the fact that they haven't traded very much in forward-testing.

I used a log scale.. I had to do so much to take care of the scales... so that everyone would be separate and not tight together.
I am done for the day. I can't do much better anyway. This is good practical stuff.
By going into this labyrinth I did not learn all the time. Sometimes I just got confused.
But my scatter plot of today shows more than it showed a few weeks ago.
I am satisfied. Certainly this field isn't boring. There's even too much stuff to read, especially for one who's not an expert at math, and has to go the same paths, without realizing it. With a good understanding of formulas I would have saved so much time. It's like for someone who's expert at understanding laws: he goes, picks up the law, and gets done much faster than someone else would. Or like for a programmer to fix a computer vs for a regular person...
I need those math lessons, from a real person.


