my journal 3

What happened to all my 10 readers? I think I remember now. I wrote a couple of posts about death, and then I deleted them, but maybe that was enough to scare everyone away. Or maybe it's all these formulas I'm writing or maybe I'm repeating myself lately. Or maybe I've become stupid and offer no insight. I can feel stupidity increasing in me. It is maybe from age, or more probably from exhaustion at the office, and from work... basically I have been working too much and pushing myself too hard.

It's incredible how natural gas can stay at that price for two months without moving from it. I was expecting a very quick rise or a further decline, but neither happened. So basically, while I did manage to make something out of my GBL trade, as the QG will expire soon and I'll be forced to close it, and won't open a new one this time, I will exit this trade with a loss of 1000 dollars. Unless it rises in the next two days. I'm gonna close it on Friday.

Odd, because I complain about my readers not reading me, but every day I get another 100 views, so people are reading but only when I can't catch them on the "Currently Active Users Viewing This Thread" menu.

And thanks to whoever rated me a 5 star, because I finally achieved an ok rating:
Snap1.jpg

And this makes me very happy. Yes, I was used to having 5 stars instead of 3, but since I can't multi-register and rate myself or I get banned, then I can't do that anymore. Until I'll travel to England, if ever, and then my vacation there will be spent at an internet point, multi-registering and rating myself. I don't care if people have a poor taste and don't rate me correctly. This needs to be fixed. I take justice into my own hands. It's a crime that with all the garbage around here, I don't have a 5-star rating.

Sungha Jung - Love of My Life (Queen) [LIVE in Helsinki, Finland] - YouTube

I'm just gonna sit here and keep doing my thing, like this guitarist. I enjoy writing my thoughts.
 
Last edited:
Bertsimas - Lauprete - Samarov

Done with this paper:
Bertsimas - Lauprete - Samarov

Practically I only understood the introduction of it. Too much math, showing off knowledge without caring for the reader to understand, just trying to impress whoever was supposed to read it. Probably the paper was meant to not be understood by anyone whatsoever.

Pretty disappointed with it. But it taught me a key concept: downside risk measures.

Some concepts that it didn't teach me, but that are memorable, are: "second-order stochastic dominance", "cardinality constraints" and "mixed linear integer programming problem".

I'm going to remove it from my signature now. The neat thing about is that you can click on the bibliographic references in the text, and it takes you to the book in the bibliography at the end of the paper.

(Elton John) Your Song - Sungha Jung - YouTube
 
Last edited:
risk metric, risk measure and coherent risk measure

I am starting to get acquainted with these new terms which i've been using interchangeably:
Risk metric - Wikipedia, the free encyclopedia
A risk metric is the abstract concept in financial risk management quantified by risk measures. When choosing a risk metric, an agent is picking an aspect of perceived risk to investigate, such as volatility or mean return.
...
In a general sense, a measure is an algorithm for quantifying something. A metric is our interpretation of the number.[2] In other words, the method or formula to calculate a risk metric is called a risk measure.
Ok, so volatility is the metric and standard deviation is the measure? I hope it's like this.

Risk measure - Wikipedia, the free encyclopedia
A Risk measure is used to determine the amount of an asset or set of assets (traditionally currency) to be kept in reserve. The purpose of this reserve is to make the risks taken by financial institutions, such as banks and insurance companies, acceptable to the regulator. In recent years attention has turned towards convex and coherent risk measurement.

Then I've read something on this, too:
Coherent risk measure - Wikipedia, the free encyclopedia
In the field of financial economics there are a number of ways that risk can be defined; to clarify the concept theoreticians have described a number of properties that a risk measure might or might not have. A coherent risk measure is a function ρ that satisfies properties of monotonicity, sub-additivity, homogeneity, and translational invariance.

Yeah... I am also reading that sharpe ratio is obsolete, but also Value at Risk is obsolete, and now they're saying the only good thing is expected shortfall. But these to me are still vague distinctions. I don't even know what these guys are talking about. I read paper after paper and they're all using the same words, but I am far from grasping the whole concept - mostly because I don't understand the formulas. I just need another 10k of profit, and then I'll start taking those private math lessons.
 
Last edited:
Monte Carlo Value-at-Risk

Monte Carlo Value-at-Risk
Historical transformations were popular during the early 1990s because they were intuitively easy to explain to non-technical professionals—VaR was being calculated based on one-day profit or losses that the portfolio would have realized based on market movements that occurred during each of the past 500 or so trading days. There are, however compelling reasons to avoid historical transformations. First, because they are based on the Monte Carlo method, they entail exactly the same standard error as Monte Carlo transformations. While Monte Carlo transformations can minimize standard error by using large sample sizes, this is not possible for historical transformations. Their sample sizes are limited by the availability of relevant historical market data. It is rare that historical transformations have sample sizes grater than 1000, so standard errors is generally significant. Historical transformations are not amenable to many of the powerful methods of variance reduction available for Monte Carlo transformations. Finally, use of historical realizations introduces biases relating to conditional heteroskedasticity. See Holton (2003).

Example of Calculating VaR Using Monte Carlo Simulation | Finance Train
The attached spreadsheet shows the calculation of VaR using Monte Carlo Simulation.
http://financetrain.com/wp-content/uploads/2010/07/Monte-Carlo-Simulation.xls

J.P. Morgan | An Overview of Value-at-Risk: Part III
Computing VaR with Monte Carlo Simulations follows a similar algorithm to the one we used for Historical Simulations in our previous issue. The main difference lies in the first step of the algorithm – instead of picking up a return (or a price) in the historical series of the asset and assuming that this return (or price) can re-occur in the next time interval, we generate a random number that will be used to estimate the return (or price) of the asset at the end of the analysis horizon.

J.P. Morgan | An Overview of Value-at-Risk:<br>Part II - Historical Simulations VaR**************
The fundamental assumption of the Historical Simulations methodology is that you look back at the past performance of your portfolio and make the assumption – there is no escape from making assumptions with VaR modeling – that the past is a good indicator of the near-future or, in other words, that the recent past will reproduce itself in the near-future. As you might guess, this assumption will reach its limits for instruments trading in very volatile markets or during troubled times as we have experienced this year.

The below algorithm illustrates the straightforwardness of this methodology. It is called Full Valuation because we will re-price the asset or the portfolio after every run. This differs from a Local Valuation method in which we only use the information about the initial price and the exposure at the origin to deduce VaR.
...

What i still haven't completely understood is if what I am doing is historical VaR or Monte Carlo Var. I am not sure if there's resampling in historical VaR but there might be. For sure Monte Carlo is about creating random scenarios. But I got the idea that even historical VaR may be about random resampling of past prices.

What might be misleading me is that in historical VaR they talk about simulation, and yet they use "dates" so it must be a simulation of just pretending that you're investing, but not in the sense that you're resampling.

Oh, ok, here it is - no doubts any more:
An Introduction To Value at Risk (VAR)
1. Historical Method
The historical method simply re-organizes actual historical returns, putting them in order from worst to best. It then assumes that history will repeat itself, from a risk perspective.
So investopedia says I am doing monte carlo for sure.

Oh, ok - I am doing monte carlo:
An Introduction To Value at Risk (VAR)
3. Monte Carlo Simulation
The third method involves developing a model for future stock price returns and running multiple hypothetical trials through the model. A Monte Carlo simulation refers to any method that randomly generates trials, but by itself does not tell us anything about the underlying methodology.

Even JP Morgan's link actually says I am not doing historical VaR:
J.P. Morgan | An Overview of Value-at-Risk:<br>Part II - Historical Simulations VaR**************
Disadvantages of Historical Simulations VaR

The Historical Simulations VaR methodology may be very intuitive and easy to understand, but it still has a few drawbacks. First, it relies completely on a particular historical dataset and its idiosyncrasies. For instance, if we run a Historical Simulations VaR in a bull market, VaR may be underestimated. Similarly, if we run a Historical Simulations VaR just after a crash, the falling returns which the portfolio has experienced recently may distort VaR. Second, it cannot accommodate changes in the market structure, such as the introduction of the Euro in January 1999. Third, this methodology may not always be computationally efficient when the portfolio contains complex securities or a very large number of instruments. Mapping the instruments to fundamental risk factors is the most efficient way to reduce the computational time to calculate VaR by preserving the behavior of the portfolio almost intact. Fourth, Historical Simulations VaR cannot handle sensitivity analyses easily.

Lastly, a minimum of history is required to use this methodology. Using a period of time that is too short (less than 3-6 months of daily returns) may lead to a biased and inaccurate estimation of VaR. As a rule of thumb, we should utilize at least four years of data in order to run 1,000 historical simulations. That said, round numbers like 1,000 may have absolutely no relevance whatsoever to your exact portfolio. Security prices, like commodities, move through economic cycles; for example, natural gas prices are usually more volatile in the winter than in the summer. Depending on the composition of the portfolio and on the objectives you are attempting to achieve when computing VaR, you may need to think like an economist in addition to a risk manager in order to take into account the various idiosyncrasies of each instrument and market. Also, bear in mind that VaR estimates need to rely on a stable set of assumptions in order to keep a consistent and comparable meaning when they are monitored over a certain period of time.

In order to increase the accuracy of Historical Simulations VaR, one can also decide to weight more heavily the recent observations compared to the furthest since the latter may not give much information about where the prices would go today. We will cover these more advanced VaR models in another article.
Yeah, we were doing it with the investors, and I've been doing it for years - that's the whole concept of "maximum drawdown", but after studying some probability I've abandoned it.

...

Oh, and even riskglossary.com says I am doing monte carlo VaR:
Monte Carlo Value-at-Risk
Historical transformations are identical to Monte Carlo transformations except for one difference. Both employ the Monte Carlo method to construct a histogram of realizations
monte_carlo_transformation_1_p_k_realizations.gif
of
1_p_cap.gif
. The difference lies in how they construct realizations
monte_carlo_transformation_1rk.gif
for
1_r_cap_bold.gif
. Monte Carlo transformations randomly generate them based upon a characterization of the distribution of
1_r_cap_bold.gif
. Historical transformations employ realizations
monte_carlo_transformation_1rk.gif
constructed from historical market data for
1_r_cap_bold.gif
.
 
Last edited:
starting to think about kelly

Continuing from here:
http://www.trade2win.com/boards/trading-journals/140032-my-journal-3-a-61.html#post1797886

Now that, with my ratio and with my Monte Carlo VaR estimator (the "blender"), I've got the portfolio theory for the present all figured out, I need to start thinking in terms of Kelly Criterion.

I think everyone should think in terms of Kelly, because the chance of losing everything is always there, so you can never invest your whole capital. But then things might change for those investing in bonds or similar.

Anyway, I need Kelly. I see Kelly as something that will increase the chance of survival of my capital. There's always a chance of blowing out, even with Kelly, because:
1) the systems could stop working
2) you could get very unlucky and have a huge drawdown
3) the systems could be or become correlated (related to the previous points)
4) most importantly: Kelly assumes infinite divisibility and future contracts do not allow that (especially with a small capital)

But it takes longer to blow out your account if you use Kelly. And it allows you to grow it faster. This is exactly what we didn't do with the investors. We kept going towards the cliff at the same speed throughout the drawdown, at the end of which they stopped trading. Wrong, if you consider what I said: there's always a chance of blowing out, no matter what: even if you did everything right.

Back then instead we were thinking in terms of Historical Var, and as if "maximum drawdown" meant something, as if you just double the maximum drawdown and that value cannot be exceeded.

The way I'd approach this problem is to simplify everything first of all, because I can't think in any other terms. I can't use terms such as "second-order stochastic dominance" and "mixed linear integer programming problem". Those are terms for people busy showing off.

In plain and simple words, I am going to pretend that my bet is not each trade but each six months.

In a period of six months, or let's call it "in my bet", with the present portfolio, I have a chance of 80% of (average estimate) quadrupling my capital and a 20% chance of losing everything.

What I mean by not reinvesting. If you start at any day at random, with the present portfolio, and you trade for the next six months, my estimate is that I have a 20% chance of blowing out, and an 80% chance of quadrupling my account.

Having said this, let's see what Kelly says.

[...]

Damn!

Stumbling block...

[...]

I have either become retarded from too much work and burning out or this is a challenging concept, or both... what exactly does it mean to invest a fraction of capital when you're trading futures?

Ok, wait.

Ok, let's say I am trading X contracts/systems with Y capital.

This combination will cause me, as mentioned, at the end of the bet period, an 80% chance of quadrupling Y capital, and a 20% chance of losing it all.

[...]

Ok, I should invest 73.33%, both according to my excel formula here:
http://www.trade2win.com/boards/att...401-my-journal-3-kelly_criterion_20120225.xls
Snap1.jpg

And according to this calculator:
A Kelly Strategy Calculator
Results
  • The odds are in your favor, but read the following carefully:
  • According to the Kelly criterion your optimal bet is about 73.33% of your capital, or $733.00.
  • On 80% of similar occasions, you would expect to gain $2,199.00 in addition to your stake of $733.00 being returned.
  • But on those occasions when you lose, you will lose your stake of $733.00.
  • Your fortune will grow, on average, by about 66.62% on each bet.
  • Bets have been rounded down to the nearest multiple of $1.00.
  • If you do not bet exactly $733.00, you should bet less than $733.00.
  • The outcome of this bet is assumed to have no relationship to any other bet you make.
  • The Kelly criterion is maximally aggressive — it seeks to increase capital at the maximum rate possible. Professional gamblers typically take a less aggressive approach, and generally won't bet more than about 2.5% of their bankroll on any wager. In this case that would be $25.00.
  • A common strategy (see discussion below) is to wager half the Kelly amount, which in this case would be $366.00.
  • If your estimated probability of 80% is too high, you will bet too much and lose over time. Make sure you are using a conservative (low) estimate.
  • Please read the disclaimer.
But this is assuming that futures contracts are infinitely divisible. And they're not.

This is getting very complex, but not so complex that I can't figure it out. Maybe I'll need the help of the bath tub or the help of some dreaming. I'll take a little break for now, because I have to work for the office.

[...]

Back from working for the office.

I was thinking and having problem with this... let's try to remember.

Ok, assuming infinite divisibility of my capital and of futures contracts, and with these parameters:

1) trading 13 systems/contracts
2) with 10k
3) 80% chance of quadrupling at the end of period
4) 20% chance of losing everything

Kelly says I should invest 73.33%.

But if I invest 73.33%, the contracts do not shrink, so basically what Kelly is saying is that I should shrink the contracts to 73% of what I can afford with 10k. No, 73% of the combination I am examining, of 13 systems/contracts.

So, he's saying that with 10k, to maximize my return (and avoid the risk of blowing out) I should invest in 73% of the mentioned portfolio.

But mentioned portfolio is 13 contracts for 13 systems, and it cannot be reduced in any way:
1) I cannot get rid of some systems
2) I cannot get reduce the size of the futures traded

So where do I go from here?

I think I go that I am taking, as I thought and said from the start, in early January, a 20% chance of blowing out.

But we're thinking this thing for the future and not for now.

For now this is what happens: as capital increases, the % VaR decreases, and so does my chance of blowing out. The more the capital, the more I can take the variability of this portfolio.

Kelly will apply when I'll have much more and I'll want to scale up, and it will answer these questions:
1) when do i scale up?
2) when do I scale down?

Let's simplify a bit further. Let's say that Kelly says I should invest, for every 10k, not 73% but 50% of the mentioned portfolio. Similar rationale to the "half-Kelly" concept.

Since the mentioned portfolio cannot be divided, capital has to be doubled. This means that when I will have 20k, I will be correctly investing in the present portfolio.

But it also mean that, should I lose let's say 1k, then I should immediately scale down, but this cannot be done, so Kelly cannot even be applied for when I'll have 20k.

So let's start reasoning as if I had 40k. And let's call the present portfolio/leverage "portfolio 13" (it trades 13 systems and 13 contracts). And let's assume this portfolio 13 cannot be touched because it is an efficient frontier portfolio and it maximizes expected profit vs variability (or whatever you wanna call it).

When I'll have 40k of capital, since I need 20k for "portfolio 13", I will then be able to trade "portfolio 26", which is like portfolio 13 multiplied by 2.

Then, the minute my capital goes from 40k to 39k, I will have to scale down again to portfolio 13.

So ok, I think I pretty much answered my own question without the need to go in the bath tub.

Let's go over it again and explain it to myself better.

For every 20k I have, I can trade a portfolio 13, which means that as soon as I have 40k I can trade two of them, and... when I'll have 100k, I should be trading portfolio 13x5, which is "portfolio 65". Then, as soon as I lose 1k and all the way down to a capital of 80k, I'll have to switch to portfolio 13x4.

It's like excel's trunc() function. As soon as you have 1.9, it's as if you had 1. As soon as I have 39k, it's as if I had 20k, the capital for portfolio 13.

Ok, it's all clear. For now I don't have any more insights. What is clear is that I'll have to either wait until I reach 40k to apply this approach and scale up, or I should see if I can minimize this, and reduce it to a hypothetical portfolio 1, with 1 system and 1 future, which will allow me to speed up the scaling up and the compounding by dividing it into smaller steps.

The way I should go about it, and I'll keep thinking about this in the next few weeks and months, is to identify a system to add/drop for every level of capital.

Instead of going from portfolio 13 at 20k to portfolio 26 at 40k, I should identify one system to be added/dropped for every 2000 dollars made/lost.

A lot of thinking to do. What is interesting is that with the investors we did not prolong the life of our capital, because (mistakenly) we did not have a Kelly approach, but a maximum drawdown approach, which many other traders have, and that says you should keep investing not a fixed fraction of your capital (like Kelly) but a fixed capital all the way until your systems have proven to have failed by exceeding the maximum drawdown plus some % of leash allowed. The problems with this are that:
1) max drawdown doesn't exist - it's just a matter of probability. The maximum drawdown is infinite, even though it will have a small probability of happening. And if it happened it still would not prove your systems have failed.

2) Historical VaR is not an appropriate assessment of VaR, because the combination of systems together could produce a low drawdown due to luck, due to the length of backtesting.

Anyway, no need to mention more for me to understand that leverage should decrease as capital decreases. Just as it increased as capital increased.
 
Last edited:
Expected Shortfall: a natural coherent alternative to Value at Risk

I am reading this paper by Carlo Acerbi and Dirk Tasche:
http://www.bis.org/bcbs/ca/acertasc.pdf

I found it here:
Expected shortfall - Wikipedia, the free encyclopedia

For once I found something where I can read both the abstract and the introduction and still understand almost everything.

I find it very interesting and clear so far:
Risk professionals have been looking for a coherent alternative to Value at Risk (VaR) for four years. Since the appearance, in 1997, of Thinking Coherently by Artzner et al [3] followed by Coherent Measures of Risk [4], it was clear to risk practitioners and researchers that the gap between market practice and theoretical progress had suddenly widened enormously. These papers in fact faced for the first time the problem of defining in a clearcut way what properties a statistic of a portfolio should have in order to be considered a sensible risk measure. The answer to this question was given through a complete characterization of such properties via an axiomatic formulation of the concept of coherent risk measure. With this result, risk management became all of a sudden a science in itself with its own rules correctly defined in a deductive framework. Surprisingly enough, however, VaR, the risk measure adopted as best practice by essentially all banks and regulators, happened to fail the exam for being admitted in this science. VaR is not a coherent risk measure because it simply doesn’t fulfill one of the axioms of coherence.

Acerbi works at RiskMetrics:
RiskMetrics - Wikipedia, the free encyclopedia

There's a webinar by him here:
Valuing Liquidity - Risk Management - Insights - MSCI

...

Holy cow. He definitely knows his ****. But also, double holy cow: strong italian accent, even too strong for me, an italian. Between the technical jargon, the subject ("valuing liquidity"), and the accent... I just give up. I mean: i don't know what the **** he's talking about. I'm going to watch the VaR videos instead:
http://www.trade2win.com/boards/trading-journals/140032-my-journal-3-a-86.html#post1815936
 
Last edited:
more on simplified Kelly

Continuing from here:
http://www.trade2win.com/boards/trading-journals/140032-my-journal-3-a-86.html#post1816206

I kept thinking about it, and you know what? It's simpler than I thought. Kelly is about a fixed fraction of capital to be bet.

My "portfolio 13" is to 20k of capital what my "portfolio 26" is to 40k, but I can take it even further.

There's a... - arithmetic progression is what they call it. And it could be slowed down by further diversification - but I must make sure it is diversification and not adding correlated systems. Let's say I manage to diversify just as good as those 13 and I keep adding systems one at a time, in order of preference by profit/variability metrics.

I'd basically be adding a system per average extra capital of 2k. Let's say at 20k we have an optimal number of systems of 10. That is like saying that for every 2k I gain/lose I can add/remove one system - or even better: one contract. I need 2k per contract, and I am not talking about the margin side of it, but about the "reserves", "profit cushion", which after all are also related to the concept of margin, because margin is there for the potential losses.

But the quantity of margin calculated by the exchange and broker is not exactly proportional to my systems because I could be trading CL, which requires a big margin, for just one hour, and NQ, which requires a smaller margin for two days. This would cause a difference in variability. Other factors could be the profitability of the system. Since I'll be adding the best systems in a descending order of variability, the last systems/contracts added will also be the first ones to go.

This is the pattern I've followed and will follow, more or less, according to these varying levels of capital:

1) starting with 4k: I included the systems with the highest accuracy, provided they required little margin and had a small variability.

2) capital of 10k (now): I added other systems with great accuracy, requiring higher margin and implicating a higher variability (bigger losses and bigger wins). Psychological factors were included in the portfolio decisions such as fear of dying, boredom... shooting rampage at work.

3) the future: as capital will increase, all the variabilities due to contract size will become identical, because if a ZN causes you losses for 400 dollars and CL causes you losses for 800 dollars, you can trade 2 contracts for ZN and then variability will be identical for all. Once I'll put together a good enough portfolio and all systems/contracts will be balanced, I should stop increasing the systems AND the contracts and keep them in that balance. Because there's a risk of losing track of correlation, and quality of systems. I should stop at about 20 systems. Then I put them into the right balance, whereby silver is not trading a contract if doing so gives it a weight of half the portfolio. Once this is done, I follow the concept of adding/removing one contract every 2000 dollars made/lost. Since all systems are good, the contracts will be removed/added based on their variability. For example, if a silver system loses 1000 per trade, it ain't gonna trade before I've enabled all other good systems losing less than 1000 dollars per trade.

It's still a huge mess and I don't have a univocal methodology for systems/contracts selection, but the big improvement is that I've digested the concept of scaling down next to the concept of scaling up. Something not trivial at all, if you consider that as recently as September with the investors we kept on going full speed until the very last day of trading. People were suggesting to scale down, but for the wrong reasons: that the systems might have stopped working. Others were suggesting to stop trading. Others were suggesting to enable/disable the portfolio based on a moving average applied to the portfolio equity line. All non-scientific rule-of-thumb methods. If they had told me to scale down for the Kelly Criterion it would have been an entirely different piece of advice.

[...]

I am either terribly wrong and retarded, or I have just simplified to the essentials both markowitz and kelly - even without knowing them in detail (I can't because I still suck at math, despite all the exercises I've been doing).

Essentially, markowitz gave me the concept of minimizing variability for a given level of profit, and kelly made me understand the need to scale up/down depending on the capital you gain/lose.
 
Last edited:
I lost another 600 dollars with another one of my discretionary trades: ****!!!

I need to find activities outdoors, so I don't sit here all day long and get tempted. I need to spend less time indoors and in front of my laptop.

I am sick and tired of losing my eyesight, losing money, losing everything. It just doesn't make any sense whatsoever.

If I can solve this last problem, I will be able to enjoy some of my life for once. Making money, spending some time in relaxation. Not much but better than nothing.

Why should I spend all day long in front of my laptop and lose money, when I can spend the same hours relaxing and making money?

Let's just do it, man...
 
Last edited:
VaR versus expected shortfall (CVar)

Three approaches to value at risk (VaR) - YouTube

Expected Shortfall (ES) - YouTube

VaR and ES in Excel - YouTube

VaR002 - YouTube

VAR versus expected shortfall - Risk.net
Expected Shortfall: a natural coherent alternative to Value at Risk by Carlo Acerbi and Dirk Tasche.
Value-at-Risk vs. Conditional Value-at-Risk in Risk Management and Optimization by Sarykalin, Serraino, Uryasev.
Snap1.jpg

Portfolio Safeguard: Optimization Risk Management VaR CVaR Drawdown Omega Replication Hedging Tracking Credit Risk Minimization MATLAB
This software is very interesting, but it requires matlab and I don't know how to get it for free:
Portfolio Safeguard Optimization Risk Management: VaR, CVaR, Drawdown, CDO

Wilmott Forums - Expected shortfall calculation

Value at Risk (VaR) Excel add-in by Peter Hoadley
VaRtools comprises a set of Excel-based tools for the calculation of the two most widely used VaR measures:

Value at Risk (VaR): The maximum loss that will not be exceeded with a given probability (confidence interval) during a given number of days. For example, "there is only a 5% chance that our company's losses will exceed $20M over the next five days". This is the "classic" VaR measure. VaR does not provide any information about how bad the losses might be if the VaR level is exceeded.

Conditional Value at Risk (CVaR): The average size of the loss that can be expected when it exceeds the VaR level. It is the loss that can be expected in the worst n% of cases over a given number of days. CVaR, also known as Expected Shortfall and Expected Tail Loss (ETL), provides an answer to the question "when things get bad (ie the VaR level is exceeded) then what is our expected loss?".
Yeah, I am doing the second one, so I renamed my blender "Monte_Carlo_CVaR_estimator.xls".

Financial Modeling with Crystal Ball and Excel - John Charnes - Google Books
http://jose-desktop.uacm.edu.mx/nol... With Crystal Ball and Exel. John Charnes.pdf
book.jpg

John Charnes on why academics suck:
page10.jpg

Here's yet another software (which I have):
Getting Started in @RISK - Advanced

This stuff requires so much work to learn to use - and you still don't know what exactly it's doing - that I am much better off doing my own simplified thing on excel (the "blender"). As Charnes says, it's better to do very well a less ambitious thing, than doing badly a very ambitious thing (which is what academics do most of the time - too busy showing off knowledge to get the job done).

I am still going to read all these academics, to learn the important concepts, as much as I can, but what I'll probably end up with is not purchasing any of the software they recommend (cfr. links above), but blending those concepts to do my own thing on excel.

So far I've understood these simple concepts, after all the reading I've been doing (and only partly understanding what I was reading):
1) have the objective to reduce variability for a target of monthly profit
2) knowing how to reduce it: a mix of margin, profitability, downside risk considerations.
3) scaling up when your capital increases, but also, very importantly, scaling down when it decreases.

I think these few basic concepts are like the synthesis of all this bull**** endless talk. Bottom line: if you ever want to achieve anything as far as building profitable trading systems, and making money with them, you better not start from reading these papers I've been reading. Only read Chan's book at the most. Or do everything by yourself. Actually, being a programmer would help. But it has nothing to do with reading (or writing) these papers.

Yeah - I agree - it would be nice to have an "analytic solution", as john charnes calls it here:
133188d1332520302-my-journal-3-page10.jpg


But if the alternative is between just having your dick in your hand and having instead an efficient approximate method, then I prefer the second one. And none of these academics is ringing at my door to explain to me what the **** they're saying in their papers and books. They're not making an effort to be understood by me - maybe they don't even expect me to read their papers. They want to preserve their useless knowledge from being used practically.

I'll keep reading them, but I am already aware from the start, that I'll have to translate their concepts into my down-to-earth "blender" and other similar excel utilities. The useful thing in all this is understanding the concepts they use. Their practical solutions basically do not exist: they're not writing manuals. They will never attach an excel sheet to their papers: they do not give a **** whatsoever about the practical application of their knowledge.
 
Last edited:
weekly update

Snap1.jpg

Snap2.jpg

ft.jpg

Since I screwed up on the profit by NG_ID_04, and I lost it all by starting a mother ****ing discretionary trade, I decided to disable both NG_ID_04 and CL_ID_05, those two extra systems I had enabled this week, out of boredom and despair.

So now I am playing it safe, with those 13 safe systems. Smaller risk to the downside and smaller gain to the upside. Hopefully I am done for good with discretionary trades. Now they're all closed. I have nothing discretionary open anymore.

I am going to keep posting these weekly updates here until I realize the discretionary nightmare is over. Frustrationary trading has destroyed my last few years of trading. If I can manage to stop, then I don't need to write any more about my trading profits any longer. I wonder if I'll ever learn. There might be something destructive in myself. I had discarded this hypothesis, but it could be true after all. There might be some problem from my catholic parents, who believe trading is immoral and that I should not do make money out of doing nothing. It's funny that banking is ok, investment funds are ok, but doing it on your own... then it's wrong. Doing it for a company is ok, but if you do it on your own, then you're a gambler, if you fail, and if you succeed, you're an evil speculator.

With the present systems I am actually on par with the systems' profit: unbelievable considering all the frustrationary trading I've been doing. So, from now, if I don't mess with them, I should have, as the blender says, a 98% chance of not blowing out. Of coure it's going to be lower than this, but I feel I can survive.

I just better not touch anything from now on. I am on par with the systems, no need to tamper, no need to spend my whole day looking at the screen... no need for anything... let's just do it. Let's stop ****ing with my systems. I know what I have to do, I know the portfolio theory... let's ****ing stop doing it.
 
Last edited:
scaling up and scaling down

Continuing from here:
http://www.trade2win.com/boards/trading-journals/140032-my-journal-3-a-86.html#post1816206

I want to do some more reasoning on the importance of scaling up as capital increases and especially on the importance scaling down as capital decreases.

What is obvious is the fact that if you scale up as your profit increases, you keep your percentage return constant, and therefore achieve that beautiful effect of compounding.

This idea of scaling up is already something hard to understand and deal with, because you'd fear that by scaling up constantly, you'd never reduce your probability of blowing out the account and that eventually you'd make it happen. But what is counter-intuitive is that this only happens when you both scale up (when capital increases) and don't scale down (when capital decreases).

For example, take the present situation. According to my blender the probability of blowing out is now at 2% (which in reality is bigger due to the underperformance of systems in the future). So far I had thought that the only way to decrease that 2% chance is by increasing capital and not touching the portfolio, but you cannot achieve compounding if you do this. So how do you balance your desire for compounding with your fear of blowing out? Kelly. He teaches you that you can benefit from compounding without increasing your chances of blowing out. And he teaches you the exact formula.

But Kelly assumes infinite divisibility of the invested capital, which is very far from the situation I have by trading futures. So what I have to do is try to reproduce the infinite divisibility assumed by the kelly criterion.

But the basic principle is to scale up as capital increases and scale down as capital decreases. And it brings these consequences: the sooner you scale up (when capital increases), the more money you'll make, and the sooner you scale down (when capital decreases), the more you'll last.

Of course with futures this is much harder, because contracts are not infinitely divisible, but what you can do is remove, as capital decreases, one by one, those systems/contracts that cause higher losses (I am using 1 contract per system right now, so "system" and "contract" are synonyms).

Furthermore, many say that you never really know your edge, and so "half kelly" is safer. Whatever you do, what matters the most is the principle of scaling up and scaling down.

So... applying kelly to my specific trading, if my blender says that with 10k and roughly 10 systems (now I have 13) I have a 5% chance of blowing out my account (2% but you get my point about underperformance), that means a 5% danger only if I keep on trading all those systems all the way down to 2k (which is like blowing out the account, because you can't trade any more).

Such probability will be reduced if, as you lose capital, you scale down. This will prolong your survival from 8 to 17 weeks:
View attachment scaling_up_and_scaling_down.xls

It will increase your chances of survival without decreasing very much your potential for profit, because if you make money, you will soon be back to 10 contracts, and if you lose money, yes, you will decrease your potential for profit by reducing your portfolio, by it will be done gradually, so you will renounce to a 10% of profit per 10% of capital that you will lose. And if the systems are profitable, you will be back on top quickly. What you will lose by slowing down, will be more than compensated by what you will gain by being allowed to speed up when profit will increase, by scaling up at the rate of 1 contract per 1000 dollars made.

You should not worry too much about the nailing the "optimal f", which is the optimal fraction of your capital that will maximize your return without causing you to blow out.

"Half-kelly" concept clarifies that we don't know exactly what our edge will be (we only know what it has been) so it makes sense to underbet. But whether you underbet or overbet, provided you don't exaggerate (betting more than optimal f doesn't necessarily blow out your account), you will clearly reduce your probability of blowing out by scaling down when capital decreases.

As simple as this seems, and despite them being much more knowledgeable than me at math, we did not adopt this approach with the investors and in September of last year we went down the valley of our drawdown at full speed all the way to the moment we stopped trading, because we had exceeded our drawdown:

20100614_to_20110926.gif

Actually this picture above represents perfectly what happens when, 1) as profit increases, you scale up your investment (and contracts traded), and when 2) as profit decreases, you do not scale down. It's almost the equivalent of using martingale with risk. If you have x money, you say you risk x % of it. And then, as you have x/2 money you still risk x % of it. It sounds like martingale to me. It's like increasing risk as your losses pile up.

Sometimes too much knowledge keeps you from the necessary level of synthesis. With my ignorance, I need to keep things simple, and that way I may be able to see the big picture better.

What is next?

What's next is to adapt the infinite divisibility to my futures and systems, which means making them as divisible as possible.

How do I reduce the portfolio?

Obviously I am not going to remove systems based on the symbol, nor based on the margin they require. And since they're all profitable, I am not going to remove them based on profitability.

I need to remove them based on what they add to the blender-appraised CVaR, or whatever the academics call it.

For example, if I am trading 13 systems with 10k, and my blender tells me that...

Snap1.jpg

... that I have roughly a 97% chance of survival, then, to further increase that chance of survival, I must, as capital decreases, also remove those systems that, with a lower capital, will compromise that 97% chance of survival - or whatever we consider safe. Of course this is not safe yet, but I have to run some risks, given that my capital is so low, and I can afford to run some extra risks for the same reason. Basically I am not going to jump out of the window if I lose everything. Having said this, I still will do my best to prevent blowing out the account, while doing my best to compound it.

So which systems will have to be removed based on the blender assessment? I don't have a formula for those, but I know their suitability for an increasingly smaller capital will be given by a mix of the frequency and size of their losses.

If I had to sum it up, I'd probably look at profit factor, sharpe ratio, % of losses, that neighbourhood. But the blender will have the final word. As John Charnes clarified to me, I don't have "analytic solutions", but my approximate solutions to my specific problems are better than the exact solutions ("analytic solutions") to problems different from those I'm not having:

133188d1332520302-my-journal-3-page10.jpg


Of course it would have been ideal not to have to remove a specific system, but only the investment in all the systems, because a system might not work today and work tomorrow, but if you disabled it, you won't make money. Of course I am not saying I will remove the system that has lost money, because that would be stupid (there's neither a probable win nor a probable loss after a loss, it's like for tossing a coin), and the opposite would be stupid as well.

And of course it would be ideal to keep the same portfolio and reduce the contracts, but this will only be possible when I'll have hudreds of thousands of dollars, because my most basic portfolio requires 10k, so to scale it up and down, would require at least 100k.

In that case, by being at 100k, I'd trade 10 times the contracts I am trading now, and if I were to go from 100k to 90k, I'd simply reduce the contracts to 9 times what I am trading now, and so on.

Because of mistakes in money management (due to ignorance of portfolio theory), and because of frustrationary trading in particular, I am not at that point now, but I am where I am. In the summer of 2008, I had just brought 3500 to 24k, in just 3 months, but then I lost it all back:

equity_march_1st_2008_to_april_17th_2009.jpg

Why? A mix of frustrationary trading, and not scaling down when the capital decreased (actually I doubled up on losing trades).

Had I known about the kelly criterion back then, I would be in a different situation now. I was a fool. A hard-working fool. I had the edge but it wasn't enough. For years I've an edge and wasted it because of the wrong money management.

[...]

I don't know the math for this, but I am sure that I need to add a system only after there's a cushion in place for it to trade a few times: I can't add a system that gets removed if I lose 1 dollar. For example, at 14k I'll enable CL_ID_05 and NG_ID_04, which I'll disable only if I fall back to 10k.

And now that everything is clear, let's get busy finding activities other than frustrationary trading. I need to look for other sources of entertainment or this is all hopeless. I need to be able to wait. Never before like now have I realized that time is money and that money is time. Three years of compounding is a lot of money. But even just a few months of compounding is a lot of money. And a lot of money means a lot of free time to do things better. Instead of wasting money and time on treating friends to dinners, I should have used both of those resources to get this thing done sooner.

Let's at least try to not mess things up from now on. No more frustrationary trading. No more mistakes in money management.
 
Last edited:
Continuing from here:
http://www.trade2win.com/boards/trading-journals/140032-my-journal-3-a-87.html#post1817536

More reasoning on adapting my portfolio to kelly (scaling up and scaling down).

I need to think out loud some more.

Ok, let's say that I have a 5% chance of blowing out (because of an excess in variability) by trading 10 systems with 10k.

This is what happens if I do not touch the portfolio as capital decreases.

But I've established that I should decrease the systems as capital decreases.

The question is: how do I quantify the decreased probability of blowing out by scaling down?

...

I think the answer is called "conditional probability".

Let's take my blender:

Snap1.jpg

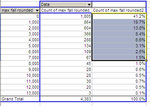
What does this table mean?

It means that if I start trading after any given trade on my equity line, I have a x % probability of losing x dollars.

...

Ok, so I have 3.3% chance of losing more than 8000 dollars, which would blow out my account. This, if I keep on trading with the same leverage.

What happens if I scale down?

First of all, what happens if I do not scale down?

If I do not scale down, conditional probability comes into play. Let's say I lose 1000, and I do not scale down: then I will only have room for a loss of 7000, and so my probability of blowing out (by losing 7000 or more) will be 5%.

If I lose another 1000 dollars, my probability of blowing out (by losing 6000 or more) will be 7.3%. And so on.

But then I have a question. How can my probability of blowing out be 3.3% and 7.3% at the same time?

I think it goes like this. Conditional probability says that at the start I have a 3.3%, but then, after a loss has already happened, things change. This is like for a coin. If you want 2 heads in a row, you have 25% chance of it happening. But if you bet on it after one heads has already happened, then your chance is 50%. The probability of that event happening at the start was indeed 25%, but now it is 50%. In the same way, once you've lost several thousands, your chance of blowing out goes way up.

Then, by scaling down, and reducing the probability of potential falls, I cut down on that probability, and I go from 3.3% to, again 3.3%.

But how do these two combine?

If the probability was 3.3% and I bring it back to 3.3% where is the improvement? The improvement is there because, as I said, the probability when I decide to scale down has gone from 3.3% to 5%.

So I am almost cutting down in half the probability of blowing out.

But how do these two probabilities combine to give me the % of initial probability of blowing out by engaging in this gradual scaling down?

I don't think I can multiply the 3.3% by the 5%, but I think I should multiply the chance of losing 1000 maybe.

I have a 61% probability of losing 1000.

Then, once that happens, I start things all over again, by scaling down, and setting my probability back to 3.3%, but by doing that, I only do it temporarily once again, because I will scale down again when i lose another 1000.

So, simplifying all this, I would have a 60% chance of losing 1000, then I scale down, and I have another 60% chance of losing another thousand, and so on.

So I could definitely multiply all these together, just like I would with coin tossing (0.5 times 0.5 gives you the chance of getting two heads in a row).

So, given a leash for losing 8000 dollars, my probability of blowing out would be, instead of the initial 3.3%:
0.6^8.

Let's see what that gives:
1.7%

Mmh, strange. Not much better.

Mmh, I know why... because as i scale down, the probability of losing 1000 will not always be the same. It will decrease, too.

With 10 systems, I have a 60% of having a loss of 1000. With 5 systems, I should have about half of that, 30%. This will greatly decrease my probability of blowing out, which will always be there, of course, but greatly reduced by the scaling down.

If everything was proportional, the calculation would go something like this:
= (0.6^8)*0.9*0.8*0.7*0.6*0.5*0.4*0.3 = 0.03%

If things worked as expected, my chance of blowing out would be very small with the scaling down. From an initial 3% to 0.03%. It's like... one hundredth. Of course if I could keep on dividing the contracts infinitesimally - which I can't - then my chance of blowing out would be zero. But I can't do so, and so of course the only way to reduce it to zero is by not trading. So my objective in trading is to reduce as much as possible the risk that the variability of profitable systems (in conjuction with bad luck) will blow out my account.

Of course, if instead of starting with a capital of 10k, I could start with a capital of 100k, then the chance of blowing out would be further reduced, because before getting to 10k, I'd have engaged in the same process another 100 times (assuming one contract every one thousand dollars).

So Kelly is the best way to increase your capital while reducing your chances of blowing out. Since the exact kelly ratio is impossible to calculate due to the impossibility of knowing your precise edge ahead of time, the practical application and meaning of "kelly" is merely the concept of "fixed fraction", "optimal f", and the concept that you should scale up as your capital increases and scale down as your capital decreases. In my case, trading with margin, it's a matter not of money, not of contracts, but CVaR (expected shortfall). Actually not even CVaR (which is the average of the worst % of losses): I need to find the term that defines the percentage of losses that will blow out my account. The closest thing I found so far is "CVaR". But maybe I should look into TVaR and others.

Got it:
http://www.andreassteiner.net/perfo...asurement:Relative_Risk:Shortfall_Probability

It's called... read here:
Shortfall Probability
The shortfall probability is the probability of return falling short of a certain threshold return...

p(sf)= N[{rth - avr} / v ]

p(sf)... shortfall probability
rth... threshold return
avr... average return
v... volatility
N[]... Normal distribution

This calculation assumes that returns are normally distributed. Shortfall probabilities can also be calculated based on alternative distributional assumption or by estimating empirical probabilities from time series.

So basically, you could invest 100k in something as risky as a 5% chance of blowing out, but if you keep on decreasing the contracts as you fall down, this will be reduced to an infinitesimal risk. It is different if you only have 10k and start with 10 contracts, because then you can only scale down 10 times. Then you will "only" be able to reduce it by 100 times.
 
Last edited:
Roy's safety-first criterion

Continuing from the previous post:
http://www.trade2win.com/boards/trading-journals/140032-my-journal-3-a-88.html#post1817752

This is what I am doing:
Roy's safety-first criterion - Wikipedia, the free encyclopedia
Roy's safety-first criterion is a risk management technique that allows an investor to select one portfolio rather than another based on the criterion that the probability of the portfolio's return falling below a minimum desired threshold is minimized.[1]

The first time I heard about it is on a file by Andreas Steiner:
http://www.andreassteiner.net/performanceanalysis/?download=ShortfallProbabilityMin.xls

This is really my thing.

I found a paper here:
ON THE SAFETY FIRST PORTFOLIO SELECTION by Vladimir NORKIN and Serhiy BOYKO

Found these other links, too:
http://www.yorku.ca/eprisman/PortEssHtml/chp6-1.html
http://www.analystnotes.com/notes/subject.php?id=72
http://www.investopedia.com/terms/r/roys-safety-first-criterion.asp

I'll need to read them tomorrow.

...

No, wait. It doesn't work, I think. Roy Criterion is not my thing.

Everywhere I read they keep focusing on a desired minimum return rather than a desired maximum shortfall, which is what I am doing. Somehow Steiner got me started on this search when he said, on that excel workbook, that shortfall probability is the same as Roy Criterion. But I don't think the Roy Criterion agrees with how he describes shortfall probability here:
http://www.andreassteiner.net/perfo...asurement:Relative_Risk:Shortfall_Probability
Shortfall Probability
The shortfall probability is the probability of return falling short of a certain threshold return...

p(sf)= N[{rth - avr} / v ]

p(sf)... shortfall probability
rth... threshold return
avr... average return
v... volatility
N[]... Normal distribution

This calculation assumes that returns are normally distributed. Shortfall probabilities can also be calculated based on alternative distributional assumption or by estimating empirical probabilities from time series.

Nope... who knows. Maybe... I have to change my blender's name again. First from blender, then to var-estimator, then cvar, now shortfall probability estimator... it's none of these. But why do they call it "shortfall probability" when all they care about is the "minimum rise probability"?
 
Last edited:
Continuing from the previous post:
http://www.trade2win.com/boards/trading-journals/140032-my-journal-3-a-88.html#post1817806

Oh, wow. I hadn't thought about this: what happens if I have a portfolio that implicates a risk of losing more than 1000?

Then, with 10 contracts I would not be able to scale down quickly enough to reduce by one hundredth the probability of blowing out.

Let's say my portfolio causes me a loss of 8000 in one day... ok, so I should worry about the maximum daily loss, which is when I'll have time disable a system.

The maximum daily loss is indeed about 1/10th of the capital, but I'd be safer if instead of allowing one system per 1000 dollars, I allowed one system every 2000 dollars. That's about the right pace.

Even this empirical solution needs some more fine tuning.
 
More on kelly:
View attachment scaling_up_and_scaling_down.xls

I've done some more empirical work.

Even though my chance of survival increases as I decrease the contracts when losing, I've found out that, since I also scale up faster, I will then fall down faster.

But these are only extreme situations (dozens of straight losses and dozens of straight wins). I would need a formula, which I don't have yet, to understand what happens in the situations in between, which are the majority.

I found a calculator here:
Coin Toss Simulator for Fixed Fraction Betting

This is really nice because it also works with probability of losing less than 100%, which is how the usual calculators are. I am happy to have found it, on a website which also has other useful things:
QuantWolf

I still do not know the math to put it all together.

I think the biggest problem I have is that futures contracts aren't infinitely divisible. But then there's also other concepts that I am struggling with. If I knew exactly what they are, I'd have partly solved them.

[...]

More thinking going on in my mind.

I need simplification.

If I set the "period"/bet not to a trade, not to one day, but to a period of one week, then I could roughly simplify my chance of losing 2000 to 33.3% and my chance of making 2000 to 66.7%. That would mean, for the calculator, a 20% win and loss on my present capital of 10k. And my fear would be that of having 4 straight losses which would blow out my account. And by the way, in probability terms that would be about right because it is 0.33^8=1%...

Still not working:
Snap1.jpg

It's now telling me to invest more than 100%.

But then, if I consider the six-months period, and set probability of making 400% to 95% and probability of losing everything to 5%, it still doesn't work:
Snap3.jpg

How do I interpret being told to invest 94%?

I am more lost than ever before.

My own empirical testing is not enough, and kelly is not telling me things that I understand, maybe only because it assumes infinite divisibility of capital/bet.

[...]

The objective here is to make money (not writing an academic paper), so I tried another one of my empirical solutions:
View attachment scaling_up_and_scaling_down_second_version.xls

It seems that the principle of scaling up and scaling down is optimal, because it allows you scale up little by little without increasing excessively the risk of blowing out. The more capital you will have, the more unlikely will you be to blow out the account, because there'll be many smaller intermediate steps where you will scale down.

In the same way, the quicker you will implement the process of scaling down and up, the more effective this method will be.

In very simple terms, I should allocate something like 2000 per system... no wait: a system could be trading silver, and have a potential loss of 4000 dollars, and it's not the same as a system trading GBP, with a potential loss of 200 dollars.

So it's not extra capital per system, nor per contract. It is extra capital per potential loss.

How do I estimate this potential loss?

It's a mixture of frequency of trading, % of wins, and average loss.

I need the exact value.

The blender will have the final word. I should keep my % probability of blowing out to about 3%.

So that means, that for a capital of 15k, I have (according to the blender) a 3% of losing 12k.

And so on. But in order to avoid having to go the blender each time I add a contract/system, what's a good estimate?

I think I am going to use standard deviation which usually is correlated to average loss, and maximum loss, and so on.

This means that roughly, for every system I add, I need... also the accuracy counts. If a system loses 2000 once out of 10 times and makes 2000 the other 9 times, it's not the same as another doing the same 45% and 55% of the time.

I am going to do this: every contract/system added needs as much extra capital as its standard deviation multiplied by 5 and divided by its profit factor.

When that extra capital is there, the system/contract gets added. When it's all lost, then the system/contract gets removed.

The blender will have the final word.

Ideally, I should keep the blender at zero probability of blowing out - which of course doesn't mean zero but only that it hasn't run enough tests to find such an occurrence. Once that is achieved, I still have to add/remove systems as capital increases/decreases, at the mentioned rate (standard deviation multiplied by 5 and divided by its profit factor). Empirically it's pretty simple: as capital increases/decreases, I just add/remove systems so that the blender always says that my chance of going to zero is zero. If it says I could lose 5k and I have 25k, then I am underleveraged. If it says I could lose 10k and I have 10k, then I am overleveraged.

[...]

I am getting closer and closer to understanding all the ingredients needed for my cake but I still do not have one formula to summarize this whole process, and so I am not satisfied. And I don't feel safe: there could be mistakes from this lack of unambiguousness. I need a formula.

Yael Naim new soul - YouTube

[...]

More thinking.

Good links here:
Fixed Fractional and Fixed Ratio Money Management Styles - For Dummies
Fixed Fractional Position Sizing : Day Trading Strategies : Forex Day Trading System : Adaptrade Software

...

I've done a very clear chart here of the 3 ways to go about this whole thing:
View attachment scaling_up_and_scaling_down_3rd_vers.xls

chart_3.jpg

The chart shows a situation where you first make x trades and then you lose x trades. It's a break-even system. A situation that could happen during your trading. The trades are identical for the 3 portfolios: what changes is the amount of money/contracts allocated to those trades.

"Up but not down", just looks so wrong at this point, and yet it's what I've done with the investors: it's identical to the one shown and discussed in a recent post, here:
http://www.trade2win.com/boards/trading-journals/140032-my-journal-3-a-87.html#post1817536

20100614_to_20110926.gif

What happens is that you're assuming the concept of "maximum drawdown" (wrong concept because even if your systems are profitable, you could get unlucky and the historical drawdown could be exceeded and last much longer) and just keep scaling up, but never scaling down when you lose, and the ultimate result in case of an unpredicted drawdown is that you lose more than you made. With the investors we had many more wins than losses (and bigger wins than losses), but we ended up with an unprofitable result (because of the mechanism described) and in the end I was even told that my systems do not work (which is total bull****).

"Up and down" instead shows how you can compound almost as fast as "up but not down" but do not risk as much if things go wrong.

"Fixed contracts" shows that you cannot lose more than you make, because it's 100% in line with the trades - however it would not protect us from blowing out in case the losses happened right after we started trading. So it's not good either. And also, it doesn't benefit from compounding.

A fixed fraction of your capital, as kelly and vince say, is undoubtedly the best way to go about it. However now it is a matter of finding out how to put it into practice. And I've started reasoning about this, too. It seems that the best way is using the blender and making sure that at all times, or at least on a weekly basis, I have a 3% chance of blowing out, thereby constantly reducing contracts/systems in case of a drawdown. Viceversa in case of a profit, constantly increasing your potential profit as you increase your potential % probability of blowing out. If you have 15k, you can afford to lose 12k before blowing out so you just have to keep your 97% of shortfalls within 12k of losses.
 
Last edited:
Back
Top