my journal 3

experimenting with portfolio sharpe ratio: #2

Continuing from here:
http://www.trade2win.com/boards/trading-journals/140032-my-journal-3-a-68.html#post1803304

Recapitulating, yesterday I have found out that (cfr. excel file attached in mentioned post):
1) the sharpe ratio doesn't detect DD - could be a problem
2) the sharpe ratio doesn't detect ROI - could be a problem
3) the sharpe ratio rates (slightly) higher a system with more trades (due to stdev function) - not a problem
4) the (portofolio) sharpe ratio could be lower even when combining two systems with identical sharpe ratios (due to stdev changing differently than average trade) - could be a problem

Now I'll keep on experimenting and seeing how different systems interact in a portfolio and how they affect the portfolio sharpe ratio. So far I am not too happy with all these limits I have discovered. I feel like: why not go back to measuring simple profit? Or Return On Investment?

When you go from building a portfolio by rule-of-thumb to building a portfolio via formulas, in a univocal way, what seemed easy and intuitive suddenly becomes a nightmare. That is, if you're not a mathematician.

In a sense, I now understand and agree with the fact that the sharpe ratio penalizes me if I add a system that has the same sharpe ratio as the others, but a much wider standard deviation:

Snap1.jpg

Because now the overall sharpe ratio is affected by a much bigger stdev, yet the average profit doesn't increase to the same extent. Of course to me this is counter-intuitive. I never would have imagined that 5 systems with the same sharpe ratio could have a combined sharpe ratio which is much lower. In fact, except for the mentioned stdev vs. stdevp factor, I don't think that the sharpe ratio can ever increase by combining different systems, except if instead of measuring trade by trade you start measuring day by day.

I will test it now, by using stdevp instead of stdev. And see if I can get a bunch of systems to have, together, a higher sharpe ratio than the average of their individual sharpe ratios.


SHARPE RATIO NO GOOD FOR ASSESSING A PORTFOLIO


Yeah, it was confirmed pretty confidently, by a bit of testing:
View attachment experimenting_with_sharpe_ratio.xls

This is terrible news: if all trades are taken into account (and you don't change the timeframe used to appraise the sharpe ratio)... I mean this has to be clarified further:

The only reason the sharpe ratio has a tendency to improve by combining systems is (other than mentioned stdev-stdevp issue) if you measure it on a daily profit basis and this is a mistake. If you do that, the wins and losses will offset each other (in favor of profit), and the more systems you add, the better your sharpe ratio gets, because since the systems are profitable, wins will tend to hide losses, and make the equity curve smoother and the sharpe ratio higher, but this is not correct, because the trades taking place in a day do not always happen during the same hours, and therefore the win offsetting the loss could be happening not during but after the loss, which means it only compensates on paper but not in real trading.

So, the only correct way to measure the sharpe ratios and combined sharpe ratio is on a trade-by-trade basis.

And if you do that, adding up systems does not (except for stdev-stdevp issue) in any way improve the sharpe ratio.

But what we do know is that indeed, the more systems you trade the better it is, because you diversify, so how do we deal with the fact that the sharpe ratio doesn't measure it? Why?

(Indeed, the sharpe ratio is at best equal to the average of the sharpe ratios of the systems composing the portfolio).

Why?

I think the key of this is the drawdown. The problem is that, by counting the daily profit (wrong method) vs the individual trades (right method) we had found an unorthodox way to have the sharpe ratio take into account drawdown and how drawdown is decreased by diversification, because other SR doesn't give a **** about it. It doesn't give a **** about the good effect of diversification, because, as I saw yesterday, the sharpe ratio does not care about the order of the trades, so it doesn't detect the drawdown, and yet the diversification is what reduces the drawdown, and this is a big problem. Big problem. That makes me want to dump the sharpe ratio as far as a tool to build a portfolio.

Yes, I do lack a lot of math skills, which would definitely help in these reasoning. I can't dismiss the sharpe ratio like this without even knowing how to read summation notation. On the other hand, these findings are pretty clear. Excel speaks clearly (cfr. file I attached in yesterday's post).

So I will still use the sharpe ratio for adding up different systems and finding the good ones (because for that specific task it is good), but I will stop using it for building a portfolio, at least until things get clearer (and it'll take a lot of math for that). Instead, for building a portfolio, I will use the following empirical methods.


EMPIRICAL METHODS FOR PUTTING TOGETHER A PORTFOLIO

Here's the deal: monte carlo blender.

1) I identify the good systems with my usual scatter plot with forward-tested trades on x-axis and sharpe ratio on y-axis.

2) I stick the trades by those systems into my monte carlo blender, after having multiplied their trades by thousands (as much as one excel column can hold), and come up with an estimate of the maximum drawdowns by starting on every specific day of the new (resampled and enlarged) sample.

3) If I come up with a zero probability of a drawdown exceeding my capital both in the original sample and in the resampled sample, then the systems are ready to be traded. Obviously there's still going to be a probability of blowing out: it didn't come up just because the resampling wasn't wide enough. And I also know that the systems will work in the future than in the past, so anyway: success is never certain, but what I am saying is that this method of building a portfolio and scaling up is more effective than the sharpe ratio...

I don't know. Maybe not. It is reliable, and I don't know any better, but it's a pain in the ass, it's not smooth, and... it sucks.

But sharpe ratio sucks worse. I need to find something else. I'll still read up on both markowitz and kelly but sharpe ratio right now doesn't seem to be an option any more, mainly for its incapability of detecting Drawdown and Return on Investment.

I might even stop my testing on sharpe ratio altogether. Yeah, I'll stop it for now. I can always resume it later. Maybe after I'll figure out some more math. Math at this point is indispensable, aside from being a personal source of satisfaction and a matter of pride. I want to become proficient in financial math, or even just in portfolio math. My first profits beyond 10k will be reinvested in math private lessons.

[...]

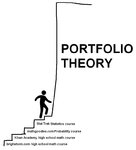
This is a good summary of the size of the steps I've been climbing in the last five months, with my math review, and the steps that I have to climb now. It really sucks that I can't find anything intermediate right now, anything smaller. I went from elementary school math to the end of high school math, but now I skipped 4 years of college math, and am confronted with graduate school math or similar and it's an obstacle that I do not know how to tackle and a step that I don't know how to climb:
Snap3.jpg
 
Last edited:
gbl and qg torture

Just a few weeks ago, I had said: where could qg and gbl ever go?

Even if they didn't go that far and I'm only losing 1000 on qg and 300 on gbl, it's been exhausting to me, and i am way too impatient for this position trading, or whatever it's called. I might end up being right on my predictions, but this wait is unbearable to me.

This thing is definitely not for me. No matter how promising an opportunity seems to be, like in both of these cases, it's not for me.

This is exhausting, seeing my gbl and qg positions, day after day, in the red. This is not the type of trading I can handle. I really hope gbl will fall at least tomorrow, because in two days I have to close it, due to the March contract expiring.

I hope I'll remember how I got into this nightmare and won't do it again. The improptu trades are bad, the long-awaited opportunities are bad... everything is bad in the realm of discretionary trading, for someone as impatient and undercapitalized as me. Besides, due to these two trades, I didn't have the margin and missed out on thousands of dollars of profit in the last two weeks. I am holding them open still because I hope to break even and catch up with my systems.

I can't believe the GBL is going for so long against me.
 
Another day of discretionary hell

GBL is still high, and QG is still falling.

And I am still losing money from those two "safe" discretionary trades. Contango at work on natural gas and backwardation at work on GBL, so when I'll roll over I'll lose much of the potential profit and the reason for being in the trade. So I don't know if I should even roll over on GBL, since it starts one point lower and today is the last day I can hold it, because I have to close the position.

Yeah, what the hell. I am gonna hold both positions and roll over on GBL. It's impossible that they'll keep going against me.
 
Last edited:
A Practitioner’s Guide to Mathematical Finance

Another interesting 15-pages paper, or rather, a powerpoint presentation. Pretty easy to read, and pretty good synthesis, although it is more modest than the title would make you expect:
http://www.pstat.ucsb.edu/crfms/inaugural slide/Peter-Carr.pdf

All these PhDs either write 15-pages-long essays or 300-pages-long books. And so far I've found more useful things in the 15-pages papers.
 
Last edited:
math illiteracy: summation notation

You remember how I said that I wanted to take private lessons in math. Neither of the people I contacted replied to my email or message through a friend. Good, because I'll save money.

In the meanwhile, since my math illiteracy all comes down to ignorance of summation notation, I've been looking for summation notation exercises:
https://www.google.com/search?num=1...en-US:official&q=summation+notation+exercises

Khan (and his Academy) just won't do it, because if he did it, he would he my first choice. So I'm going to look for something as close as possible to his exercises, which means as interactive as possible. I don't like those .pdf files with the answer at the end.

What has to be mentioned is that summation notation is not that appealing to me right now. Extremely boring in fact. But as i said, all portfolio theory papers/books whether on page 2 or on page 10, end up using it extensively, to the point that I cannot keep reading anything anymore without becoming proficient in summation notation.

So I will first list those exercises here, and then I'll get to doing them.

1) .pdf/.html exercises (non-interactive, with answers at the end):
http://maths.mq.edu.au/numeracy/web_mums/module4/Worksheet46/module4.pdf
http://www.mathcentre.ac.uk/resources/leaflets/firstaidkits/2_22.pdf
Summation Notation
Summation Notation
http://www.mash.dept.shef.ac.uk/Resources/sigma.pdf
http://sydney.edu.au/stuserv/documents/maths_learning_centre/sigma.pdf
http://www.austincc.edu/jthom/SigmaNotationExer.pdf and answers

Good, thank god, it's mostly .edu and such. I don't feel so ignorant any more, as when I was doing exercises on websites for teen-agers(but that's the best teaching there is).

2) interactive exercises:
Practice with Sigma Notation
Arithmetic Series
Algebra II Recipe: Using Summation Notation
Summation, or Sigma, Notation
Summation Notation
http://www.math.ucdavis.edu/~kouba/CalcTwoDIRECTORY/summationdirectory/Summation.html

Incidentally, I just discovered that I had gone through some of these links before, here:
http://www.trade2win.com/boards/trading-journals/85510-my-journal-2-a-659.html#post1709558
But for one reason or another, those exercises done a few months ago were not enough.

Incidentally, I accidentally came across a good tutorial:
Summation Notation

Ok, enough research for now. I'll have to do them now.

[...]

Yes! A colleague just told me that my roommate will be sick the whole month of March, and therefore I'll have the room all to myself for another month. A lot of portfolio theory to read. A peaceful month without any harassment. My door shut, no one will come in... just awesome.

In the meanwhile, between summation notation exercises, I've started to read the Anderson-Faff paper, that's also in my signature: "Optimal f and Portfolio Return. Optimisation in US Futures Markets". For now it's user-friendly, and simple, but I am only on page 2 and the formulas start on the next page.

[...]

I was doing these exercises, which are just great for me (not too hard, nor too easy), and I don't know how, but I managed to solve this one, too, and without looking at their multiple choices:
Practice with Sigma Notation

Snap1.jpg

I am very proud of having almost finished my first summation notation exam, even though the pelicans indicate that the exercise is for high school students.

[...]

Yes, yes, yes! I got all 10 exercises right. My first summation notation exercise was a complete success! Yes!

I am taking a break for today, and I will resume tomorrow. And now back to reading the Anderson-Faff paper.
 
Last edited:
Optimal f with futures? Not with my small capital.

I am on the Anderson-Faff paper, "Optimal f and Portfolio Return. Optimisation in US Futures Markets".

They cite Vince's book, which I have but didn't read much of it, because it's too heavy for me.

I feel like this optimal f formula should be discussed in 3 pages at the most. But no one ever does it. Not even Kelly himself.

What I want to say about this thing is that (aside from the fact that I didn't read these books/papers, so this could explain the problem) I don't understand how on earth I could apply optimal f and the Kelly Criterion to my trading in futures. Kelly presupposes that capital is infinitely divisible. And this is not possible with stocks, already, so how on earth is this going to be possible with futures, and what about futures traded by someone who has a capital of 10k like I do? With my capital, I am already using more than optimal f, and I risk blowing out my account at any time.

Since this is just a 15-pages paper, I am really going to read it this time and see how on earth they'll teach me a Kelly-derived method for optimal growth. I mean, they could, and it could work, but only once I get beyond a capital of 100k. Right now, with 10k, I can only afford to lose a few times before blowing out the account. They either tell me that I can start using it once I can afford 100 futures, or this is not going to make any sense to me now that I can afford only 1 or 2 futures at the most.

Paranoid Android - Radiohead - YouTube

[...]

I am on page 5 now. This paper has the great quality of synthesizing and explaining Vince's 200 pages book. I think I found a good use for all these papers: they explain and summarize to me other very long books. I may even not understand the paper itself, and its formulas (that's the case, more or less, right now). But they're all good at explaining what other authors are saying in their long books. You know why they do it? I was just talking about this to my father yesterday or the day before. They do this because they have to show to other academics that they've read the subject, and so all these footnotes, bibliography, and mentioning of previous academic books is not really to explain things to me, but to prove to other academics that they researched the subject and read all the important works about it. Pretty sad (what a waste of time, too), but nonetheless it is useful to me, because they end up explaining something from the other authors. Yes, at the same time their work becomes ten times as long, due to this bull**** ingredient.

Paranoid Android (Radiohead) on violin & piano - Entropy Ensemble - YouTube

Also, I asked my dad: but isn't it a pity that by having made this process so burdensome a lot of discoveries and intelligence is blocked out from the academic world? And he said to me that Marconi was not an academic, but that didn't stop him from "inventing" the radio (you know what i mean) and from getting credit for it. But yeah, progress is still hampered and slowed down by this academic filter. But we also do not know that in fact it isn't a positive filter for even worse bull****. If you take for granted that all academics are smart, and the others are not worth listening to, this might still be better than listening to everyone without prejudices, only to find out that 95% of them are indeed idiots. So this might be the best arrangement. Another good arrangement, probably better, would be to have a certified IQ score of each person you're talking to. But that isn't a reality right now.

Exit Music (Radiohead) on violin and piano - YouTube
 
Last edited:
Ok, dude. I rolled over on the GBL (backwardation had it 2 points lower! March is at 140.50 and June at 138.80 - mother ****ers, whoever is responsible for this... forex futures have no contango/backwardation, nor do the stock indexes futures). There's no way I will miss this move down. There's lots of points to be made on GBL. I am confident that I will make 1000 or 2000 in the next two days, from GBL and QG. Then I'll retire as a discretionary trader and let them systems trade.

 
Last edited:
Oh, god... I was forgetting E.P.Chan

This is basically the best book ever written on automated trading... and I forgot to re-read, with what I know now, chapter 6, on portfolio managament of E.P.Chan's book on automated trading:
http://www.quantobjects.com/assets/files/AlgoTra.pdf

And guess what... so far he seems to be dead on target and in agreement with everything I have understood from all the papers I've read.

I'll quote the best parts as I keep reading:
Furthermore, if you have more than one strategy, you will also need to find a way to optimally allocate capital among them so as to maximize overall risk-adjusted return.
Markowitz, again ("risk-adjusted return").
...and the central tool we use is called the Kelly formula
Kelly, again.
Dr. Edward Thorp, whom I mentioned in the preface, has written an excellent expository article on this subject in one of his papers (Thorp, 1997), and I shall follow his discussion closely in this chapter. (Dr. Thorp’s discussion is centered on a portfolio of securities, and mine is constructed around a portfolio of strategies. However, the mathematics are almost identical.)
Thorp, again.
...If we assume that the strategies are all statistically independent, the covariance matrix becomes a diagonal matrix, with the diagonal elements equal to the variance of the individual strategies. This leads to an especially simple formula...
Lost, again.

I am gonna try and do this. Make some more money with my crappy rule-of-thumb personal portfolio theory, and then pay some math lady to come here and explain just Chan. Just Chan - he's got it all synthesized in two pages. Screw everyone else. I am not going to get a math dude, because he'll try to hack my laptop and/or wifi and take my systems from me. The guys are hackers, interested in finance, and assholes. The ladies are just interested in math, and are not going to be a threat.

I need to get to 20k, and all this will be figured out. Just let me get to 20k, god of randomness.
 
Last edited:
I changed my signature again, and removed over 50% of the authors I felt I needed to read/watch/listen to. Now, from what I have figured out, the only five names that I need focus on are these, in order of relevance: Chan, Estrada, Sewell, Shiller, Geanakoplos. Those last two names are just two lectures on the CAP Model, but they're useful because lectures tell you something that books cannot tell you: the tone, the talking, and the amount of synthesis they do. It's one of those rare instances when academics get rid of all the bull****, all the premises, all the footnotes, all the bibliography, all the citations, and just tell you what matters.

Sewell is pretty much the same thing: a synthesis of (the good) portfolio theory (and the history of it). Instead, what I'll need math help with is Chan and Estrada, because that's precisely the heart of the subject: getting CAPM to work with Kelly.

I already asked another user on this forum, since lately he's been asking the same questions I've been asking. But I think I'll need to do this alone. So I need a lot more summation and product notation practice, and I need to dive into this material and swim in it, for months. And I need those private lessons of math. But hopefully I will get some peace of mind, thanks to some profit from trading. If I get above 20k, then peace of mind will follow.

Furthermore, I don't need to know these authors inside out. I just need to read one paper (Estrada), one chapter (Chan), one web page (Sewell) and watch two lectures (Shiller and Geanakoplos). If I can understand this limited material, by watching and reading several times and in the company of mathematicians, then I can figure out, for sure, what I need for my portfolio. And, since I'm good at explaining things, after figuring it out, my expertise will be more useful than that of any of these academics, because they can't explain jack ****. Check out this lecture: he's speaking as fast as possible and making it as hard as possible (I am referring to a few minutes into the lecture, when he starts writing formulas):

22. Risk Aversion and the Capital Asset Pricing Theorem - YouTube
 
Last edited:
European Central Bank - Statistical Data Warehouse

The ECB has this great website here, with all sorts of statistics, among which these pages:
Key interest rates - Monetary operations - ECB Statistical Data Warehouse
Chart - Key interest rates - Monetary operations - ECB Statistical Data Warehouse
ECB: Euro area economic and financial data

Maybe this is the best one:
ECB Statistical Data Warehouse

Among the other things, on this last link, there's a complete history of EUR/USD:

quickviewChart.png


And on this mentioned page they have this awesome chart:
Chart - Key interest rates - Monetary operations - ECB Statistical Data Warehouse

browssdsdsChart.png


My concern about ECB interest rates is due to my open GBL position

The reason I am on ECB's website is that I am monitoring the interest rates, due to my GBL short position, and today at 12.45 there will be an important meeting:
Economic Calendar | DailyFX Forex Events Calendar | DailyFX

Snap1.jpg


ECB Rate Announcement and Press Conference - Euro-zone
The European Central Bank's decision to increase, decrease, or maintain interest rates. Controlling interest rates is the key mechanism of monetary policy, and the ECB influences interest rates by first changing the "overnight rate" through the purchase or sale of government bonds. Lowering rates can spur economic growth but may incite inflationary pressures. On the other hand, increasing rates slows inflation but can stymie growth.

The European Central Bank makes a concerted effort to be transparent in its policy. Frequent speeches by Bank Governers make policy goals clear and the Bank adheres to a stated inflation target of 2 percent, changing rates accordingly to meet that goal. Because of this, rate decisions are generally well anticipated, but very important nonetheless.

The ECB's rate decision has an enormous influence on financial markets. Because the ECB interest rate is essentially the return investors receive while holding Euros, changes in rates affect the exchange rate of the Euro.

Because rate changes are usually well anticipated, the actual decision does not tend to impact the market. But if the ECB changes rates they will hold a press conference where some rationale for the decision is offered. Market participants pay close attention to the press conference, hoping to clue in on the likelihood of further rate changes. Often, the language used in the press conference holds important signals to how ECB feels about inflation and the economy. The ECB President's language will be "hawish" if he is pessimistic about the inflation outlook for the economy. In that case, the market sees a higher chance of future rate hike. Conversely, if the ECB President believes inflation is in check, his remarks will be "dovish," and the market perceives a future rate increase to be unlikely.
Inflation? Here it is, from one of those ECB links:
ECB Statistical Data Warehouse

inflation.png


My reasoning on interaction between inflation, interest rates and bund prices
(first time ever for a pure technical analyst like me)

So... hm... let me think. ECB interest rates are at their lowest, Eurozone inflation is at its highest, so this should bring an increase in rates - and they can't go much lower anyway. And if rates rise, the bund, which is at its highest, should fall, because, from what I've been reading in the past few days (cfr. this post and my comparison of bund to ECB interest rates), bund falls when interest rates rise.

So ok, starting at 12.45 GMT today I should be making a lot of money on my open GBL position. Let's see if it happens. Finally some profit.

[...]

Dude! It's happening!

Eurex - Fixed Income Derivatives

Snap2.jpg

After waiting like a fool for days and days, I am finally making some real money (500 dollars right now).

[...]

Ok, the live webcast is here:
ECB: Webcasts: ECB monetary policy decisions

Straight from the ECB's website. It should start in 18 minutes, at 14.30 CET. According to what I've read, this will affect the markets as well. The press release at 13.45 CET didn't affect the BUND in any noticeable way.

[...]

Now I don't know what he's saying, because the webcast is not working, but the GBL is falling, and this is all I care about.

Snap3.jpg

[...]

Ok, back at home, and the webcast here is working (I had to install some sort of applet). Also, I found the youtube channel of the ECB, so I'll watch the whole thing later:
ecbeuro's Channel - YouTube

Dude... check this out.

Price stability: why is it important for you ? - YouTube

Great lesson on interest rates and inflation, starting from minute 5, for me, being so ignorant about it. The same video can be found here:
ECB: Cartoon on price stability for schools

[...]

It's really cool, that cartoon says so much about interest rates, inflation and deflation in just three minutes, from 4.30 to 7.30. Draghi's press conference is over, and it's available here:
ECB: Webcasts: ECB monetary policy decisions

As I listen to it, he says the same things the cartoon summarized so well. Where they want inflation (slightly below 2%), what causes inflation other than interest rates (energy prices), and that the objective of ECB is to stabilize prices. The cartoon is clear and concise... awesome. ECB is very user-friendly, and close to the people. Very much unlike all these academic books I've been reading. Good job, fellows.

[...]

As I was listening to the press conference, more than once, I thought Draghi (who probably has less of an Italian accent than I do) sounded a bit like Christopher Walken. Ah ah... then i found a comment on a youtube video and here:
Live Webcast Of ECB Press Conference | ZeroHedge
since when does christopher walken run european monetary policy?

So I guess I am not the only one who noticed it.

SNL Christopher Walken - Lost Sketch 1 - YouTube

[...]

Finally!

I am the first one to view this, today's ECB press conference:

ECB Press Conference - 8 March 2012 - YouTube

It had zero views when I accessed it and now it has 4. I liked it. It's pretty clear, I understood everything. Much better than those lectures I've been watching.
 
Last edited:
back to work on summation notation

I am always at the office, and the roommate won't be here for the whole month of March. What did I do to get my wish fulfilled by the god of randomness? He had him stay at home to recover from some surgery. Go figure.

Anyway, the god of randomness is not caring much about my QG position, which is losing - unbelievable how much natural gas can fall. And I am seeing, day after day, my losing position open, now at -1100 dollars and counting. And I am being reminded that I am not god, and that god is not doing anything for me. Losing and losing... if there is any god in this business it is E.P.Chan, and his book on automated trading. This is one dude who has really figured it all out and is helping us humans out, with his insightful, simple and concise book. Clear and concise, which nonetheless I cannot fully understand - due to my math illiteracy.

Speaking of which, I have just finished my math review exercises at Khan Academy (those will never end - I get about 10 per day).

But Khan doesn't do summation notation, so I will go to my previous post and find me some exercises, after finishing my first set of exercises yesterday at regentsprep.org.

What do we do today?

Let's keep going one step at a time, with the easy stuff first. Easy means interactive, so... ok, I'll do this:
Arithmetic Series
Geometric Series

Ok, now they had me review the "basics of arithmetic sequences"... let's get this done, too:
Introduction to Sequences and Series
Arithmetic Sequences

Good thing I am alone in this room and not in the next room, where people are endlessly talking about nonsense. There's nothing to talk about, but they always find something to say, because silence makes them uncomfortable. Endlessly talking... by the way, the famous Vito (The Chimp) is in the other room. I ranted about him for almost a year, on my journal 2.

Ok, I am stuck. I have to finish it at home or tomorrow. Probably tomorrow it's best. I've only covered 2 of the 4 lessons (the ones on sequences but not the ones on series).

Ok, time to go home. Finally. Let's hope for some money today.
 
Last edited:
back at the office

Holy cow, I am so set today. First of all, my colleague is not here. Secondly, the boss is not here. They're both sick.

I came here at 9, so I can leave at 15. I did all the work there was to do in just one hour.

I just checked, and both GBL and QG are going in my favor.

Now I want to try again a google search for excel files with sharpe ratio, efficient frontier and kelly criterion calculations and formulas.

Then I'll do khan review exercises and some more summation notation exercises.
 
google search for excel files with markowitz, kelly, sharpe formulas

https://www.google.com/search?as_q=...y&safe=images&tbs=&as_filetype=xls&as_rights=

---------------------------------------
1) This is the first relevant hit:
http://nickgogerty.typepad.com/files/kellysharpechan.xls
It makes reference to Chan's book. Not a coincidence of course, after all the nice things I've been saying about his book. He's the one, maybe the only one, who manages to put it all together in a simple way - even though still not clear enough for me to understand it. Also the file is great, and dead on target, but not clear enough. I'll post it just in case they remove it:
View attachment kellysharpechan.xls

---------------------------------------
2) This is "just" a list of books and not relevant to my search but still interesting and worth looking at:
http://www.wiley.com/legacy/wileychi/eqf/docs/EQF_Master_list.xls
but it's the most relevant list of books I've ever seen on the subject I'm researching. I'll post this file, too, just in case they remove it:
View attachment EQF_Master_list.xls
I've done a pivot on it, to see where the authors writing these books on portfolio are mostly from and it turns out they're from Columbia University (it's just for Wiley publishing company of course).

They've got a whole list of sections for these books (marked in red what I am interested in):
Actuarial Methods
Arbitrage Theory
Asset Allocation & Portfolio Optimization
Asset Pricing Models
Asset-Backed & Mortgage-Backed Securities
Credit Derivatives
Credit Risk
Energy & Commodity Derivatives
Equity Derivatives: Pricing Models
Equity Derivatives: Products & Strategies
Financial Econometrics
Foreign Exchange Derivatives
History of Quantitative Modeling in Finance
Interest Rate Derivatives
Market Microstructure
Mathematical Tools
Option Pricing: Fundamentals
PDEs and Computational Methods
Risk Management
Simulation Methods in Financial Engineering
The only one dead on target is "Asset Allocation & Portfolio Optimization". What books do they have? I will mark in red those that sound right:
Mutual Funds
Style Analysis and Performance Attribution
Hedge Funds: characteristics, performance measures, indices of
Performance Measures
Sharpe ratio
Markowitz Efficient Frontier
Expected Utility Maximization
Black-Litterman approach
Fixed-mix strategy
Stochastic Control
Transaction Costs
Behavioral Portfolio Selection
Kelly Problem
Drawdown minimization
Universal portfolios
Risk Sensitive Asset Management
Model Ambiguity and Robust Portfolio Selection
Diversification
Merton problem
Mean-Variance Hedging
Hmm, let's stop here. Now I can't just go and read all these books. But it's good to know these books exist.

I look for one of them and found this:
Drawdown Minimization - Encyclopedia of Quantitative Finance - Browne - Wiley Online Library

One measure of riskiness of an investment is “drawdown”, defined, most often in the asset management space, as the decline in net asset value from a historic high point. Another measure of riskiness that is oftentimes confused terminologically with drawdown is that of “shortfall”, which is simply the gap, or loss level of the current value from the initial or some other given value. In this article, we review the multiperiod continuous time literature on optimal portfolio choice and fund manager incentives in the presence on drawdown and shortfall minimization. The models differ in their assumptions regarding investment horizons (finite or infinite), constraints (fixed or stochastic benchmark), stochastic processes (diffusion with and without jumps) as well as objective function (general goal problem or expected utility maximization). In general, without transactions costs, the incorporation of drawdown constraints induces a portfolio insurance strategy, which, in the stationary stochastic model case, is that of a constant proportions portfolio insurance (CPPI) with different “floor” levels determined by the horizon and the objective.
I guess it teaches me the word I was looking for, all these months: "expected shortfall". I've done my empirical research to minimize shortfall, and I didn't know it was called "shortfall", but I sensed it wasn't exactly the same thing as "drawdown". In fact I often called it "fall".

Interesting, they've even got a wikipedia entry:
Expected shortfall - Wikipedia, the free encyclopedia

And indeed, I had been measuring it in percentage terms. Remember? I said "WIth the capital I have now, I have a 5% chance of blowing out".

Let's keep going.

---------------------------------------
3) Another interesting list of financial books (this time with a list of the chapters and authors' biographies):
http://books.optin.com.au/books/xls/PT0843.xls
I can't stop this time. I need to keep going.

---------------------------------------
4) Another list of sessions from some course:
http://students.washington.edu/dowdawgs/education/sessions.xls

But then, from it, I got this even more relevant link on Ed Seykota's website:
Risk
Fixed Bet and Fixed-Fraction Bet

Our betting system must define the bet. One way to define the bet is to make it a constant fixed amount, say $10 each time, no matter how much we win or lose. This is a FIXED BET system. In this case, as in fixed-betting systems in general, our $1,000 EQUITY might increase or decrease to the point where the $10 fixed bet becomes proportionately too large or small to be a good bet.

To remedy this problem of the equity drifting out of proportion to the fixed bet, we might define the bet as as FIXED-FRACTION of our equity. A 1% fixed-fraction bet would, on our original $1,000, also lead to a $10 bet. This time, however, as our equity rises and falls, our fixed-fraction bet stays in proportion to our equity.

One interesting artifact of fixed-fraction betting, is that, since the bet stays proportional to the equity, it is theoretically impossible to go entirely broke so the official risk of total ruin is zero. In actual practice, however the disintegration of an enterprise has more to do with the psychological UNCLE POINT; see below.
Oh my god... with the investors we used a Fixed Bet system, which is obviously wrong, according to any rationale. I can't believe they got me to do that, and with their money! And I was so ignorant that it seemed to make sense to me. We kept on losing for an entire month (September 2011) and didn't scale down at all, until we stopped trading altogether...

On the other hand, with futures, a fixed fraction approach is very complex, because, with a small capital (all the way up to 200k), it's hard to scale down and scale up. Also, you don't want to lose and scale down, and then miss the win because you scaled down. So, after all, with futures, what the investors had me do, is not that unreasonable. But it is still wrong, and I must find a way to fix it. It's not going to be easy.

Ed Seykota's advice is all good, but it's not enough. It's not a complete portfolio method.

---------------------------------------
Before ending this google search session of today, I will browse in those two personal websites (link #1 and #4), to see if I find anything useful.
http://nickgogerty.typepad.com/files
Index of /dowdawgs/education

This is good:
Widget for Converting Sharpe to Daily VaR (value at risk) (Designing better futures)
Quantitative Trading, Ernest P. Chan
Grand Unification Theory of equities: a little something to upset everyone. (Designing better futures)

Quoting what I like from here:
Quantitative Trading, Ernest P. Chan

Chan has broad experience with tools and techniques for various strategies and explains things clearly with the voice of an experienced practitioner.
Many traders and asset managers think in terms of $’s or % of portfolio at risk. Many trade with rules of thumb but may not have studied how to maximize the terminal wealth of their strategies and approaches.
All of them can learn a little thinking about the Kelly and Sharpe Ratio relationship.
I told you. It's all about using together Kelly and Sharpe.
I recently created a free spreadsheet tool for exploring this relationship based on Chan's work.
I would highly recommend Chan’s book for the fundamental, technical or quant trader. Chan is concise and clear in teaching the basic methods and tools for a quant. You can visit Chan's excellent blog to get an idea of his thought processes.

From here (where the original excel file, "kellysharpechan.xls", is offered and explained):
Grand Unification Theory of equities: a little something to upset everyone. (Designing better futures)
Recently Ernest Chan published Quantitative trading. For initiates to quant trading this book rules. The introduction to basic strategies is well done, clear and concise.

One section in the book ties the Sharpe ratio and the Kelly formula together giving the optimal leverage size for maximizing terminal wealth based on Sharpe ratio and thus the expected optimal annualized growth rate for any stable system.
Wow, this guy is amazing:
nick gogerty
http://www.gogerty.com/

I am tempted to write to him and ask him for help. It's him, Chan, and Estrada now. I don't need to look anywhere else.

Most of the time I don't understand more than half of what he's talking about, like here:
Anti-fragility, robustness and systems thinking « Thinking in systems

But the half I understand makes me identify him as dead on target, so I need to keep on following him.

Here's another file I don't understand but I can tell it's totally relevant to what I am doing:
Widget for Converting Sharpe to Daily VaR (value at risk) (Designing better futures)
http://nickgogerty.typepad.com/files/sharpetovar.xls


-----------------------------------
As Gogerty advised, I will now read Chan's blog and forget about math exercises for today. I am doing this work, which is just as important:
Quantitative Trading

Quoting from here:
Quantitative Trading: Sorry, your return is too high for us

...One paragraph in the book stood out: "I've worked closely on the third-party marketing and capital introduction/prime brokerage side of the business, and I often see both types of firms deny clients service [to funds with high returns and high risk] ... Nobody wants to be associated with a manager aiming at 30 percent a month returns."

Maybe not aiming at, but what's wrong with achieving a 30 percent a month returns? I have actually met institutional investors who don't want to look at a fund that actually achieved double-digit monthly returns. Presumably that's because they believe that a high return automatically implies high risk, and also presumably a high leverage as well. I would argue that there are 2 reasons not to completely dismiss such funds out-of-hand:

1) Leverage should not be determined arbitrarily, but should be based on the minimum of what's dictated by half-Kelly (see my extensive discussions of Kelly formula on this blog and in my book) and what's dictated by the maximum single-day drawdown seen historically or in VaR simulations. And if this minimum still turns out to be higher than what most institutional investors are comfortable with, one should be bold enough to adopt it in your fund.

2) As an investor, there is an easy way to control leverage and risk: just apply Constant Proportion Portfolio Insurance (a concept also discussed elsewhere on this blog). For example, if the fund manager tells you the fund employs a constant 10x leverage (as dictated by the risk analysis outlined in 1) and you are only comfortable with 5x leverage, just invest half your capital into the fund, and keep the other half as cash in your bank account! Going forward, if the fund loses money, your effective leverage would have decreased to below 5x. Say you invested $1M into the fund, and kept $1M in the bank. And say the fund lost $0.5M. Your total equity is now $1.5M, and the fund manager is supposed to trade a $0.5M*10=$5M portfolio. Your effective leverage is now only 3.33x, well within your tolerance. Now if instead, the fund made money, you can immediately withdraw some of the profits to keep your effective leverage at 5x. So, say the fund made $0.5M. Your equity is now $2.5M, and the fund manager is supposed to trade a $1.5M*10=$15M portfolio. If you don't withdraw, this would increase your effective leverage to 6x. But if you immediately withdraw $0.25M, then the fund manager will trade a $1.25M*10=$12.5M portfolio, giving you an effective leverage of the desired 5x.

If you are an investor in hedge funds, please let us know what you think of this scheme in the comments section!
Posted by Ernie Chan at 12:52 PM 30 comments
This is just awesome!!!

I found the places to browse. I would just like to have some more brains and math skills to understand the details. This is it! Chan is the man, Gogerty, Estrada... these guys!

Another great blog entry:
Quantitative Trading: What are we to do with Sharpe ratio?
So what are we to do with Sharpe ratio, with its inherent reliance on Gaussian distributions? Clearly, it is useful for measuring high frequency strategies which you can count on to generate consistent returns every day, but which has limited catastrophic risks. But it is less useful for measuring statistical arbitrage strategies that hold positions over multiple days, since there may well be substantial hidden catastrophic risks in these strategies that would not be revealed by their track record and standard deviation of returns alone. As for strategies that are designed to benefit from catastrophes, such as Mike Burry's CDS purchases or Nassim Taleb's options purchases, it is completely useless.

Chan's blog is a gold mine:
Quantitative Trading: Picking up nickels in front of steamrollers
In contrast to the LTCM debacle, where they would keep piling on to a losing position day after day hoping it would mean-revert some day, short-term traders liquidate their positions at the end of a fixed time period, whether they win or lose. This greatly limits the possibility of ruin and leaves our equity intact to fight another day in the statistical game.

So, call me old-fashioned, but I still love high Sharpe-ratio strategies.

Ok, now I was reading a comment here:
http://epchan.blogspot.com/2009/02/limitation-of-sharpe-ratio.html
Michal Kecera said...

Mr. Chan, I read your latest book and was very pleased with the quality and the amount of information it contained. In one of the first chapters you mentioned that readers will gain password to the subscription part of your web site in later chapters. Can you please specify where it is, as I was unable to locate it. Thank you.

Best regards,

Michal Kecera
So, I went and found the password and got access to the website and here's the file I will quote:
http://epchan.com/downloads/compound_return.pdf
...However, often we are faced with a choice of different strategies with different expected returns and risk. How do we choose between them? Many traders think that we should pick the one with the highest Sharpe ratio. This is reasonable if a trader fix each of his or her bet to have a constant size. But if you are a trader interested in maximizing long-run wealth (like the Kelly investor I mentioned in the previous article), the bet size should always be proportional to the compounded return. Maximizing Sharpe ratio does not guarantee maximal growth for multi-period returns. Maximizing (m – s^2)/2 does.

For further reading:
1) Miller, Stephen J. The Arithmetic and Geometric Mean Inequality.
http://www.math.princeton.edu/mathlab/book/papers/ArithMeanGeoMean.pdf
2) Sharpe, William. Multi-period Returns.
http://www.stanford.edu/~wfsharpe/mia/rr/mia_rr3.htm
3) Poundstone, William. (2005). Fortune’s Formula. New York: Hill and Wang.
This seems to be even more concise than I remember the book to be, but do I understand it?

This (m – s^2)/2 seems to be precisely the recipe I need. Yeah, now it would be useless, because I cannot choose the bet size with my small capital: it's either nothing or one contract. But I need it for later.

Furthermore I need to reason on how to mix the systems together even now, because, other than by using empirical methods (resampling and "shortfall minimization"), I would like to know how the recipe works and why adding some systems rather than others minimizes shortfall.

A lot of reasoning ahead for me, but I am getting closer to it. And, to answer my own question, I don't understand this magical formula: (m – s^2)/2

---------

And I managed to do all the Khan review exercises (13 today).

I got to the point where I've been going a bit in too many directions, and now I should slow down, regroup my thinking, and tackle, one at a time, these few tasks that I've successfully identified.

----------

Before going home, I found some more time to read another one of those papers and quote what I like/understand:
http://epchan.com/downloads/How_much_leverage_should_you_use.pdf
How much leverage should you use? Maximizing growth without risking bankruptcy
By Ernest P. Chan, Ph.D.
October 15, 2006

Many hedge fund disasters come not from making the wrong bets – that happen to the
best of us – but from making too big a bet by overleveraging. On the other hand, without
using leverage (i.e. borrowing on margin to buy stocks), we often cannot realize the full
growth potential of our investment strategy. So how much leverage should you use?
He really understands me. That's what has been happening to me for years: blowing out the account despite having an edge.
This quantity f looks like the familiar Sharpe ratio, but it is not, since the denominator is s^2, not s as in the Sharpe ratio.
Fascinating. He has a gift for simplification. Not that I understood everything, because I didn't.
It is easy to calculate f, which comes out to be 12.5.

This is a shocking number. This is telling you that for this strategy, you should be
leveraging your equity 12.5 times! If you have $100,000 in cash to invest, and if you
really believe the expected values of your returns and Sharpe ratio, you should borrow
money to trade a $1.2 million portfolio!
Now I understand even less. But he's always as clear as ever. He speaks clearly.
Fixing the leverage of a portfolio is not as easy or intuitive as it sounds. Back to our
$100,000 example. Say you followed the (half-) Kelly criterion and bought a portfolio
worth $625,000 with some borrowed money. The next day, disaster struck, and you lost
5%, or $31,250, of the value of your portfolio. So now your portfolio is worth only
$593,750, and your equity is now only $68,750. What should you do? Most people I
know will just stick to their guns and do nothing, hoping that the strategy will “recover”.
But that’s not what the Kelly criterion would prescribe. Kelly says, if you want to avoid
eventual bankruptcy (i.e. your equity going to zero or negative), you should immediately
further reduce the size of your portfolio to $429,688. Why? Because the recommended
leverage, 6.25, times your current equity, $68,750, is about $429,688.
Ok, I understood this part a little better.
Besides helping you to avoid bankruptcy, the Kelly criterion has another important
mathematically proven property: it is a “growth-optimal” strategy. I.e. if your goal is to
maximize your wealth (which equals your initial equity times the maximum growth rate
possible using your strategy), Kelly criterion is the way.
I like it. I like the way he writes.
Notice this goal is not the same as many hedge managers’ or their investors’ goal. They
often want to maximize their Sharpe ratio, not growth rate, for the reason that their
investors want to be able to redeem their shares at any time and be reasonably sure that
they will redeem at a profit. Kelly criterion is not for such investors. If you adopt the
Kelly criterion, there may be long periods of drawdown, highly volatile returns, low
Sharpe ratio, and so forth. The only thing that Kelly guarantees (to an exponentially high
degree of certainty), is that you will maximize the growth potential of your strategy in the
long run, and you will not be bankrupt in the interim because of the inevitable short-term
market fluctuations.
The more I read, the closer I get to figuring it out. Unfortunately, given my math ignorance at the moment (I will keep studying), I am only figuring it out in terms of rule-of-thumb empirical statistical excel methods (resampling, shortfall minimization) and I am not going to be able to sum it all up in one formula as I wish to do, until I'll have learned the language of these guys, and have achieved formula literacy, or math literacy. A concise mathematical recipe will therefore take me much longer than an approximate practical portfolio. And, along with a lack of clarify, comes a lack of univocality, with my empirical approach, and that I do not like at all.
 
Last edited:
simplifying portfolio theory

I am going to reason in simple terms on portfolio theory and why I need it. I may not grasp formulas, but still understand the underlying concepts.

In all I've been reading, I came across, repeatedly, these concepts:
variability, leverage, maximization of returns...

Let's draw it all.

Snap1.jpg

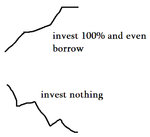
This is why we need portfolio theory, because we're not in one of the situations above. If a system made money all the time, you should reinvest everything, and even borrow money. If a system either lost money all the time, or lost money as a sum of its trades (like lotteries, too), then you shouldn't invest at all (I know that this is debatable, because if you're desperate otherwise, even playing the lottery makes sense).

And if instead a system makes money as a sum of its trades, but doesn't win all the time, we're in this situation, and we need portfolio theory (or more generally "risk and money management"):

Snap2.jpg

Having established this, that we need portfolio theory for systems that have zigzagging returns, the whole debate and portfolio theory is linked to the size of the zigs and the zags. Presumably the zigs (up) will either be bigger or more frequent than the zags (down).

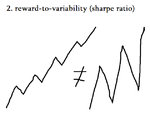
Since we can't have a system or a portfolio of systems that just has zigs after zigs, we will try to have one with small and rare zags. And this is the whole idea of measuring returns over variability.

I haven't shown much, but it's getting clearer in my head.

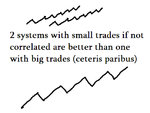
[...]

Snap3.jpg

The trades will offset each other. The profit will be the same, but the variability will decrease. Let's see if the sharpe ratio measures this correctly on excel.

[...]

Damn! It doesn't! I found another limit of the Sharpe Ratio (sheet 5):
View attachment study_on_sharpe_ratio.xls

I guess sharpe ratio is good, but profitability has to be measured separately. You can't count on sharpe ratio to tell you everything.

Hey, I am still very much in the dark, but I am starting to recognize some familiar shapes.

Let's try to represent graphically the ingredients of this recipe:

Profit
Snap4.jpg

Variability
Snap5.jpg

Drawdown
Snap7.jpg

Correlation
Snap8.jpg

For now I don't see any other ingredients. I will keep working on this obviously, since it's been my objective for the past 6 months.

What's clear to me now is that sharpe ratio doesn't even measure half of the ingredients that are needed to build a portfolio. The hell with all those telling me that all you need is to maximize the portfolio sharpe ratio. I am still swimming in the ocean of my ignorance, but not drowning anymore.

[...]

Recapitulating, we've got 4 ingredients of which only one is taken care by the sharpe ratio:
1) profit
2) average profit to average deviation (simplification of sharpe ratio concept)
3) drawdown
4) correlation

Correlation only matters for the portfolio... no, wait. I said correlation should be calculated relative to the underlying future.


Going from the Sharpe Ratio to the Travis Ratio

Therefore i've got all the ingredients capable of putting together a travis ratio, capable of telling me the best systems.

Let's start adding some measuring skills (ultimately all ingredients) to the sharpe ratio.

Average profit to average deviation (sharpe ratio) has two problems:
1) it doesn't count how many trades and therefore how much profit a system makes in a given period.
2) it doesn't care if the losses tend to come in groups (drawdown). But here I have to be careful, because the drawdown measured in the past, whether big or small, could simply be a random sequence of losses. The way I might go about this is to count the worst fall between the historical drawdown and the resampled one.

This is not going to be easy and it might even not be possible, but at least I am working on something I understand.

The correlation is easy, and I'll do it last.

What does the sharpe ratio have that the mere ratio of aveage yearly profit to average drawdown, or for example the profit factor (gross profit divided by the gross loss) doesn't have?

I have to fix the sharpe ratio, in terms of adding the drawdown and the absolute profit, and then i have to add the correlation to the underlying future as an extra measurement.

That's all I have to do. Then I'll know the best systems.

Later, I will find out the rest. If it's not possible, I'll go back to studying Chan and the others.

...

Whatever I do...

I need to find a way for trades to be the only thing to matter, so that a collective portfolio can be assessed as if it were an individual system. I am thinking of total profit over shortfall(s). But that may not work, because shortfall is measured not in absolute terms but in percent probability terms. Then I've also thought about profit factor, but a profit of 200 divided by a loss of 100 will rank the system just the same as a profit of 2000 over a loss of 1000 and those two systems are not the same, in many ways. First because we still do not know about the drawdown (how the losses took place) and secondly because, just like the sharpe ratio, profit factor doesn't tell us about the frequency of a system, and therefore how much money it makes.

I am going to keep reasoning on this, but I certainly would like to talk it over with a mathematician.

...

Ok, I am ready to take it a bit further.

Ingredients again:
1) average profit per year
2) average variability per year
3) correlation to underlying future
4) crossed out: margin needed NOT NECESSARY

I am deciding that margin is too complex and not useful enough to take into account. The losses will be very close to the margin, and they will count as capital required to trade a system. Also, the margins are close between the futures... all set: I only have to worry about those first three ingredients.

Correlation I can do later. I just have to slightly fix the sharpe ratio for it to measure total profit and average drawdown... but wait.

The quality is measured by the sharpe ratio, so I don't have to touch that: and the frequency of trading tells us the rest. Then the drawdown, unless it's peculiar to the system, will follow regular patterns, random patterns, and it's always worse with resampling, so I can leave that to... I can ignore that, because it's random.

I can ignore drawdown, and I can ignore margin as i said.

Now all that's left to worry about is frequency of trading and correlation to underlying future. I feel this is a great step ahead, towards simplification and improvement of the sharpe ratio. I know it doesn't sound modest, but markowitz and the other intellectuals didn't give a **** about me, when they came up with their formulas. So I can definitely improve it for my needs. Of course no one will listen to me, since I don't cite 30 academics for every post I write.

I will then need to go over the examples on this file, View attachment study_on_sharpe_ratio.xls, and verify that my new Travis Ratio satisfies all the problems the sharpe ratio had. Like Sharpe, I need to rename my ratio something else. Like "reward-to-variability..." rather than "travis ratio".
 
Last edited:
weekly update

Snap1.jpg

A thousand dollars behind the systems, thanks to my discretionary tampering. But if GBL falls and NG rises, as I think, I will catch up next week.

...

However, I have to add this. After those two weeks deeply in the red (those two straight red weeks, right in the middle), I am constantly afraid that next week will be an unprofitable one. And because of this, I tamper with the trades. I knew the red weeks were coming, but when they came, they scared me much more than I had anticipated. Now hopefully some money will come from those two discretionary trades, so I can relax and be ready to take any kind of losses.
 
Last edited:
profit factor better than sharpe ratio

I am telling you. The profit factor is better.

It's much simpler, so fewer things can go wrong. And it's totally correlated with sharpe ratio:

Snap1.jpg


What's the point of sharpe ratio? Fashionable. Like wearing a goddamn tie.

Ok, so. We have solved the sharpe ratio by dumping it.

Now we've a very simple profit factor. What we make over what we lose.

We're not caring about margin and assuming they're all close and that Profit Factor takes care of that. We're not caring about correlation even, because we're going to do this: if any two systems are too correlated (such as the same system trading ES and YM signals - currencies are borderline), they're not being traded at the same time.

But we still need a measure of how profitable a system is. For that we will use the Monthly Profit (we can't use absolute profit because the systems are trading over different periods sometimes).

Profit factor, much better and more clearly than sharpe ratio, tells us the accuracy of a system. But now we need the monthly profit to know how often the system shoots.

But before applying this change and multiplying PF by profit, I want to make sure I see all the implications of going from SR to PF. I need a lot of testing for this.

Also, I might want to preserve the assessment of systems' accuracy.

The point of this post is this: if we want to do things right, we have first of all to keep them simple. Sharpe Ratio does not go in that direction.

It does the same, but ten times as complicated, and this by itself is a deficiency, because when things get complex you lose control over the consequences, the reasoning, the implications... it's a problem in itself when something gets complicated - and it's that much worse when there's no reason for that happening, like in this case.

Profit factor is simpler and it does the same, so it's better.

Furthermore, now it may turn out that profit factor doesn't have all the deficiencies that sharpe ratio has.

...

But should i multiply PF by number of average monthly trades or by the average monthly profit? It should return the same value.

...

Yeah. I am momentarily lost. I guess it wasn't that easy to come up with something as good or better than the sharpe ratio. I am not giving up, but I have to reconsider the fact that i could do it overnight.

...

Ok, back to the drawing board.

I know the ingredients but I don't know how to mix them together. Yeah, sharpe ratio is overrated and yeah, profit factor is probably just... as good, maybe not, because... well, yeah it is. Because look, let's simplify it very much and knock off the bull****. Sharpe ratio is not using the average absolute devation, but it should have been, because it would have been simpler and clearer. It uses standard deviation, which no one exactly knows what the **** it means right off the bat. But sharpe ratio, let me simplify it, is the average profit over the average deviation - screw the risk free rate bull****, totally useless. As is totally useless the annualization of it, since it's the same for all systems, and that's what I am measuring it. And I am sure that it's so complex that if it is used as an industry standard, everyone will still bend it to his advantage. So ok, it measures average profit over average deviation. Profit factor measures total wins over total losses. Same thing. Just because "standard deviation" is called "standard" and not "average", it doesn't mean it's much different from it. It just gets calculated wrong and ten times more complicated. It's not like because the magic word "standard" is there, that the sharpe ratio is magic at detecting variability. It's just a goddamn average, like Profit Factor.

Let's forget about sharpe ratio altogether and learn to know Profit Factor, which is simpler and just as powerful. But it's still missing the other ingredients.

Let's pretend it's a recipe:

1) take profit factor, which tells you the accuracy of the system
2) add the profitability of the system, which you get by dividing... monthly profit by... margin (all right)

Multiply the two together, and you'll know how good that system is, on a scale that will enable you to compare all the systems together.

And this much can be all automated - no need to do it manually.

3) make sure you're not trading correlated systems among each other, and possibly not correlated with the underlying future

4) ...

Too complex already. I was hoping for a magic formula that would do it all for me, but no one gave it to me, or I am unable to understan chan's formulas. I think the latter. I am afraid so. I need those private lessons.

This can all be easier. Until then, I'll use my "shortfall" type of thing, empirical resampling, whereby I put together a basket of uncorrelated excellent systems and then I put their trades in the blender, and see what percentages I have to blow out by starting at a given capital, and so on. I don't like this, at all. I wanted to make it all self-contained.

But "just maximize the sharpe ratio" doesn't seem right to me. I've spotted too many things that the sharpe ratio isn't doing to just follow that advice. Besides, even those giving me that advice, wrote at least a 15 pages paper on that subject, out of which i only understand half of the pages. So I can't even simplistically say that any of these guys is wrong. I cannot do it before I become closer to what they are - academic bull****ters - and understand what they are saying. Only then will I be able to say it's all bull****. For now I only suspect it. If these guys had it so clear in their mind, instead of writing 1500 pages books, like Wilmott, why don't they take one page to make their formulas clear to me? If they wanted to enlighten humanity, why would they keep everything so complex? This smells fishy to me. I don't think they're out to screw me, but just that they're out to impress other academics. And maybe none of them trades. And maybe the "quants" get entrusted billions just because they know math and can unlock this world of bull****. All this knowledge is not there to be used in trading. Maybe it's just there to get permission from the others to rule the world. The knowledgeable know that this is all useless, but they don't let the secret out or they won't get all those awesome jobs.

God of randomness, let me make some money, a few thousands. So I can pay one of these mathematicians to enlighten me on these formulas.

...

Almost everything is clear to me. I know all the ingredients. I just do not know how to put them together. I can put them together empirically, and the recipe doesn't make you puke, but it could. I mean, it's not univocal, and it has killed my account in the past. That is why I'd like it, this time, to be univocal and scientific. But without a mathematician, and a good one, I cannot do this. There are no "portfolio theory for dummies" books.

I used to be certain of success, but lately, not too rarely, I wonder if I'll ever make this happen, from home. I don't have any other choice, because I am not a salesman. I can only make it happen from home. And I wonder if... i mean my systems are totally profitable, not that I am not ready, but I am so undercapitalized and feeling such strong urges to succeed, that it's precisely the reason why I am afraid it will not happen. An undercapitalized person with strong urges to succeed is the right person to blow out accounts. I should have thought of it before, a few dozen thousands dollars and years ago. I should have known better, that when I wasn't in a rush, then it was the best time to make this happen. But even then I was too much in a rush, and also too optimistic. There is only one edge that can allow you to succeed in a such a state of mind: being 100% right. And unfortunately my systems do not have that edge.

Maybe math is a good way to keep myself busy, in order not to blow out the account out of boredom. Maybe that's partly why I've been doing it.
 
Last edited:
Optimum Portfolio Weights for Maximum Sharpe Ratio: Excel - YouTube

Friendly Finance
I am a student of Finance. For bread and butter, I teach it as well.

Though the posts on this blog are specifically aimed at younger fellow learners but anyone interested in concepts and calculations in finance theory can benefit from them.

The aim of this blog is to provide non - technical write - ups as far as possible along with simplified demonstration videos that can aid faster understanding and assimilation for the mathematically and non - mathematically inclined people alike.
It sounds like he wrote it for me.

Youtube channel:
csbhatnagar's Channel - YouTube


Just as I am falling asleep, I found the one website that, unexpectedly, delivers the closest thing to what I desired: a pre-made simplified complete recipe for portfolio optimization.

I'll have to investigate this youtube channel in depth.
 
Last edited:
Top