expecting vs delivering
I was expecting this of my systems, when I enabled them six weeks ago: 1167 dollars per week (forward-tested average return).
How did they perform?
As expected, since whoever did best is not always who will do best in the future, they did not perform as well, in the last six weeks: 550 dollars per week.
Yeah, half as much. That is exactly in line with what we saw with the investors. Fascinating. Things change, people change, seasons change, moods change, but the numbers of statistics stay the same.
Paranoid Android (Radiohead) on violin & piano - Entropy Ensemble - YouTube
Of course I am still hoping that they'll do a little better in the future weeks, because I chose them very carefully this time (cfr. previous one thousand posts). Yeah, 'cause this time... I was
aware, and
méfiant.
Aware : Van Damme s'explique - YouTube
[...]
Sharpe ratio was 2.12 in backtesting. In forward-testing it was 2.67 (that's why/how i chose them). In the traded period the sharpe ratio was 1.98. I'd say it is acceptable, despite the fact that the profit was half as much.
Now I'll try to resample the trades, to see what risk exactly I am running of blowing out the account.
The trades were 61. I multiplied them by 1067, so I filled up all the 65k rows. Then I attached to each trade/row the usual excel rand() function and re-ordered them accordingly, thereby resampling them.
Now I will get a correct estimate of how likely I am to blow out, if things keep going as they've been going in
real trading (which is more reliable than back-testing, and also more reliable than forward-testing).
I have fallen in love with this resampling methodology I invented, after studying some probability. I don't even remember how I came up with it - i wrote some posts about it.
[...]
Ok, done.
This is really when I can say something with confidence about my systems. Because it's not just the back-testing, not just the out-of-sample test of the back-testing, not just the forward-testing, but it is the real trading. I can at least expect them to behave in the future as they have behaved in real trading - that much I can expect, at least for the short term (that is to say that I am not expecting the same kind of performance three years from now).
And here's the results.
In back-testing things were like this:
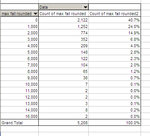
97.6% chance of survival with the present level of capital (roughly 9500 dollars).
In back-testing resampled it was like this, a bit worse:
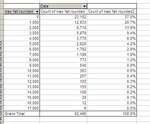
96.1% chance of survival. Pretty close to the regular back-testing.
In forward-testing of course it was better, because I chose the systems I chose, precisely because of their performance. But this is forward-testing
resampled so it's a bit worse:
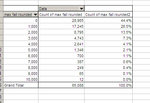
99.5% chance of survival. But this, despite being forward-tested is the trickiest one, because I chose the systems that worked best, so of course their performance is excellent - or else I would not have chosen them.
And finally, here's what really counts - the six weeks of real trades (a total of 61 trades) resampled:
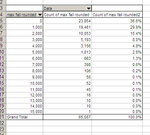
Damn! 99.5% chance of survival again. And there's no error. This reminds me a lot of the normal distribution, the way my drawdowns are distributed.
Anyway, despite the fact that the money made was less than what forward-tested would have made me expect, the losses were just as small as in the forward-tested period. I mean, combined together, my chance was the same. And this is quite likely to stand the test of time.
While I am at it, I will calculate the normal distribution thing... just to refresh my memory on what I've studied.
Ok, let me think... mumble mumble... what do I do first. I calculate the standard deviation of all the drawdowns. That's going to take a while.
Moron! I don't have to do it manually. Excel has a function. I will use stdevp(). It makes no difference anyway, on 65 thousand cases.
Ok, the rule was that 68% of cases should be within 1 standard deviation. 95% within 2, 99.7% within 3. Did I remember right?
68-95-99.7 rule - Wikipedia, the free encyclopedia

Ok, let's see on my excel file:
View attachment resampling_trades_so_far_20120112-20120224.zip
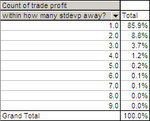
(
table replaced later, once I noticed the mistake I had made, on not using the average of the population to calculate standard deviation)
Damn! If I count the drawdowns I should also count the drawups because we're really counting where it goes before returning to zero. I can't quite get it, but here we're only measuring falls and not rises and this might be what's interfering with calculating the right standard deviation and right distribution. However, if we're seeing zeros instead of positive values, then we can always verify the standard distribution by looking at the other side, which can also be done with the z-scores table:
Z Scores Table
Ok, so basically what shows as 67.4% is not, as it would appear, very close to the normal 68% (all cases within one standard deviation), because it also includes all the cases of "drawups" (as opposed to "drawdown"), which, according to the normal distribution should amount to 68% plus half of the remaining 32%, for a total of 84%. So here the distribution does not seem perfectly
normal.
Damn! What a moron... I can't calculate the normal distribution, because it's based on the standard deviation, but that cannot be computed properly unless I have the drawups values.
No, wait. Wait.
Here I am only after the max fall (biggest drawdown after the entry on a given trade) and so this definitely can be calculated as simply the fall, and if the fall is zero because instead of falling (like in most cases, since the systems are profitable) it will rise, then it can be calculated normally.
But then my question is the values... ok the standard deviation which is close to the average absolute deviation (clearer concept to me) is 1500 dollars. So my question is why do we not have a negative one? I mean, all the values are positive, because i made the falls positive values (but there were no positive values to turn into negative). I mean everything seems correct, but in the bell shape aren't we supposed to have a negative half?
This would happen with trades for example (cfr.
recent post on st.dev. and trades from my systems), but why doesn't it happen here?
Is it ok to do it without it? It seems to me that it's ok. Because we have the standard deviation of 1500, but what seems wrong is that you don't have negative values and so... but wait this is like those examples for ages at the zoo, that khan was doing on his web site:
Empirical rule | Khan Academy
The lifespans of anteaters in a particular zoo are normally distributed. The average anteater lives 16.5 years; the standard deviation is 3.9 years.
Estimate the probability of an anteater living longer than 20.4 years.
Ok, this is great, because if the anteater cannot live negative years, then... it's ok for my drawdowns to not have any negative values. But wait. I was seeing that 16.5 minus 3.9 leaves room for more than 4 negative standard deviations, but it doesn't have to be symmetrical because there's four on the left but there's several more on the right, since an anteater could live 80 years, but not less than zero.
Ok, so it should be ok for my drawdowns to be just deviation below and... oh ****. I forgot to calculate the mean! That's what I was missing. "The average anteater lives"... reminded me of it. I was just assuming that the average drawdown corresponded to 1 standard deviation.
I think i might have made the same mistake on that previous post i mentioned, too.
Anyway, I just went and replaced both the zipped excel file and the table snapshot. I think now it's correct. Whatever it turns out to be, whether wrong or right, there is only a slight resemblance to normal distribution, because a lot more of the population is within 1 standard distribution, and it is heavily skewed right, due to the fact that there are no negative drawdowns (of course they're all negative money, losses, but i turned them into all positive, for practical purposes - at any rate it would have been skewed left otherwise).
This is just like for trades (despite my approximations and even mistakes), as there is a great bulk of trades and drawdowns in the neighbourhood of zero, which crams within one standard deviation almost 20% more than what it should have.
---
The very good thing I did in this post though, is finding out how good my present systems are and how likely they are to blow out.
I am so exhausted in general that I don't know if I'll be able to retain anything else of what i've done here. I am totally burned out. I really need to take seriously this idea of relaxing. It has to happen now before it's too late.


