If You Can Draw A Straight Line (You Can Become A Successful Trader)

Status
Not open for further replies.
What do you mean by "time and price units"?

Talking about the angle of, say, a roof makes sense because both the horizontal and vertical units are the same, i.e. spatial, units of distance. If I state my roof is 45 degrees, then this is meaningful to anyone without further context.

But if I say the trend on my chart is 45 degrees, what does that mean?

I'd also need to state something like 1 price point spans an equal number of pixels as 1 time interval.

IMO, angles in terms of degrees should never be used when discussing price charts. It makes sense to talk about relative gradients, but not literal angles.

A 1:1 chart is a square. A chart that is 1.5:1 is one-and-a-half times as wide as it is high.

Again, if one is trading the SLA, the aspect ratio isn't as important unless the chart is so squished that the priceline is practically flat.

In any case, as I explained, the angle itself isn't as important as the number of shares being traded at each price point on the way up.
 
Does this help? -
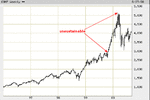
With computer-generated charts, the displayed height of the y-axis is generated in relation to the max and min values of the instrument in the time period covered. So the gradient of sloping lines between value points also vary. What looks like a parabolic break-out into a bull phase might turn out to be a tiny 10 pip spike compared to other instruments' charts.

e.g. EUR/AUD and USD/CAD, close to close, last 6 months.
EUR/AUD, steady upwards slope across about 1 third of chart
USD/CAD, almost identical slope and also visually covers about 1 third of chart, maybe a bit more

But
EUR/AUD performance last 6mths +9.34%
USD/CAD +5.41%
 
Does this help? -
With computer-generated charts, the displayed height of the y-axis is generated in relation to the max and min values of the instrument in the time period covered. So the gradient of sloping lines between value points also vary. What looks like a parabolic break-out into a bull phase might turn out to be a tiny 10 pip spike compared to other instruments' charts.

If this is addressed to me, I guess it depends on the software. Most programs allow the trader to create whatever aspect ratio he chooses. But the ratio doesn't change according to the bar interval. A tick chart has the same ratio as a weekly chart.

But, as I said earlier, none of this is pertinent if one is trading the SLA. What matters is whether the line is broken or not. I monitor the angles myself on weekly charts, but the angles themselves are not addressed in the SLA, except to note that the more parabolic a move, the more likely it is to fail, and sooner rather than later. I brought up the aspect ratios only to point out that rather than go through a lot of calculations or use indicators of one sort or another, all one has to do is look at it. If the aspect ratio that one uses tends toward the 2-to-1 or even more, the trader can easily be lulled into thinking he has a nice, gradual, sustainable course when he may actually be in trouble.
 
Last edited:
If I remember correctly, it was Gann who used arbitrary squares for his calculations. I'm not going down that road, though, in these days of online charts. It's far too slow and, besides, as I see it, it is telling the market what to do. Frankly, I don-t believe in it,
 
If I remember correctly, it was Gann who used arbitrary squares for his calculations. I'm not going down that road, though, in these days of online charts. It's far too slow and, besides, as I see it, it is telling the market what to do. Frankly, I don-t believe in it,

Neither do I, at least in terms of the geometry. And I'm not trying to start anything. I'm only trying to point out that the faster an ascent, the shakier it is. Wyckoff discussed pace, activity, and extent. Those characteristics considered together will tell the trader whether he's got a healthy advance or an unhealthy one. The 45-degree angle is just a quick (a couple of seconds) way of gauging the health of an advance.
 
45 degree angle..... health of an advance......

A step too far I think.

I know what you mean but ......... as a trend trader I've found that after a while you get to look at your chosen market & can recognise what is a "good" angle – not necessarily 45° – but it just looks right (or wrong). I've found this useful across different time frames. For me, it's just an instinctive gut feeling – but I suspect it's based on looking at loads of charts: a little bit more difficult with candles but no problem with line.
 
attachment.php
 

Attachments

  • Image38.gif
    Image38.gif
    10.6 KB · Views: 1,354
Hi db, I watched a hinge form this morning and was wondering in real time whether or not it represented a good trade opportunity. The idea was to enter at just before 11:00 at 4320 or so. On the positive side, it was a break out of a hinge. On the negative, there were several possible resistance levels formed over the previous 24 hours between 4327 and 4333, plus the broken long term support level going back to April of around 4335, any of which could have taken the wind out of this trade. On balance, I don’t think it was a worthwhile opportunity -- even though in retrospect an entry at around 20 and an exit at 30 (per SLA) would have meant a decent gain. Thanks.
 

Attachments

  • 10-28 copy.jpg
    10-28 copy.jpg
    181.9 KB · Views: 212
  • 10-28.jpg
    10-28.jpg
    188.7 KB · Views: 211
Hi db, I watched a hinge form this morning and was wondering in real time whether or not it represented a good trade opportunity. The idea was to enter at just before 11:00 at 4320 or so. On the positive side, it was a break out of a hinge. On the negative, there were several possible resistance levels formed over the previous 24 hours between 4327 and 4333, plus the broken long term support level going back to April of around 4335, any of which could have taken the wind out of this trade. On balance, I don’t think it was a worthwhile opportunity -- even though in retrospect an entry at around 20 and an exit at 30 (per SLA) would have meant a decent gain. Thanks.

Real time is not the time to be wondering whether or not something is a good trading opportunity. However, the wondering is the beginning of the process whereby one -- via the scientific method -- finds and develops what may become trading opportunities into the components of a robust trading plan.

Hinges are unpredictable, and there are several ways of playing them, including not playing them at all. They are included for two reasons: (1) they illustrate the criteria for chop in such a way that one can recognize these markers in real time and avoid getting sucked into dangerous situations and (2) they illustrate the "price discovery" process, also referred to as the search for equilibrium, or balance, or "fair value" (though neither the buyer nor the seller may think that the price is particularly fair, just the best they can do in order to seal the deal). Other forms of congestion, such as rectangles or "boxes", illustrate this as well, but the hinge has a deadline: the apex. This gives the hinge a different character than that of something more rangey, which can go on for months (like the April to August range we just left in the ES and NQ).

Therefore, I suggest that the beginner not play them at all but rather know what they are so that they can be recognized in real time and avoided. Yes, the moves out of hinges can be spectacular, and they can inspire regret for not having taken advantage of them. In hindsight. But one can't trade hindsight. There are other fish to fry while one gains confidence in his trading. Eventually, if one decides to explore the possibilities which hinges offer, I suggest he take the following to heart:
What was the last thing you traded? Look at its 1 year, 6 month, 1 month, and 3-5 day charts. Can you see all the opportunities where you could have made a profit? Should have gone long there, shorted here . . .. You're assessing "opportunity" based on price activity subsequent to the point at which you believe the opportunity existed, which means that you're working backward to identify that point of opportunity. This type of thinking will cause a trader to make trades when no real opportunity exists.

Looking at the charts again, try to identify forward-looking opportunities, where you consider only each price point and the price patterns before it. You'll find that it's now far more difficult to spot the winners, but those are the opportunities that you need to identify and then appropriately act on in order to be a successful trader.

-- Innerworth

Thanks for that, db. Just to clarify on the first point about decision making... once you have prepared for the trading day by reviewing your charts (weekly, daily, hourly, etc.) and noting the significant levels of support and resistance which may come into play, you don’t go “looking for trades”. You approach the trading session with an expectation of what might happen at a certain levels, junctures, apexes, etc., and in real time decide simply whether to go long, short or do nothing. In the beginner’s case, your recommendation when seeing a hinge or a range form, is to notice it as chop/price discovery but take no action.

I find that last point confusing. My impression, per Wyckoff (I’m slogging through it), the SLA, your article on springboards, and various other posts you’ve written, was that breakouts from hinges and ranges were a fundamental part of a trading plan (first tested, then traded). If one is looking for basic trade opportunities (e.g., breakouts), hinges and ranges seem like a good place to look, no?

You mentioned other fish to fry suggesting there are more fundamental things for the beginner than trading hinges. I probably should have mentioned that I create trendline charts at night and before the open (establishing “context”), then sim trade for a couple of hours before work, as part of developing my plan. All the above is done with some awareness of the continuity of price, the ebb and flow of markets, and price movement being a movie not a slideshow. In terms of divorcing the ego from a trade or anything else, that’s something I’ve worked on for many years in all aspects of my life through meditation -- and why I relate to your fish bowl analogy for watching price.

Where is the Innerworth quote from, btw? Interesting. I do understand the difference between seeing opportunities in retrospect and real time (I read a post of yours on the topic not long ago). My goal yesterday was to find a “forward-looking” opportunity as the hinge was developing, based on levels of possible resistance I had identified hours earlier.

Thanks again for sharing your approach in such detail. 🙂
 
Thanks for that, db. Just to clarify on the first point about decision making... once you have prepared for the trading day by reviewing your charts (weekly, daily, hourly, etc.) and noting the significant levels of support and resistance which may come into play, you don’t go “looking for trades”. You approach the trading session with an expectation of what might happen at a certain levels, junctures, apexes, etc., and in real time decide simply whether to go long, short or do nothing. In the beginner’s case, your recommendation when seeing a hinge or a range form, is to notice it as chop/price discovery but take no action.

Yes. As written in the rules and in the crib notes, I look for a range, if price is in one. If not, I assess the trend, as it is either one or the other. I don't plot S&R other than to note the upper and lower limits of the range, if price is ranging. If it's trending, I trade the SLA. Anticipating a reversal off of what may be imagined support or resistance doesn't test out given that price can just as easily break through what most would consider to be S or R as not.

Friday, for example, the NQ had been in a range from 0100 to 0400, then dropped to 4284 or so and formed another range from 0430 to 0930, which is what I used to trade the open. After that, it was the SLA until we entered chop.


I find that last point confusing. My impression, per Wyckoff (I’m slogging through it), the SLA, your article on springboards, and various other posts you’ve written, was that breakouts from hinges and ranges were a fundamental part of a trading plan (first tested, then traded). If one is looking for basic trade opportunities (e.g., breakouts), hinges and ranges seem like a good place to look, no?

Ranges, yes. Hinges, not necessarily.

The SLA/AMT is a reset. After years of arguing about what's Wyckoff and what's VSA and what's Evans and what's SMI and trying to sort it all out, I finally two years ago started from scratch. If traders want to break through ice and jump creeks, they are welcome to do so, but that no longer has anything to do with me. Rather than spend/waste seemingly endless amounts of time arguing about what is or is not Wyckoff, I can ask that those who are interested in all this focus on the SLA and implementing the SLA. As the SLA is about as simple as it gets with regard to trading price and as the entire thing is one-fifth the length of Wyckoff's course (100p vs 500p) and the condensed version posted to the first post is one-fifth of that (20p), and as one can approach it without testing and with minimal journaling, the primary task for the intended becomes extinguishing bad habits and learning new ones, rather than slogging through hundreds of pages and thousands of posts. The SLA is based on and stems from Wyckoff, but one can study it and practice it and trade it without ever having heard of Wyckoff or having read a single word of his course.

Rather than draw a bunch of lines, then, the beginner is tasked with determining whether price is trending or ranging. If he doesn't know, then there's nothing for him to do but observe. Eventually, once he's able to tell, he still has only two choices: trade the exit from the range or look for either a reversal in the trend or a continuation opportunity, which is where retracements and hinges come in.


You mentioned other fish to fry suggesting there are more fundamental things for the beginner than trading hinges. I probably should have mentioned that I create trendline charts at night and before the open (establishing “context”), then sim trade for a couple of hours before work, as part of developing my plan. All the above is done with some awareness of the continuity of price, the ebb and flow of markets, and price movement being a movie not a slideshow. In terms of divorcing the ego from a trade or anything else, that’s something I’ve worked on for many years in all aspects of my life through meditation -- and why I relate to your fish bowl analogy for watching price.

It's up to the trader to decide for himself when he's ready to trade hinges. If he thinks he is, he'll find out quickly enough whether his self-appraisal is realistic or not. Given that hinges are so common, they are the subject of the first appendix, and three examples of common hinge behavior are provided. However, the trader will soon learn that there are as many variations of hinge behavior as there are variations of trader behavior, and he can then decide whether to pursue whatever trading opportunities hinges provide or say the hell with it and wait for something that enables the trader to formulate more specific and reliable trading criteria.

Where is the Innerworth quote from, btw? Interesting. I do understand the difference between seeing opportunities in retrospect and real time (I read a post of yours on the topic not long ago). My goal yesterday was to find a “forward-looking” opportunity as the hinge was developing, based on levels of possible resistance I had identified hours earlier.

Innerworth folded in '09.

Thanks again for sharing your approach in such detail. 🙂

You're welcome. Thanks for the interest.
 
Ah, I didn't realize that ranges and hinges trade so differently. Appreciate the explanations and description of how you approached Friday.
 
Trending and ranging require different tactics to be successful. What works in one isn't optimal for the other. If the range is wide enough then it's a different matter. Keep in mind though that each trend is within another range, a bigger range generally speaking.

Gringo
 
Trending and ranging require different tactics to be successful. What works in one isn't optimal for the other. If the range is wide enough then it's a different matter. Keep in mind though that each trend is within another range, a bigger range generally speaking.

Gringo

yep
 
Chart review for this morning.


attachment.php


Beginning with the chart above, the LOLR is hypothetically down (by "hypothetically" I mean that the hypothesis is . . . ).


Looking at the pre-market situation, there are two ranges, the hourly and the 15m (this does not mean that the market is "fractal"; it's just a plain ol' zoom). One can also see that the median of the hourly range is the same as the upper limit of the 15m range. Inside the 15m range, there is an uptrend on the 5m. Therefore, depending on when one begins his trading session, he has a choice among two ranges and an uptrend.


attachment.php


Combining all of these, one can use the trigger off the 5m and enter on the 1m, anywhere below 4302.75.

Next potential op occurs when price reaches and breaks through the upper limit of the 15m range, which is also the median of the hourly range.


attachment.php


Price makes a lower high on the 1m after failing to break through the upper limit of the 15m range. Entry can be made anywhere below 10.75.


attachment.php
 

Attachments

  • 0828.gif
    0828.gif
    22.5 KB · Views: 1,692
  • 0831a.gif
    0831a.gif
    134.2 KB · Views: 1,740
  • 0831b.gif
    0831b.gif
    106.9 KB · Views: 1,791
  • 0831c.gif
    0831c.gif
    143 KB · Views: 1,742
Db, thanks for starting this thread and posting the new PDF of the SLA method. I've been following your method for a couple of months, I stumbled across the thread "Price, (Volume), Support, Resistance, Demand, Supply . . ." and first downloaded the SLA from the link you posted on the final page.

I imagine I fall into the category of new trader as I haven't had my fingers burned by losing money on the markets yet. I am attracted to the SLA and AMT because of the focus on price and how and why it moves, i.e. Interactions between market participants, traders seeking value etc. I'm onboard with your method and intend to make it work for me. I've started my trading plan using the guideline posted by timsk but will give your PDFs a scan to see if there's anything there I want to consider.

As for the SLA and this thread I have a few questions I would appreciate you answering for me.
1. In post 31 of the thread you said you have nothing to offer spread-bettors and forex traders, please can you explain why. I know the difference between a normal brokerage account and a SB account. Is a SB account unsuitable for the SLA?
2. You also advise against trading FOREX and futures with this method and refer to mean reverting. Please can you explain what mean reverting is. Do you mean when price returns to the median of a range from the extremes?
3. With regards to timeframe, I work full time and cannot monitor the charts all day. Is it feasible to trade SLA using 1h or 30 min charts as a beginner? 1h is preferable but 30 mins might be doable. I doubt I can monitor 15/5/1 min charts.
4. When a trend line is broken, how do I decide whether to take a trade on what I think is a retracement or to wait and see if a HH/LL is made and fan the supply/demand line accordingly?
5. What is a qualifying HH/LL for fanning a trend line? Does it have to be higher than the HH prior to the break in the demand line? Or simply level with the demand line itself? Or higher than the low after the trend line is broken?
6. Do I fan trend lines on the hourly chart I will be trading or only the weekly and daily charts?

I apologise if my questions seem basic or obvious. As I spend more time doing this and keep up with the thread I hope to post more meaningful content and ask better questions. I appreciate your patience.

Mateus
 
Db, thanks for starting this thread and posting the new PDF of the SLA method. I've been following your method for a couple of months, I stumbled across the thread "Price, (Volume), Support, Resistance, Demand, Supply . . ." and first downloaded the SLA from the link you posted on the final page.

I imagine I fall into the category of new trader as I haven't had my fingers burned by losing money on the markets yet. I am attracted to the SLA and AMT because of the focus on price and how and why it moves, i.e. Interactions between market participants, traders seeking value etc. I'm onboard with your method and intend to make it work for me. I've started my trading plan using the guideline posted by timsk but will give your PDFs a scan to see if there's anything there I want to consider.

As for the SLA and this thread I have a few questions I would appreciate you answering for me.
1. In post 31 of the thread you said you have nothing to offer spread-bettors and forex traders, please can you explain why. I know the difference between a normal brokerage account and a SB account. Is a SB account unsuitable for the SLA?

I really have no idea. What I said was that "I" have nothing to offer SBs and FXs as I don't trade either one and have nothing to offer beyond the basics detailed in the SLA. But as long as the particular market is an auction market, the SLA and AMT will apply.

2. You also advise against trading FOREX and futures with this method and refer to mean reverting. Please can you explain what mean reverting is. Do you mean when price returns to the median of a range from the extremes?

This particularly is explained on pp 15-19 in the pdf uploaded to post #1 (or click my signature). If you have specific questions about what's written, I'll do my best to explain.

3. With regards to timeframe, I work full time and cannot monitor the charts all day. Is it feasible to trade SLA using 1h or 30 min charts as a beginner? 1h is preferable but 30 mins might be doable. I doubt I can monitor 15/5/1 min charts.

The SLA and AMT are applicable to all bar intervals, from tick to yearly. Practically, one must choose an interval that he can actually watch. Since so few "daytraders" are actually trading given the extraneous demands on their attention, anything less than a 60m interval isn't reasonable, which is why I used the 60m interval for the examples posted in the abovementioned pdf.

4. When a trend line is broken, how do I decide whether to take a trade on what I think is a retracement or to wait and see if a HH/LL is made and fan the supply/demand line accordingly?

This is explained in detail in the book. However, put simply, one can figure this out for himself by observing retracements and collecting data on which become continuations and which fail and become reversals. The chief question to be answered is what determines which outcome, what determines which fork in the road price will choose?

If one is following the SLA at the primer level, there's nothing to think about. If price breaks the line, exit. Once out, wait for a retracement. When that occurs, take it. If it isn't confirmed, exit. If it turns out to be a reversal, then wait for a retracement on the other side. If that doesn't work out either, stop. You're in chop.

If one is beyond the primer level, then one must engage in the abovementioned data collection, e.g., once price has broken the line, how far can it retreat and still stage a continuation? At what point does the retracement become too deep and a reversal gain higher probability? This will of course vary according to the instrument traded.


5. What is a qualifying HH/LL for fanning a trend line? Does it have to be higher than the HH prior to the break in the demand line? Or simply level with the demand line itself? Or higher than the low after the trend line is broken?

If price stops making higher highs, then there has been a change in trend. This change may be no more than a temporary sideways movement, but it's a change nonetheless. If this sideways movement breaks the line and one is at the primer level, exit. Otherwise, wait and see whether it continues to move sideways or it begins to fall.

6. Do I fan trend lines on the hourly chart I will be trading or only the weekly and daily charts?

The SLA/AMT applies to all intervals, though there may be a trend in one interval and a consolidation in another. As I attempted to illustrate in my last post, the context will play the primary role in whether or not the trade succeeds.

I apologise if my questions seem basic or obvious. As I spend more time doing this and keep up with the thread I hope to post more meaningful content and ask better questions. I appreciate your patience.

Mateus

The chief purpose of the SLA/AMT is to enable the beginner and the "damaged trader" to gain -- or regain -- confidence in their trades. This is accomplished by providing structure, by limiting losses, and by providing a mechanism whereby profits can be allowed to run. Once the trader begins to understand that he is in fact in control of managing his trades, including their resolutions, he can then move on to the nuances. But neither a beginner or a failing/failed trader should concern himself with nuance. It's enough to be able to prepare for, execute, and exit a trade without becoming paralyzed by terror (see the article I posted on Fear).
 
Hi Db, a couple of questions if you don’t mind...

Was the LOLR also down this morning (Tuesday pre-open), though with less certainty than yesterday? Are these valid reasons to expect a down day: 1) reversion to the mean of the last SL to SH (50% line); 2) 4330 has flipped from support to resistance and price is bouncing off it; 3) a new range is tentatively forming between 3905 - 4330. (Seems like all three reasons are aspects of the same general idea -- reversion to mean in a range.)

“As I attempted to illustrate in my last post, the context will play the primary role in whether or not the trade succeeds.”

“Combining all of these...”


Does the above mean that when the LOLR is down we’re interested in shorts primarily? or exclusively? As I understand the SLA, if the market is trending up on a down day and a long opportunity presents itself, one would take it regardless. If so, is it a matter of shorts being the more likely to succeed on LOLR down days? Or of leaning toward opportunities where the charts are in alignment and pointing in the same direction?

Thank you! Your replies are very helpful.
 

Attachments

  • lolr.jpg
    lolr.jpg
    285.2 KB · Views: 214
Status
Not open for further replies.
Back
Top