Straight Line Approach, The (the SLA)

Status
Not open for further replies.
I thought I would post some thoughts on days that I have been watching the market unfold from an intraday point of view. I was on holiday on this first one and my tablet is only capable of so much.

18th March:

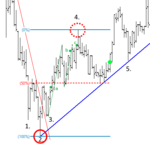
1. 2nd 3rd PB in this sharp/climactic drop, nothing particularly unusual with this.

2. Price pokes lower and just as quick backs up making a deep ret to the previous swing high, its interesting but checking in on the higher time frames there was nothing obvious about this level that would stop a drop.

3. Now we have a higher low, whilst I have drawn in a fanned DL I was more focused on the behaviour, did not do anything as I was watching and eating.

4. Price rets back 50% of the Hi-Lo and fails which would suggest continued weakness, any DL drawn off the low would be snapped shortly after.

I was overly focused on the standout swing low on the rally to think of a short as it was around the 50% Lo-Hi.

5. Price has moved sideways breaking any spandex tight SL's that might be in place and it is doing so just above the MP of the Lo-Hi.

A long is triggered as price pushes higher.

6. After making a HH price drops off into a deep ret back towards entry, as I enter the trade I accept that my DP can be hit so I am not so worried in taking a loss, second, as price has made a HH I can give it a little space to make a HL which is the basis of an upmove, third, I have a DL that I can work with and can exit on a break of that should it occur.

We get a series of HH and HL before price really takes off with a ret around the opening high.

7. There is a ret followed by a 2 point continuation before price drops off again, this high was right in with earlier rejection on the hourly chart, again as earlier, focus was on behaviour, the weak continuation and drop off was enough for me to exit on a LH on a LTF setting (30 sec TF)

Overall, late entry into an area that might cause a little chop (MP of Hi-Lo) had to grit my teeth a little before it went, exit was a little tight and only "good" as one knows what happened next.
 

Attachments

  • nq180320161min.png
    nq180320161min.png
    30.1 KB · Views: 321
Last edited:
I thought I would post some thoughts on days that I have been watching the market unfold from an intraday point of view....

Kleft, thanks for posting this. I’ve added a few other possible long entries to your chart and was wondering if you could explain why you didn’t take them.

I think you passed on the first opportunity (a) because you were preoccupied watching price and saw no compelling reason for a reversal based on the hourly.

It sounds like you passed on the second (b) because you were felt the retrace was too steep, i.e., more than 50% of the previous swing low to high (my first green line).

I take it the reason was the same for the third, (c) -- a retrace of more than 50% of the previous swing low to high (my second green line).

Here then is what I don’t understand… On the entry you did take, the retrace seems to be bigger proportionally than the previous two retraces -- even if you use, as you seem to have, a line drawn between 2 and 4 (which encompasses several swing highs and lows) as the basis for measuring the retrace. Or maybe you simply took it on the basis of a double/triple bottom along your dotted red line?
 

Attachments

  • nq180320161min 2.png
    nq180320161min 2.png
    16.6 KB · Views: 287
Here then is what I don’t understand… On the entry you did take, the retrace seems to be bigger proportionally than the previous two retraces -- even if you use, as you seem to have, a line drawn between 2 and 4 (which encompasses several swing highs and lows) as the basis for measuring the retrace. Or maybe you simply took it on the basis of a double/triple bottom along your dotted red line?


Point A is the ideal entry but it was early evening for me and my head was in the trough (greasy paws and touch screens don't mix so well), Whilst there was nothing compelling as such on the HTF the behaviour itself stuck out.

Price had dropped 30 points, then it pokes and fails to go lower (dog) then it puts in a HL (traders seem unwilling at this time to go lower) the HL comes after a stride break so its a valid long, there is a second ret a couple of bars later which could also be taken depending on what one considers a ret.

The problem at B and C is that price is roughly 6 ticks shy of the MP of the opening high and low at 2 and price is more likely to chop and backfill and its far from the ideal entry at A. By the time we see price at C it is already showing a little hesitation.

The pull back from the high at 4 is deep in relation to the earlier swing low and the overall move up, but, price goes sideways in a tight range at the MP, if that level can hold it could suggest strength. Also, if an SL was drawn from the high at 4 the sideways movement would have broken it (I don't always use lines).

To use fewer words, price seemed unable to move lower than the swing low and MP, either we range or rally, as price started to peel off the MP I looked at a long with a short leash, once it put in a new high I sat back on DP or stride break and waited to see if it would lead to a HL.

It was a very late entry on a much later pull back that exhibited signs of strength, 5 minute chart cuts through all the chop and paints a clearer picture, but, at the time it was not my primary focus.

30sec chart to show what I was looking at, I'm terrible at putting my thoughts into words so if it doesn't answer your question say so and I'll try and explain it better.
 

Attachments

  • nq1803201630s.png
    nq1803201630s.png
    34.6 KB · Views: 240
Last edited:
I believe DB discussed some of the aspects ongoing for the 21st, this is what I saw, still learning.

I missed the opening action and will start from the drop.

1. Same deal as the earlier post, climactic drop into a ret, a test/poke lower followed by a ret deep enough to take out the previous swing high and SL followed by a higher low.

2. Price rallies a few points before stalling, I started having misgivings when price starts moving sideways and failing to get above 98.75 for a third time. Price drops off and I exit on stride break +.

Line is fanned to take in new low, but, price rejects the test of the low at 1 and rallies breaking stride. (RET at A is too close to the high at 2 where the 10 point drop originated, same reason for drop might still be in play/or range establishing)

3. Price fails on a push higher and drops off, (if one is scalping there is a DL break and ret in there) as price was dropping I was still looking at this as a ret after a SL break, but as price picked up pace and dropped further it looked more like a double bottom.

4. Price stops a tick shy of the swing low and as it starts to bounce a long is triggered (if I was sharper or on a LTF I could have picked it up a little faster) I was watching volume but it was not a deciding factor at the time.

Despite taking a little backfill price was rejecting a move lower so one could sit back on the DP and see what happens.

5. Price rallies into the little range price made prior to the drop (also in amongst the hourly highs), there is a weak continuation followed by a deep ret. I bailed out at this point which I felt was a little early (maybe 2 points).

I chewed over my exit for a bit and watched price move sideways, I decided to wait for more decisive action prior to getting involved again.

6. It gets a little messy now, traders head lower and a short could be taken, price then backs up. A scratch is justifiable as price is not doing what one would expect it to do, but at the same time it has not done enough to be deemed a failure, we eventually drift lower.

7. We move a little lower than the MP and price takes a kick, price reached an area were trouble is likely and makes a ret that is bigger than those before it, for me it was time to stand aside.
 

Attachments

  • nq210320161min.png
    nq210320161min.png
    59.3 KB · Views: 328
For a beginner, the only trade of any value is the 1003 short. After that comes the 1019 long, which should be exited higher. The 1027 short would not be taken as the trader would still be long, and it's not likely a beginner would have the presence of mind, much less the reflexes, to stop-and-reverse.

Technically, one could draw a banana-peel SL from the 1028 bar. If the beginner took the time to understand wave structure, there'd be no reason not to. If he did, he'd have a long entry at 1035, followed by a short entry at 1041. If he missed it, there's another short entry at 1043. The long after that is at 1051, and this would be a loser. There would then be a short at 1059, which would also be a loser. He would therefore stop until price exits the range (if he didn't notice the hinge), which it does not do until 1115, but this is of course after 1100 anyway. The big 14pt long is not therefore taken, but it's not likely that a beginner would take it anyway. But I wouldn't take it either. I hate this kind of directionless trading. If we're not trending, I'd rather do something else with my time and wait until the next day. In hindsight, I could say that I'd try that RET at 1105 after price leaves the hinge (not drawn), but I probably wouldn't as I would have stopped by then, and I wouldn't expect a beginner to see the hinge anyway (though his two consecutive losses should alert him to the fact that he's in chop and prompt him to at least look for the hinge). If one took it, he'd be in at 96.5 or 97. Whether or not the subsequent 10pts would be worth the hassle is up to the trader. It will by that time have been a long morning.

Db

Edit: BTW, if one is keeping score, this makes 7 trades, not counting the exit from the hinge, two of which are losers, for a 71% winrate. If one counts the exit from the hinge, that's 6 winners out of 8 trades for a 75% winrate. Even on a day like this.
 
Last edited:
I'm not to sure about the location and of course the short could have been initiated four bars earlier, but according to the SLA this in my eyes is a clear short.

Could the inability to reach the midpoint at around 11 be seen as a "clue" in terms of potential weakness?

uso_short.jpg
 
Last edited:
Don't complicate it. Short the first RET after the break of the DL. The short should have been taken this morning.

I suggest that you get rid of the color-coded volume.

Db
 
The short was taken accordingly.

We'll see what happens.

In terms of USO, I did not find anything better to trade oil this way...XLE would have been an option as well...same signal...

xle_short.jpg
 
Another short I have taken is MO (Altria group).

This might not have been very wise due to the horizontal price action...but I gave it a try...

I shorted it after the DL break and the reentry in the old (green) range on heavy volume, being aware of the apex level which might stop the downmove - as it did (for now).

The action today is interesting. Can this be seen as a shake out?

What made me short this was the potential turn after a multiyear upmove...

altria.jpg
 
Shakeouts and thrusts aren't addressed in the pdf.

Otherwise, don't overlook the successful test of the Oct-Jan range.

Db
 
Otherwise, don't overlook the successful test of the Oct-Jan range.

Db

Which test do you actually mean?

The test of 61.50?

As far as I can see we have a breakout end of february (and a new high) followed by a lower high and a fall back into the range followed by a bounce from the hinge apex (which coincides the top of the old november to january range).
 
Which test do you actually mean?

The test of 61.50?

As far as I can see we have a breakout end of february (and a new high) followed by a lower high and a fall back into the range followed by a bounce from the hinge apex (which coincides the top of the old november to january range).

All of which fleshes out the context but doesn't have anything to do with the trade per se. Your DL was broken and you shorted the first RET. Whether you stayed in the trade or not after the SL was broken today is your choice, but not something I'd recommend to a beginner.
 
The USO short was obviously late and in terms of the weekly not at an extreme. The MO short was within lateral action i.e. not trending...

The other lesson is taking small losses...

Would you agree?
 
I agree about keeping your losses small. These losses, however, were unnecessary.

There was nothing wrong with the USO short, but you were more concerned with your entry than you were with price movement. Price didn't come anywhere near the SL, much less the danger point.

As for MO, there was nothing wrong with giving it a shot, but it's not a good idea to short stocks unless one sees weakness in the sector, and XLP is doing just fine.

Db
 
Thanks DB,

watching the sector before taking action in a stock is something I have to do in the future. Thanks for reminding me. Maybe I will have to read the part from the Wyckoff course again...

In regards to USO, my SL was broken and I'm not sure which one you mean. Another one could have been drawn, but that is in my eyes not the way it is taught in the book, no?

But sure, the exit was very early and price did not even reach the LSH (which I took to draw the line) by then.

According to the drill I see a reentry opportunity...but also potential for an upcoming range...

uso_010416.jpg
 
Status
Not open for further replies.
Back
Top