Straight Line Approach, The (the SLA)

Status
Not open for further replies.
Depends on what you want. You have a demand line and it has been broken and you do have a retracement following. But the primary shorting opportunity occurred over a year ago. At this point you are only a few points from the lower limit of the channel and price has bounced off 90 three times, so the likelihood of a profitable short isn't nearly what it would have been had the short been taken at the correct time.

Very interesting DBPhoenix, so the only really high probability short was the one taking place at the top of the channel..

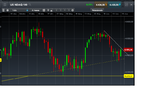
Here is another stock which I have been observing, specialy the most recent price action taking place at the weekly supply line which coincided with a previous Horizontal Support level.

Without getting into specific entries, would you say the reading is correct according to the SLA/AMT?

attachment.php


Many thanks!
 

Attachments

  • CITI.png
    CITI.png
    48.8 KB · Views: 2,044
I don't know what your horizontal lines signify. As the trend is up, one looks for long ops when the lower limit of the channel is tested. In this case, price broke through the lower limit, suggesting a short. The short however was stopped out, so a long is next. This was stopped out as well, so the trader does nothing until price begins trending again.
 
I don't know what your horizontal lines signify. As the trend is up, one looks for long ops when the lower limit of the channel is tested. In this case, price broke through the lower limit, suggesting a short. The short however was stopped out, so a long is next. This was stopped out as well, so the trader does nothing until price begins trending again.

The only horizontal line I drew is the red line at 48, which represents a previous support level and now seems to be acting as resistance.

My interpretation of context is that when price reached and rejected this level, which also coincided with the Weekly supply Line, a high probability trade presented itself (this week), That is a high probability of price falling.

I also took this to be a good candidate for a short given the fact that it got obliterated in 2009, and price has hardly recovered, whereas US indexes have surpassed their 2009 highs, making this stock a good candidate for a short by comparative weakness, which I undersantd is something that Richard W. would have applied (picking the weakest sectors and weakest stocks in the sector)

Regards
 
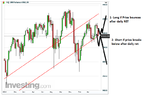
I attached a marked up chart. ES. Red=Short, Green=Long , the stop-outs are also marked. The black line on the far left is the premarket low for the day. For intraday trading the straight line method, are these trades taken correctly or incorrectly?

ps - I know that once the short was taken it could have been ridden for a good number of points. I'm wondering about the trades I have marked though that would have resulted in losses or break-evens.
thanks
 

Attachments

  • sla.png
    sla.png
    154.6 KB · Views: 253
Hello DbPhoenix!

So here one simply waits for the white supply line to be broken and then a Retracement to go long?

attachment.php


Cheers!
 

Attachments

  • NQ.png
    NQ.png
    46.3 KB · Views: 1,871
Alternatively.

So here one simply waits for the white supply line to be broken and then a Retracement to go long?

With a channel being identified one might choose to take the trade at the LL as a reversal rather than wait for a stride break and ret.

Given that price is in a channel and has tagged the LL the most probable direction is towards the UL, if demand is strong enough there might not be a ret until price reaches the UL in which case the trader would miss out on a 300+ point move.

The best places to take a trade are at extremes, the closer price gets to the mean the higher the chance one could get chopped up.

The attachment (16th and applicable to the 17th on the LL tests) is one of the things one could consider when price gets to a level where the supply/demand balance will most likely change.

(On a side note, price might be forming a hinge on the daily/weekly so who knows how things will play out.)
 

Attachments

  • nq16062016collage.png
    nq16062016collage.png
    108.3 KB · Views: 302
Last edited:
Thanks for the response Kleft! My problema is that I cant trade the 5 min bar interval because I have a day job, I can only go down to the hourly. In the case of the Long trade, I believe it was unconfirmed because after the DL break there wasnt a succesful retracement.

Now that the LL of the weekly trend cannel has been broken, I would be waiting for a retracement on the daily to enter a short trade, as I depicted in my most recent chart "Scenario 2".

Best wishes
 
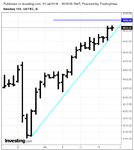
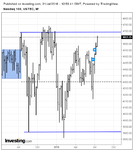
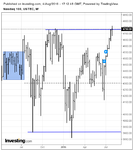
NQ Weekly & Daily

NQ Weekly: Approaching TR top.
NQ Daily: DL intact.
NQ Hourly: Will come into play in the area of interest.

There are other ways of looking at it. TC top from previous lines drawn by DB is also around where the TC top is. I see 4680s-47340s area as the area of interest. Yes, I know it's wide but it is a significant area. Beware of the wee hours of trading. A lot has started to happen during European morning hours.

Gringo
 

Attachments

  • tvc_9a0f24a961707d7bccc716e3c17af3c7.png
    tvc_9a0f24a961707d7bccc716e3c17af3c7.png
    29.8 KB · Views: 255
  • tvc_9fb00ca12b65124b8f6d0e063dbcd4ec.png
    tvc_9fb00ca12b65124b8f6d0e063dbcd4ec.png
    29.1 KB · Views: 257
There are other ways of looking at it. TC top from previous lines drawn by DB is also around where the TC top is. I see 4680s-47340s area as the area of interest.

Depends on how long it takes to get there as it's diagonal. As of now, the UL is about 4725. By next week it will of course be higher.

The time to go long, of course, was the RET after the re-entry into the channel (if one subscribes to AMT). The longer one waits after that, the higher the risk, due in large part to "profit-taking" and short-covering.
 
Price hasn't really gone down much during this uptrend. There's are small trading ranges formed that are tight and that's about it.
 
Could get interesting.

In the area of the upper limit and close to last years highs. Possible opportunity for a reversal coming up.
 

Attachments

  • nq28072016daily.png
    nq28072016daily.png
    36.4 KB · Views: 706
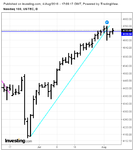
NQ Daily: Ret.
NQ Weekly: TR top. TL top (see Kleft's post above).

I am guessing most people can see it's a bit prudent to stay alert for a change in direction around these corners. If it comes it comes, otherwise sitting out is no less satisfying.

Gringo
 

Attachments

  • tvc_f5cb1a71c4354ea33e9b90b7b3396ac5.png
    tvc_f5cb1a71c4354ea33e9b90b7b3396ac5.png
    29.4 KB · Views: 214
  • tvc_ae58099ae5af1a3a7eec00f1451db3f1.png
    tvc_ae58099ae5af1a3a7eec00f1451db3f1.png
    31.5 KB · Views: 217
Last edited:
Possibly new TC?
 

Attachments

  • Screen Shot 2016-08-05 at 11.32.47 AM.png
    Screen Shot 2016-08-05 at 11.32.47 AM.png
    63.9 KB · Views: 252
  • Screen Shot 2016-08-05 at 11.37.49 AM.png
    Screen Shot 2016-08-05 at 11.37.49 AM.png
    26.4 KB · Views: 229
I was referring to the new blue channel as apposed to the old red one.

Yes. I had understood that. My comment was only about the general unrelenting uptrend. On the hourly and 5 hourly price move looks a bit strange, a bit too linear.

Gringo
 
Status
Not open for further replies.
Back
Top