If You Can Draw A Straight Line (You Can Become A Successful Trader)

Status
Not open for further replies.
"The journal, by the way, is key to this exploration given that "journal" stems from "journey", and while a journal may eventually incorporate a trading log in which one "logs" his trades, the journal itself need not and should not involve trading at all. And if comments are not solicited, it needn't even be public."


Why ? Arent we all traders ? Or we are here just to make endless theoretical and hypothetical discussions for years to come ?

Being traders and engaging in endless theoretical discussions isn't mutually exclusive.

The reasons for these discussions is to clarify, based on the W or SLA-AMT framework, whether what one's doing is consistent with what's theoretically put forth. The issue is that not everyone comprehends the same thing as it was meant to be comprehended and at times different words and unexpected explanations and examples lead to breakthroughs. The other issue is that there comes a time when one needs to tailor the trading to one's preferences and risk tolerances. Those who have gone through this process before are able to offer some advice in this regard. In reality there are only a few pages with examples one needs to read before the basics are made evident. Yet, this has still evoked a lot more questions based on existing beliefs and habits.

Gringo
 
Last edited:
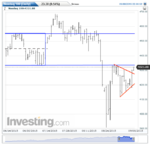
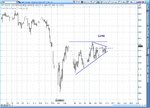
This represents a trading opportunity:
 

Attachments

  • 0908.gif
    0908.gif
    61.7 KB · Views: 311
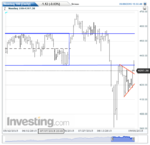
This represents a trading opportunity:

I see an opportunity to short. Price seems to be ranging between the trendlines and price has just bounced off supply line so could one short to the middle of the range (4225)? From what I've read of the SLA though trend channels consist of parallel trendlines so this would perhaps be considered a hinge, in which case we would expect a large move, possibly here out of the top but I would be less confident of this.

Please let me know if I'm in the right ball park or way off.

Thanks
.
 

Attachments

  • 0908b.gif
    0908b.gif
    45.6 KB · Views: 271
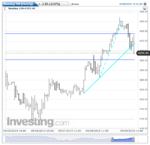
Price has broken out to the upside and moving towards 4335 area. Lets see what happens here. It's not an easy place to be long here, especially for overnight holders. Maybe it's just me waiting for some clarity. The swing lows to 3900 were a bit too wide for longs and hinges are like being on a ship at sea. There's a certain nauseating feeling associated with navigating them with dexterity. The idea is that not every position is suitable for every trader. We all have our risk tolerances and preferences. It's wise to pay attention to oneself instead of exactly trying to mimic another.

Gringo
 

Attachments

  • NQ Daily.png
    NQ Daily.png
    26.6 KB · Views: 288
Last edited:
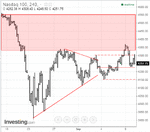
It's always humbling to see the system continue to do its magic. The sign that bid isn't willing to chase offer higher and now is retreating. Perhaps a retracement of some sorts in a day or so?
 

Attachments

  • NQ Daily.png
    NQ Daily.png
    27.8 KB · Views: 324
  • NQ Hourly.png
    NQ Hourly.png
    28.9 KB · Views: 337

Hello DB, after going thru your material on trade2win and other sites, I´ve found it most interesting due to its apparent simplicity and effectiveness.

However, I find going through your exchanges with fellow aspiring traders, that most of them seem to be fixated with intra-day trading the 1m interval. This is not for me, I don´t have the time, I lack the focus and quite frankly, the thought of being glued to the screen for hours waiting for opportunities to arise is daunting to say the least.

I have decided I want to trade the 60m interval, but I am really struggling to find decent threads and traders that surf the long term waves proficiently. Could you please recommend where I could find support for learning how to trade the amt/sla using longer bar intervals?

Best wishes,

Gotu.
 
First Trade Placed Today

Hi, today I placed my first trade using the SLA method. I know now I didn't follow the rules exactly and could probably have done better than I did but I'm happy I got started. I am going to post the charts as I saw them at the time in this post and also as I have annotated them with hindsight in the next post.

As I still have the training wheels on I'm using a SB account to execute my trades. I have a small account open. I chose to do this not because I want to make money so much as I think I need to experience the emotions and natural reactions you get when actual money is at stake. I have tried to use demo accounts but I don't think they work for me because the emotions aren't there.

Please let me know what I did right/wrong.

Cheers
 

Attachments

  • FTSE60m.png
    FTSE60m.png
    59.4 KB · Views: 348
  • FTSE5m.png
    FTSE5m.png
    92.8 KB · Views: 310
Last edited:
Hi, today I placed my first trade using the SLA method. I know now I didn't follow the rules exactly and could probably have done better than I did but I'm happy I got started. I am going to post the charts as I saw them at the time in this post and also as I have annotated them with hindsight in the next post.

As I still have the training wheels on I'm using a SB account to execute my trades. I have a small account open. I chose to do this not because I want to make money so much as though I think I need to experience the emotions and natural reactions you get when actual money is at stake. I have tried to use demo accounts but I don't think they work for me because the emotions aren't there.

Please let me know what I did right/wrong.

Cheers

Hindsight charts posted below.
 

Attachments

  • FTSEPOST5m.png
    FTSEPOST5m.png
    61 KB · Views: 309
  • tvc_5626f7784698f2032bc6a34a93726365.png
    tvc_5626f7784698f2032bc6a34a93726365.png
    53.3 KB · Views: 289
Hello DB, after going thru your material on trade2win and other sites, I´ve found it most interesting due to its apparent simplicity and effectiveness.

However, I find going through your exchanges with fellow aspiring traders, that most of them seem to be fixated with intra-day trading the 1m interval. This is not for me, I don´t have the time, I lack the focus and quite frankly, the thought of being glued to the screen for hours waiting for opportunities to arise is daunting to say the least.

I have decided I want to trade the 60m interval, but I am really struggling to find decent threads and traders that surf the long term waves proficiently. Could you please recommend where I could find support for learning how to trade the amt/sla using longer bar intervals?

Best wishes,

Gotu.

Except for "Appendix G: Trading the SLA/AMT Intraday", the book focuses on weekly, daily, and hourly charts, as does the condensed version in post #1. It's up to the individual trader, of course, to apply the principles -- or try to -- to whatever instrument jingles his bells. If it provides tradeable trends and tradeable ranges and the trading opportunities occur sometime other than the middle of the night, then he's got something to work with.

Most of those who are interested in this are in the Near and Far East. Don't ask me why. There are also quite a few from Colombia. Again, don't ask me why. (Perhaps you Colombians could put together a support group 🙂) But the sun does not rise and set on New York City.

Those who are trading longer bar intervals and timeframes don't post much, largely because they're trading longer bar intervals and timeframes. And they don't have a great deal of patience with what goes on in trading forums. So you may find that you're pretty much on your own.

I suggest that you open up a journal. They are restricted here, which means that you can bar people on your Ignore list from interfering, or you can limit the participants to those you invite. If you don't want to fool with an Ignore list, I suggest the latter. You may get more requests from potential participants than you think. Or you may get none. Only one way to find out. But this thread is already too long, and if people start using it as a substitute for journals, it will become unreadable.

Let me know via PM what you decide to do.
 
Hi, today I placed my first trade using the SLA method. I know now I didn't follow the rules exactly and could probably have done better than I did but I'm happy I got started. I am going to post the charts as I saw them at the time in this post and also as I have annotated them with hindsight in the next post.

As I still have the training wheels on I'm using a SB account to execute my trades. I have a small account open. I chose to do this not because I want to make money so much as I think I need to experience the emotions and natural reactions you get when actual money is at stake. I have tried to use demo accounts but I don't think they work for me because the emotions aren't there.

Please let me know what I did right/wrong.

Cheers

If you open up a journal and transfer all of this there, I'll be happy to comment on your charts and trades there.
 
If your purpose is to provide yourself with a rough zoom-out, this is fine. However, if you're looking to determine the presence of trend and/or potential support/resistance levels, I suggest you not use a 4h chart; you're leaving out more than half of each day.
 
From the attic:

A line chart is suggested only because the usual charting sites don't offer tick charts. And even some charting programs don't offer the tick option unless you pay extra for it. But a line chart does nothing except connect the price points with a line.

Wycoff, of course, did not maintain intraday bar charts. How could he? But then maintaining intraday bar charts is a relatively new phenomenon. Unless he was scalping, he'd find his spot on daily charts, then monitor the intraday action in order to get as close as possible to the point where the stock was "ready" to move and where risk would be minimized, but he wouldn't be using charts; he'd be using P&F, or just keeping track in his head.

In other words, he'd know, as in the case of JPM, that 25.5 was important. If he was going to take his position intraday, he'd then watch what traders did when price approached that level. He'd note where price was straining to advance. He'd watch the activity to see where the balance between buying pressure and selling pressure lay. He'd then take his position just under that point where price kept "hitting a wall". The idea of waiting for the clock to tick over 5 minutes or 15 minutes before he opened his position would have seemed ludicrous to him, much less wait an hour. What would be the purpose? There is, after all, no "close" during the day, but rather a continuous flow of trading activity and price movement.

So why didn't Wyckoff use line charts rather than bar charts for his daily record-keeping? They certainly would have been simpler and faster. But there is a lot of information contained within that daily bar. If you're listening to the market's story, each bar will tell you something of the balance of power between buyers and sellers and how hard each of them has tried to advance price or pull it back. Wyckoff understood the inescapable fact of continuous price flow. When he looked at a bar, he saw not a bar as a finished product but the waves and currents and eddies of buying and selling pressure that created the bar. If you want to be fanciful, it was not a stick of dead wood with a bump on it here and there but rather a "flash" stick. The bar, for him, was nothing more than a summary of what buyers and sellers did to create it, nor did it have any particular importance beyond its place in the continuous flow of trading activity and price movement. As long as one is sensitive to this flow and in synch with it, he can apply W's approach to his trading without using bars at all, or even charts.

Since intraday bar charts have been around for a generation, those who are less than middle-aged may have difficulty seeing price movement in any other way. Line charts are merely a bridge to the realm of continuous price movement. Your charting program may provide several options -- line on close or open or high or low or a high/low average or a high/low/close average or whatever -- but which you choose is largely irrelevant, including the interval on which the line is based: tick, minute, hour, and so forth. To attach too much importance to how the line is plotted is to generate the same mystique and pseudo-importance that is attached to the bar.

It's not about jogging from side to side for five minutes or fifteen minutes or an hour then jumping ahead and running side to side for another five or fifteen minutes or hour. It's about putting one foot in front of the other, again and again, maybe forward, maybe angling this way or that, maybe turning around and returning to the starting point, but always moving, always one foot in front of the other, sometimes slower, sometimes faster, but always moving.
 
There can be valuable information in time based charts that you don't get in tick charts in the same format. You don't after all have to catch the extremes to make a profitable trade. You can get in with just as small risk as you would if you entered by the tipping point. Also finding the tipping point can often be elusive and I personally only jump in when price moves and not before.

The valuable information I am referring to is a window of <n> trading bias. There is generally multiple opportunities to jump in technically where you have viable protection (zones were other traders jump in) to hang a stop. So while I do somewhat agree with your points, I also think you have some bias yourself towards one over the other which could be accepted by anyone as the only way to do it,when it is not.
 
There is no difference between a time-based chart and a tick chart, therefore I have no bias toward one or the other. All charts are, after all, tick charts; the only differences reside in how the ticks are grouped in order to form a "bar". These groupings attract the attention of different classes of traders, which is why price behaves differently if one is viewing a "5m" chart vs a "15m" chart vs a "60m" chart. These groupings are completely artificial and are relatively new. The important focus, then, should not be the bar interval but who's watching it and trading it.
 
Status
Not open for further replies.
Back
Top