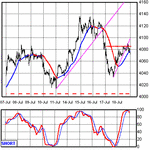
FTSE 100 intraday trading - JULY 2003

  • Thread starter Thread starter bonsai
  • Start date Start date
  • Watchers Watchers 6
bonsai:
I used to graph OBV a year ago for the FTSE 100 but found other indicators were more productive so dropped it. Although I still use it for individual shares. Sorry.
Looking at the FTSE 100 for Monday my initial trading plan is:
1) Fulcrum: 4100
2) If the market allows I will buy above the Fulcrum.( i.e. if the market jumps way above 4100 at the beginning I will not chase it
but will then look for possible shorts. )
3) Initial Target Zone 4120-4130
4) If it dips below 4070 but hold Fri closing price of 4056 I will go long.
However plan will be confirmed by the direction & strength of the Far East,S&P & the first 20-30mins of the European markets. (I may drop the latter condition)
 
STRONG PPC

The chart below shows the strong parallel price channel in operation. Do you think that a move to the top of this range is on the cards? Don't take notice of the downtrend line.
 
Not too sure I like the way your trend lines ignore the spike
bottoms but I know its often done.
It just makes me wonder whether the middle line is as valid
as it looks.

But I do have an ' untested ' 50% fib at 4280.
Its a bit difficult to know exactly where the original downtrend
started but I have used 5282.
So a test of the recent high is on the cards.
Unfortunately so is a retest of 3800.

Now the problem is which will come first ?
 
Tubbs

The bases of the last two strong Monday rises seem to have provided good support - as is envisaged by such strong candlesticks - which seems pretty bullish. Given DOW close might we expect another strong Monday? Followed by......?

whatever - good trading

jon
 
Last edited:
As a counter to my own view, you might like to know John Piper
thinks the move off the 3952 low is corrective.
But even with that scenario, a pull back to 4200 is possible if
it is a '2' wave.

The high of 4219 having been an elliott 'A/B/C' wave from 3277
 
Surely the price will retest the high ( the middle line shown on chart ) and then move downwards to try to test support. The main good news in all this I believe is that while this cycling continues the price is slowly advancing. Obviously something has to give in the end
 
bonsai said:
As a counter to my own view, you might like to know John Piper
thinks the move off the 3952 low is corrective.

Bonsai,

is that on the basis of the wave count since 9/00 high?

jon
 
barjon
the wave count starts form 4219 with 1 wave down to 3952 and now 2 wave pull back.
 
the longer term wave count to which I think you are referring
starts with high of 6950 down to 3277.
I think that equates to your 6938.
That move seems to have been an ABC and John thinks
we have now seen a corresponding ABC up to 4219
So on that basis the next move down is already underway
although we may have a retest of 4219 first.

Does that help ?
 
bonsai,

right, thanks - I was wondering if Piper was coming from a much longer term viewpoint. I'm a babe in arms when it comes to waves and trying hard to pick it up!!

good trading and good night.

jon
 
Bonsai

posts crossed - yes, that's what I was getting at.

sweet dreams

jon
 
just another view of where we are using my RSI

but it is a short term indicator (1 day)
 

Attachments

  • rsi.gif
    rsi.gif
    8.8 KB · Views: 313
Last edited:
Bonsai, do you often get spikes like that in the FTSE? Is there a case for going contra the spike in the morning....I used to have a strategy with the SB by always selling if they marked it up more than 1%...it seemed to always work...any thoughts?
 
bonsai: Too early to say. 4090 was Fri High. There appears to be strength in this trend led by banks & oils. Keep an eye on the difference between the fulcrum of 4100 and price.
 
spikes/ gaps are not infrequent.
Yes I do sometimes trade against them but there is also a case
for trading with them occasionally.

I am not a scalper so I only do it in conjunction with some chart indicator like a trend line hit. Although having said that I seldom
hold the position for more than 10 mins.
I usually close at half the spike.

Not sure how many trades you would get if you waited for 1%.
Not very many ?
 
No, it certainly wasnt a regular feature, and it was always in conjunction with analysis visavis ( not correct spelling, i think) the SP500..

anyway, just a thought...thx
 
I've just noticed youmentioned sb's

They dont always move as rapidly as the market so
they present an added dimension.
 
Back
Top