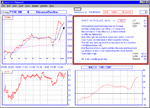
FTSE 100 Intraday trading - August 2003

  • Thread starter Thread starter bonsai
  • Start date Start date
  • Watchers Watchers 5
Res at top of daily/hourly upchannel 4239 then Bonsai's 50% fib at 4280 as far as I can see. Could this be a stop run to take all the shorts out before a savage decline?

There is a major Fib time wave projection arriving at the end of trading on Friday (on the S&P 500). This particular time wave is a 1.618 projection from the December 2, 2002 high to the March 12, 2003 low. It is an unambiguous wave and I expect a major sea change (a new trend) after the “time”. Unless the market collapses below key support before Friday afternoon, we'll likely call Friday the end of a sideways congestion, or an intermediate market peak.

We only get about three or four of these per year. I do expect the next market leg to be a big down move.
 
Neg divergence aplenty on the hourly chart too. A three peaker no less. Got to be worth a short here.
 
2468steve said:
must admit smells and looks like a stop run.Not being confirmed by US

give it some time Usa got another 6 hrs to go. wish s&p does not touch 93 today, otherwise many shortes will be kicked out.
 
I reckon SPX could go to 994.5 and still be a normal 618 retracement from 1015. The top of the 60 min channel is at 997ish. Interesting times...
 
I'm not so sure, 2468. This looks pretty solid to me, bulls have
been on the attack all day across a broad front (still only RBS a
loser in ftse 14) despite fairly stiff resistance at 220 which
collapsed so suddenly.

probably wise to see frugi's time wave out of the way.

in any event we'll go with the flow.

good trading

jon
 
Last edited:
rugi.
I am studying fibbs retracements and wave projections,where can I get the information from about time waves.I would like to
learn how to do this. You can PM me if you wish.
lol regards
 
yes, quite rare these days.
but I am holding 2 longs and both look pretty safe.
if the dow can be persuaded to break 300 again ......
 
Fluke,

I subscribe to a website which does a lot of Fib timing studies (won't put the name on here in case it looks like advertising - I'll let u know the name if you want) but you could just use simple drawing software to overlay lines of the correct length. I drew the first lines in, measured them, and then timesed the measurement by 1.618 to obtain the second (projecting) lines like so:

fib.jpg


HTH.
 
The bear market rally is alive and well it seems.

Perhaps today illustrates that it's always dangerous to
start the day with preconceived ideas about the direction ?
A good helping of humility helps the medecine go down !

I am off for a while now. Not going to look at a screen or a
newspaper or even listen to the radio except for the weather
forecast.
well that's my intention. Have put the computer on auto -pilot for
the next few days.

cya
 

Attachments

  • aug14.gif
    aug14.gif
    22.9 KB · Views: 540
frugi.
Thanks for your reply,have taken copy but would really like to pursue this time projection method.So if you would be kind enough to tell me the site,I would be grateful.
PM me if you dont want to advertise.
Regards.
 
Back in after an afternoon out. Closed earlier short for 6 points, but reopened whilst out, taking a punt. Went long on the Dow and just closed for 64 points. Looks like this rally may have a bit more steam, but it's above the BB so I don't think the Ftse can go far before a major turn. Could maintain positive bias into next week though.
 
mornin' all

So are we going to play while the cat's away?

Thought I would take the opportunity while Bonsai is not
on the board ........


the purple prose in praise of bonsai's contribution now
edited to save his blushes


......... I know you all appreciate his contribution as much
as I do.


good trading

jon
 
Last edited:
I for one agree that he is an important asset to the site and indeed to people trading the FTSE.
Dont trade UK much myself but i do sometimes have a dabble.

Now for gods sake man, edit you post by the time he gets back
b4 you totally ebarass him into hibernation 🙂.
Maybe replace is nam with Lord Jamla??

Temp
 
Now that we appear to have taken out the old resistance of 4218.8 (18/06/03) and 4218.6 (02/12/02), despite non confirmation by Wall Street (is London a leading indicator or a fool?), the next point of resistance would appear the peak of 4466.4 (21/08/03). Any thoughts.
 
Of course this is a medium term expectation. I presume we will test the breakout first, to check it is for real.
 
Back
Top