You are using an out of date browser. It may not display this or other websites correctly.
You should upgrade or use an alternative browser.
You should upgrade or use an alternative browser.
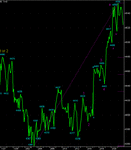
it may be trying to fool me but £ made a clear 5 legs up yesterday before starting to correct.So I am reading this as a return to the uptrend but first we have to go through a 2 wave of some sort ?
so the current move may just be a 'b'.
maybe not.
so the current move may just be a 'b'.
maybe not.
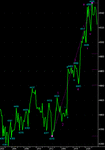
After my 5 wave observation FTSE100 managed a 50% retracement to touch the gap, but failed at the 1 day declining SMA. Not to encouraging. Suggests that, at very least, we are witnessing wave c (if you want to be more bearish make that wave 3.)
Wave 1 or A = 38
Wave 2 or B=19
wave 3 or C=
if C=a: 4500
if C=1.62 of A: 4476.
Just some idle thoughts
Wave 1 or A = 38
Wave 2 or B=19
wave 3 or C=
if C=a: 4500
if C=1.62 of A: 4476.
Just some idle thoughts


