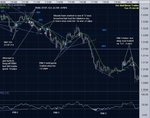
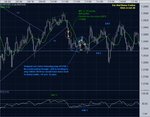
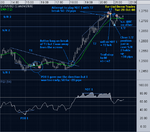
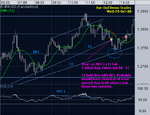
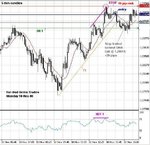
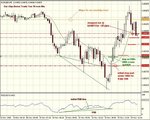
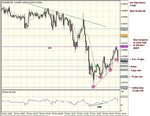
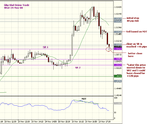
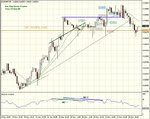
Eur-Usd SL demo trades

Hi Neil. The "Buy On A Stop" is to keep from having an order placed before to target price is met. For example...

A 123UP is forming.
#2 is at 1.3420

A "Buy Stop" will get you a fill if prices hit and exceed the 1.3420 (Normally)

A "Buy Limit" can get you a fill before the 1.3420 price is hit. ( A Limit Order is like an "Or Better" order.) This can be good sometimes. However, what happens if you get a fill at 1.3415 (a 5 pips better fill)and then the market does a flip and goes down before the 1.3420 price is hit. That good fill then turns into an OOPS. :cry:

There are a number of things that should be considered with price patterns. One of my rules is to not try to out guess the markets. Also, I have to have at least 2 indicators to confirm the price movement. One of my favorites is the MACD.

ie: If a 123 UP develops and the MACD is not going up in support of the #3 leg when climbing towards a #2 breakout of the pattern then I will pass on the trade.

I'm trying an "Accelerator oscillator" as a qualifying oscillator because it seems to cut the lag time of the MACD.

I hope this helps a bit.

Good trading
RT... :clover:
 
Hi Neil. The "Buy On A Stop" is to keep from having an order placed before to target price is met. For example...

A 123UP is forming.
#2 is at 1.3420

A "Buy Stop" will get you a fill if prices hit and exceed the 1.3420 (Normally)

A "Buy Limit" can get you a fill before the 1.3420 price is hit. ( A Limit Order is like an "Or Better" order.) This can be good sometimes. However, what happens if you get a fill at 1.3415 (a 5 pips better fill)and then the market does a flip and goes down before the 1.3420 price is hit. That good fill then turns into an OOPS. :cry:


There are a number of things that should be considered with price patterns. One of my rules is to not try to out guess the markets. Also, I have to have at least 2 indicators to confirm the price movement. One of my favorites is the MACD.

ie: If a 123 UP develops and the MACD is not going up in support of the #3 leg when climbing towards a #2 breakout of the pattern then I will pass on the trade.

I'm trying an "Accelerator oscillator" as a qualifying oscillator because it seems to cut the lag time of the MACD.

I hope this helps a bit.

Good trading
RT... :clover:
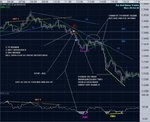


Hi RT,
Thanks for your response, much appreciated.
I understand now what you're saying. As far as I can see, Oanda just seem to offer market orders and limit orders. No mention of "buy on a stop".
I'll just have to make the best of it I guess.

Thanks for your tips on seeking confirmation from the oscillator on the price direction.
I like the RSI; it's nice and easy to understand.
Currently I'm tending to use simple 3 or 2 peak divergences of RSI against price as my primary set up indicator and then looking for support/resistance/trend lines to provide confirmation and entry points. Nothing original or ground breaking I'm afraid.

I also use your 1-2-3's to provide additional entry points following divergence+confirmation. Thanks :)

Good luck with your accelerator oscillator; hope it works nicely with the 1-2-3's.

Best Regards,
Neil
 
Hi,
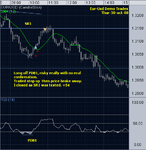
Just one trade yesterday for +22 pips.
I think the entry / set up was ok but the exit was poor; I missed out on most of the move. Trailing the stop behind the SMA or exiting on a PDB would have been more profitable.
You can't tell at the time though so you just make the decision and move on.

I didn't take the PDB entries; I couldn't see any sort of confirmation.

Best Regards,
Neil
 

Attachments

  • eur-usd-mon-20-oct-08a.jpg
    eur-usd-mon-20-oct-08a.jpg
    108.3 KB · Views: 140
Hi,
A few losing trades yesterday as I tried to play divergences against a strong down trend.
Losses were reasonably well limited; I came out with -28 pips. I was a little too hasty to jump back in on the 3rd and 4th trades which were -16 and -21 pips each. If I could have avoided these trades, I would have finished with positive pips.

Best Regards,
Neil
 

Attachments

  • eur-usd-tue-21-oct-08a.jpg
    eur-usd-tue-21-oct-08a.jpg
    106.1 KB · Views: 124
Last edited:
Hi,
Three trades early on yesterday but then the price movement became very choppy.
The trades were a little rash on reflection; no real confirmation on the last two and RSI never ventured outside the mid band 70/30.
Finished up with -27 pips and Kept out of the way for the rest of the day.

Best Regards,
Neil
 

Attachments

  • eur-usd-wed-22-oct-08a.jpg
    eur-usd-wed-22-oct-08a.jpg
    100.4 KB · Views: 119
Hi,
No trades for me for the last couple of days of last week; no entry signals available.
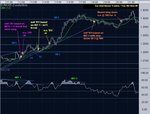
Had a decent trade today after a slight misfire on the first trade of -15 pips.
Managed to trail; my stop on the second trade for +41 pips.

Things came unglued later on when I attempted to play NDT 1.
Finished up -12, -21 and -26 pips.

Here's the chart...
 

Attachments

  • eur-usd-mon-27-oct-08.PNG
    eur-usd-mon-27-oct-08.PNG
    40.6 KB · Views: 112
Hi,
My losing run continues, although I did manage one winning trade today.
I took 3 trades in total.
The first was a long off a fairly healthy PDB. The entry was a little early and I was stopped out for -20 pips. Later on, I was able to draw in T1 and when that was broken, a nice strong up-trend occurred. I was away at the time though.

The second trade was a short off an NDT with a break of trend line, T2 but I was taken out once more for -24 pips as the price re-traced.

The last trade was based on the same setup as above but this time it worked...for a while.
Just to ease earlier losses, I closed 1/2 the position (at +38 pips) as support was reached and left the other half to run with a BE stop behind it.
The BE stop was taken out fairly quickly as it turned out.
Maybe I should have closed the whole position?

Anyway I've finished down effectively -25 pips. Let's see if I can get back on track over the next couple of days.

Best Regards,
Neil
 

Attachments

  • eur-usd-tue-28-oct-08.PNG
    eur-usd-tue-28-oct-08.PNG
    32 KB · Views: 111
Hi,
Just a quick catch up.
Two trades, one from yesterday and one from today.
They were -11 and +54 pips respectively. I could have closed yesterdays trade
for BE or maybe even 20 pips or so but I misread the situation completely.

Still it's nice to report at least one winning trade.

Best Regards,
Neil
 

Attachments

  • eur-usd-wed-29-oct-08.PNG
    eur-usd-wed-29-oct-08.PNG
    22.4 KB · Views: 122
  • eur-usd-thu-30-oct-08.PNG
    eur-usd-thu-30-oct-08.PNG
    20.2 KB · Views: 120
Hi Folks,
Just one trade yesterday for +23 pips from a risk of 26 pips.
The entry was ok but the exit was poor.

RSI divergence bottoms / tops seem to come in quite a variety of forms.
Two basic contrasting types for example are the 'quick bounce' versus the 'slow turn-around'.

In the former, the price just pulls the indicator into over bought / oversold for a very brief period just once or twice as it quickly tests the waters at a certain level.

With the latter the price has a flatter region where it tests S/R and the RSI spends longer dwelling beyond +70 / +30.

Also, when you get dramatic price moves as of late, the RSI seems to go into a sort of saturated condition as it drives out towards its extreme values of 0 and 100. It seems to form less reliable divergences under these conditions.

Enough rambling, here's the chart...
 

Attachments

  • eur-usd-fri-31-oct-08.PNG
    eur-usd-fri-31-oct-08.PNG
    23.7 KB · Views: 130
Hi Folks,
Losing trades again yesterday. Tried to catch a few knives and came off the worst for it.
+1, -22,+1, -23,-15
I could do with figuring out some entries based on divergence failures.

Best Regards,
Neil
 

Attachments

  • eur-usd-mon-3-nov-08a.bmp
    1.3 MB · Views: 99
Hi Neil. I have to say that I don't think I would be a good 5 min trader. How you can do it is beyond me. :cheesy:

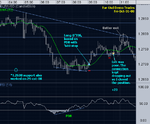
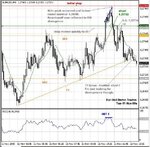
There is a small 123 Down that formed up at your "Buy '748 (PDB1) +SR1" point on your chart. But that's the makings of a down trade. (Note the indicators below on my chart.) :-0

It's not the best 123 DN I've ever seen but it is there.

Is the system you are trading one you created or one you got online? I know mechanical systems work. I just can't figure them out is all. :eek:

I do know that the price patterns I use work really good in the futures markets. However, I'm not all that sure about the FOREX markets. The more I get into placing FOREX orders the more I start to doubt my patterns. :eek:

Anyhow, good trading

RT... :clover:
 

Attachments

  • eur-usd-5min.jpg
    eur-usd-5min.jpg
    48 KB · Views: 116
Hi RT,
Thanks for dropping by..

Hi Neil. I have to say that I don't think I would be a good 5 min trader. How you can do it is beyond me. :cheesy:

Yes, I guess it's each to his own; I used to spread bet on the Dow with 1 min charts.
That was a quite a long time ago and I have learned a few lessons since then.

There is a small 123 Down that formed up at your "Buy '748 (PDB1) +SR1" point on your chart. But that's the makings of a down trade. (Note the indicators below on my chart.) :-0

It's not the best 123 DN I've ever seen but it is there.
Ahh.. didn't spot that at all. Thanks for pointing it out. I would have maybe kept out
if I had seen it.

Is the system you are trading one you created or one you got online? I know mechanical systems work. I just can't figure them out is all. :eek:

I'm just taking counter trend divergences and using support / resistance
and trend line breaks for confirmation.
It's just text book stuff but my introduction to it's use was here on T2W on an old thread by a chap known as "Chartman".
More recently, other threads on here have rekindled my interest in divergence trades.

A couple of features I like about this approach:
1. It keeps me out of the market when it gets choppy.
2. The conditions where one may consider an entry are easy to identify.

Downside:
1. Trends which have underlying strength lead to repeated divergence failures and these can be costly as you try to play the retraces.
2. It can be tricky timing the entry to get in at around the point where the price turns or
at least enables you to enter at a point where the price moves sufficiently in your direction so that you can get the stop to break even.

I do know that the price patterns I use work really good in the futures markets. However, I'm not all that sure about the FOREX markets. The more I get into placing FOREX orders the more I start to doubt my patterns. :eek:

Well, some argue that price action and TA work across all markets.
I have limited experience but with respect to charting, Eur/Usd seems to be very similar to the Dow.

Good luck with your Forex patterns, keep us posted :)

Best Regards,
Neil
 
Hi Folks,
Just 3 trades yesterday.
All losers unfortunately. I could have taken some pips from the last trade but I just moved the stop down a bit and let it run. Finished with -26, -41 and -9
I've had a look back through my trades and it seems that I do a little bit better when I move the stops in quicker to break even. I miss some good moves but losses are better controlled. I will try this theory out over the next few weeks.

Here's the chart:
 

Attachments

  • eur-usd-tue-4-nov-08a.jpg
    eur-usd-tue-4-nov-08a.jpg
    88.6 KB · Views: 115
Hi Folks,
No trades to report from last week; there were no signals or set-ups on Eur-Usd for me.

Oanda feed has gone very flaky at work at the moment so I’ve taken the opportunity to try out North Finance demo instead. I miss the instant execution but the feed seems steady, well the application appears to be a bit more tolerant with data / connection drop out etc. Oanda feed still seems good at home.

Over the weekend I have been trying to define my strategy more clearly by re-running recent months on the screen using (F12) and noting any possible improvements.
The revised system is broadly now as follows:

Wait for at least 2 successive clear peaks on the price action.
Take a look at RSI(14) it should ideally be overbought / oversold on the first of the price peaks.
Identify if a divergence has occurred.
If yes, place stop just beyond the high peak.
Look for the entry level and accept the risk if it’s within bounds.

Enter when SMA is crossed in the direction of the divergence.

Move stop to BE as soon as possible, accepting that often it will be taken out just before a good move.

Trail stop behind SMA accepting that there will be pips left on the table.

Take S/R and trend lines into account as the framework for the trade.
Mix in a little 1-2-3 where appropriate and leave to simmer.


Having stated the rules, I took two trades today and I don’t think I managed to stick to all of them.
My first trade was a slight departure from Eur-Usd; I’m keen now to expand my repertoire. I couldn’t resist playing a promising PDB set up on Gbp-Usd (5min).
The stop placement was correct but the entry was too early, the wrong side of the SMA. The price action looked good though.
Another departure from the rules was that I wasn’t able to move the stop in quickly to BE as I had to drive to work.

As it turned out the trailing stop gave me a +61 pip exit for an initial risk of 25 pips.
My second trade was Eur-Usd using a negative divergence on RSI.
This was more in line with the rules but I chose to take a risk on the SR actually failing to allow a larger move south. This was greed in action if you like. I should have closed near the S/R and looked for another entry.
Had I done that I would possibly have got back in on what turned out to be the third NDT peak after which the S/R did fail and a nice break south followed.

The R:R was poor on this one too at 16 pips risk for +20 pips reward.
Enough waffle for now. Here are the charts…

Best Regards,
Neil
 

Attachments

  • gbp-usd-mon-10-nov-08a.jpg
    gbp-usd-mon-10-nov-08a.jpg
    94.1 KB · Views: 120
  • eur-usd-mon-10-nov-08a.jpg
    eur-usd-mon-10-nov-08a.jpg
    67.6 KB · Views: 130
Hi folks,
Took a Eur-Usd trade this morning based on RSI divergence.
I placed the stop just above the price peak. Interestingly the peak was just about at 1.28000, a nice round number.
Maybe I could use round number levels as part of the confirmation criteria for divergence entries?

It went very well at first but I realised that the fact that the price had moved in my favour very quickly also meant that it could possibly jump back against me with equal speed.
I stuck to the plan and moved the stop to BE while I had the chance. The anticipated spike back came and I was stopped out for +3.

I looked at getting back in but in the end decided just to wait for another set up later on. I’m trying to give myself a bit more breathing space between set ups / trades.

Here’s the chart:
 

Attachments

  • eur-usd-tue-11-nov-08a.jpg
    eur-usd-tue-11-nov-08a.jpg
    85 KB · Views: 132
Last edited:
Hi Folks,
I've been trying to get used to MT4 demo; it's got a very different feel to Oanda demo.
I reckon Oanda is much better if you're interested in adopting a scalping type strategy.
The execution is 99.5% of the time instant on Oanda but MT4 with North Finance has to go away for several seconds to get you a fill or a re-quote. when the fill comes back it usually is at the wrong extreme of the candle.
Having said that MT4 is a fantastic package in terms of analytical bells and whistles.
It even works out all your trade history stats. for you.

Anyway, I'm trying to expand my horizons a little so I had a little look at Eur-Gbp pair.
A nice PDB formed early on so I placed a buy order. Unfortunately, I decided to close it through nothing more than fear for a measly +7 pips.

Later I noticed the pivot level SR 1 forming at 0.8568.
I tried some entries based on trend line and minor resistance breaks but lost 32 pips, in small bites trying to get on the correct side.

When the real breakout came it was spot on at the pivot level and was pretty spectacular following all the congestion up to SR 1. I took +57 pips in around 11 minutes. I just guessed at the exit. I don't think there's much point trying to trail the stop or anything in these circumstances; it's a break out.

If I had simply held on to my basic PDB entry I would have achieved much better results with far less work.

A later play on an NDT gave +11 pips but again the exit was too early; later on the price moved much further down. I couldn't be bothered looking to re-enter, happy to finish with +36 pips clear.

I think the chart pattern illustrates very well the power of the SR pivot in helping to plan one's trade and how a simple positive divergence off the RSI can lead you on to better moves, a good level break out in this case.
I just need to learn to use these tools in a better, more disciplined way.

All the best,
Neil
 

Attachments

  • eur-gbp-fri-14-nov-08.PNG
    eur-gbp-fri-14-nov-08.PNG
    51.9 KB · Views: 125
Hi All,
just some initial notes on where I'm at.

In an effort to increase trading opportunities, I'm demo trading three pairs now :
Eur-Usd, Eur-Gbp and Gbp-Usd.
To keep things simple, I will only open one position at a time.

I'm using the same divergence system on all three pairs.

At the moment, I'm using FxPro MT4 / North Finance demo in preference to Oanda demo.I think our servers are fairly busy at the moment and it appears that FxPro is able to cope better with the lower available bandwidth.


Another Eur-Gbp demo trade this morning.
Entered on a positive divergence of RSI when the price moved strongly back over the SMA.
I placed the stop just below the SMA for an initial risk of just 8 pips.
I then trailed the stop up behind the SMA and was taken out for +20.
A monthly SR level shown in orange threatened to block upward progress of the price. The price went straight through it. Order was restored however some 15 minutes later when the price realised what it had done and came back below the monthly SR to take out my stop.
I suppose It's always worth thinking of SR lines more as regions; It appears momentum can carry price some distance through these regions until the supply / demand gravitational effect takes over and pulls price back in.

I guess it's ok this one. There were around 40 pips on the table at one stage so you have to be prepared to give pips back in case the move continues.

Best Regards,
Neil
 

Attachments

  • eur-gbp-tue-18-nov-08a.jpg
    eur-gbp-tue-18-nov-08a.jpg
    101.3 KB · Views: 118
Hi,
Just the one trade.
Poor R:R with a 6 pip win from 22 pip initial stop.
It never really looked right somehow, no damage done though.

Finally finding my feet with MT4.
 

Attachments

  • eur-gbp-wed-19-nov-08a.jpg
    eur-gbp-wed-19-nov-08a.jpg
    91.2 KB · Views: 121
Another trade for today on Gbp-Usd.
+46 pips but still poor R:R with 48 pips initial risk. With a little patience I could certainly have taken 100 pips or so.

Here you go...
 

Attachments

  • gpb-usd-wed-19-nov.PNG
    gpb-usd-wed-19-nov.PNG
    27.1 KB · Views: 144
This one is embarrassing but here goes.

Three trades. The first was a short as price moved back below monthly SR (orange) with an NDT behind it. Almost instantly, after placing the order, the price flipped back to stay north of the support. Seeing the long shadows thus formed, I closed before my stop was hit for -6 pips.
Not too bad so far but in trade two I was again suckered into trying to play a break of the monthly S/R again with a wider stop. This time I had no chance to bail out and was taken for full stop value of -20 pips.
Just to cap it off, I decided to try and get even by going long on break of the minor resistance line (in blue). I was in late and got a very bad fill at the high of the breaking candle. I did manage then to sit back and acknowledge my emotional mistake and closed for -8 pips.

I've discovered that I'm fairly good at identifying S/R regions but I tend to ignore what they are telling me unless it suits my preconception of what I think will happen.

I need to dump the preconceptions and acknowledge the S/R's even when it doesn't suit me to do so.

Chart included.

Best Regards,
Neil
 

Attachments

  • eur-gbp-thu-21-nov-08a.jpg
    eur-gbp-thu-21-nov-08a.jpg
    108.4 KB · Views: 117
Top