You are using an out of date browser. It may not display this or other websites correctly.
You should upgrade or use an alternative browser.
You should upgrade or use an alternative browser.
bansir
Well-known member
- Messages
- 494
- Likes
- 42
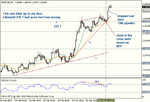
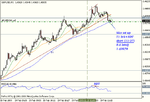
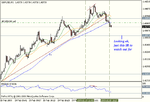
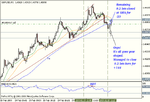
Here's a slightly better one, my second trade...
It's a nice example of how closing half the position early can offer some protection
should the trade start to go wrong.
Check out the chart sequence in order (gbp-usd-thu-19-feb-09a, b, c).
Best Regards,
Neil
It's a nice example of how closing half the position early can offer some protection
should the trade start to go wrong.
Check out the chart sequence in order (gbp-usd-thu-19-feb-09a, b, c).
Best Regards,
Neil
Attachments
bansir
Well-known member
- Messages
- 494
- Likes
- 42
Okay, today was different.
I had a mind to try trading a higher time frame following TD's recommendations on another thread (plotting the levels or something similar)
Anyway, just one trade today and I must admit I feel less drained than when I have executed a dozen or more.
How about the results?
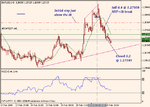
Well, I've been lucky. I took a fairly early Eur-Usd trade on a sort of DIBs meets Divergence basis. I used the RSI divergence to flag the reversal possibility. Then I shorted as the inside bar range was broken to the down side at 1.27956.
My stop was placed well above the IB candle high (red dotted line) at 1.28511 for a
risk of 555 pipettes.
The move carried through and I closed half of the position at 1.27395 for 561 pipettes.
The profits from this are already above my average day.
I left the stop where it was with the original risk of 555 pipettes.
This evening I have finally moved the stop to break even but I realise now that my planning is now lacking.
I just don't know what to do; I have 1005 pipettes on the table and it is tempting just to close the position.
I could move the stop down behind the SMA or I could close 1/4 of the trade and let the rest run. Or I could place a buy limit order just above the trend line.
I'm probably gonna regret this but I've closed the trade for 999 pipettes.
That's not bad for me, a total of 1560 pipettes from a risk of 555.
I know that I will cop for a stop out probably on my next attempt but at least I've had a taste of a higher time frame approach and I quite like it. ;-)
**Need to sort out the planning.
Here's the chart:
Attachments
bansir
Well-known member
- Messages
- 494
- Likes
- 42
This one was so simple easy. Guess I will have to look forward to a couple of tricky ones now
just to keep things even.
Poor job on the discipline front but 89 points (£125 in 25 minutes). Who needs perfection?
Or is that a bad attitude to take? I suppose as ever, the only way towards consistency is to stick to the plan.
Best Regards,
Neil
just to keep things even.
Poor job on the discipline front but 89 points (£125 in 25 minutes). Who needs perfection?
Or is that a bad attitude to take? I suppose as ever, the only way towards consistency is to stick to the plan.
Best Regards,
Neil
Attachments
bansir
Well-known member
- Messages
- 494
- Likes
- 42
Hi Folks,
I managed to finish Feb a few points up but not as good as Jan.
This is progress; I have always previously logged a very poor month after any winning month.
Today was a bit of an odd one for me, just two trades on gbp-usd. I followed my plan all the way through except for the close of the last half of my position.
I knew this morning that I would be away from the screen for most of the day so 1 min and 5 min time frames were of no use. Instead I had a look at the gbp-usd hourly with the idea of just popping back to the screen at break times if I could find a set up and entry.
At 10am I logged a potential inside bar short set up. The price had gone north at 6am but had now reversed below the 6am level leaving a pin-like candle in it's wake...a reversal day?
When the ib formed I was unable to hang around to see if it would be broken to the down side so I placed a sell stop entry at 1.41855 with a stop at 1.42363 just above the ib high
and walked away ( I found the 'walk away' bit really hard to do!)
I came back to the screen at 12:48 and saw I was well into positive pips territory.
I followed my standard procedure and closed half the position and moved the stop to BE.
I walked away from the screen again.
At 16:50 I came back to see the remaining half of my position doing extremely well and offering me a close that would take my account to new all time highs.
Now the challenge. My plan was to be patient and close as the SMA(12) was touched.
But this was a chance to get March off to a really good start and log a new high on my account.
Stick to the plan? Don't be greedy take what the market is offering? Am I really prepared to see these pips just melt away?
In the end I felt I would just want to kick myself more if I let the profits disappear than I would if the price carried on steeply south after I closed.So rightly or wrongly, I closed the remaining half.
Here's the chart:
Best Regards,
Neil
Attachments
bansir
Well-known member
- Messages
- 494
- Likes
- 42
Here's a Gbp-Usd 1min time frame trade i carried out earlier today.
It's recorded in snapshots.
First pic. is the divergence set up as it developed with trend line and S/R's drawn in.
Second pic is the plan. Basically go long on a break of S/R with a target at the upper T/L.
I don't normally use targets but this time it was just so easy to use as a peg in the ground.
Initial stop below the recent dip.
Third pic shows the entry. The dashed line is the actual fill I got, a little way north of
my desired level when i hit the order button.
Continued on next post.....
Attachments
Last edited:
bansir
Well-known member
- Messages
- 494
- Likes
- 42
Fourth pic
I close 1/2 the position as soon as I have a good profit and move the stop (red dash) up to BE.
Fith pic
The T/L is hit, I close 1/4 and move stop up a little. I'm nearly stopped out but price moves north to re-test S/R.
Sixth pic
Price breaks out, things are looking okay but I'm not excited; I've seen this all before.
Continued on next post.....
Attachments
bansir
Well-known member
- Messages
- 494
- Likes
- 42
Seventh chart
I move the stop up below the SMA and the S/R.
Eightth chart
I'm stopped out.
Results: +80 pipettes on first 1/2, +189 pipettes on 1/4 and +144 pipettes on last 1/4
You could argue I over managed it; price moved off way above my entry.
If I had left the original stop in place I could have captured good pips.
Any way, there you go. As real as I can make it.
Best Regards,
Neil
Attachments
bansir
Well-known member
- Messages
- 494
- Likes
- 42
Hi Folks,
I was unable to work the short time frames again today but saw a nice ib set up on the Eur-Usd hourly.
I went short 0.4 lots on a break of the ib low for a relatively small risk of 245 pipettes.
I then left my computer for a couple of hours. When I returned the price was way down at around 1.2500 ish.
I tried to close 0.2 lots but kept getting error messages when I hit the 'submit' button.
I would get 'common error' message mostly with the occasional 'no connection' message
also.
I restarted the PC and the MT4 application a few times but no joy. I then switched over to
a wireless direct internet connection. Same problem. Since my browsers and network connections all worked fine I decided that the problem was with FxPro server. In desperation I logged in under a different FxPro account and got connected straight away. I then logged out and logged back in using my original account and was finally able to close half the position and move the stop down.
By that time of course I had lost most of my pips; the had price re-traced.
I left the rest to run but was stopped out for 0.
I'm only demo trading but is this sort of thing usual with live accounts?
Here's the chart showing my battle to close out 0.2 lots as the yellow candle developed.
I haven't shown the BE stop out; it would clutter the chart a bit.
Best Regards,
Neil
Attachments
bansir
Well-known member
- Messages
- 494
- Likes
- 42
Hi Folks,
Just one Eur-Usd Trade on the hourly time frame today.
My entry was a bit late off the ib break but the risk was reasonable at
310 pipettes.
I made a mess of closing the first half too and was filled above the desired 1.26080
at 1.26134.
I moved my stop to BE and was stopped after a fairly strong re-trace out at 14:13.
As I type this, If I had left my stop in it's original position I would still be in the market with around 300 pipettes on the table.
Best Regards,
Neil
Attachments
trendie
Legendary member
- Messages
- 6,875
- Likes
- 1,433
great thread. interesting how, you are evolving by introducing PA type scenarios (Inside bars), when they are appropriate, which might sometimes get you into a trade a couple of bars before the indicator. 👍
just to clarify, is a pippette a 1/10th of a pip? ie, are 310 pippettes equivalent to 31full pips.
also, have you started using real money yet? if not, what parameters/circumstances would lead you to go live?
just to clarify, is a pippette a 1/10th of a pip? ie, are 310 pippettes equivalent to 31full pips.
also, have you started using real money yet? if not, what parameters/circumstances would lead you to go live?
Last edited:
bansir
Well-known member
- Messages
- 494
- Likes
- 42
great thread. interesting how, you are evolving by introducing PA type scenarios (Inside bars), when they are appropriate, which might sometimes get you into a trade a couple of bars before the indicator. 👍
just to clarify, is a pippette a 1/10th of a pip? ie, are 310 pippettes equivalent to 31full pips.
also, have you started using real money yet? if not, what parameters/circumstances would lead you to go live?
Hi Trendie,
Can confirm 1 pip=10 pipettes.
I'm looking at the possibility of going live using a micro or mini account. If I manage to achieve another positive month in March then I will have met my target of three consecutive winning months to qualify. I also need to improve my record keeping though.
I've found there are benefits to being able to switch between 1 hour / 1min / 5 min time frames. I use the slower 1 hour time frame if I'm too busy to keep an eye on the screen all the time.
I am trading less but looking for better quality set ups instead. It only takes one or two good winning trades in the month to really bump up the account if losses are kept under control.
Thanks as ever for your comments and questions.
Very Best Regards,
Neil
bansir
Well-known member
- Messages
- 494
- Likes
- 42
Lost out on this one in the end. No problem though; I just wanted to see if I actually had the discipline to not take early profits and hold a position for longer than a day.
Yesterday I almost closed in region 'A' for a profit after the counter pin formed off
the resistance level. I held on and was stopped out at 'B' this morning.
Interesting exercise though.
Yesterday I almost closed in region 'A' for a profit after the counter pin formed off
the resistance level. I held on and was stopped out at 'B' this morning.
Interesting exercise though.
Attachments
bansir
Well-known member
- Messages
- 494
- Likes
- 42
bansir
Well-known member
- Messages
- 494
- Likes
- 42
Hi Folks,
Here's my first trade today.
I took the short entry based on the RSI negative divergence plus s/r break.
I followed my usual procedure of closing half and moving the stop to break even
when in reasonable profit.
The move faded out and eventually price retraced to take out the brek even stop on the second half.
I followed up a little later with a long entry. Details to follow in next post.
Attachments
bansir
Well-known member
- Messages
- 494
- Likes
- 42
I like to trade RSI divergences and there was a nice set up or two today on Eur/Usd 1min chart.
The first chart shows the entry (dashed green line) with the stop loss placed below the pin like candle at 1.29725.
The thing is, I was going long into a day where the hourly trend was down so I wasn't expecting to climb on board an upward trend. I was therefore looking to keep stops tight and see if I could make a few pips on the re-trace.
The second chart shows encouraging price action and I closed half the position but held off on moving the stop up to BE.
I now have a low risk position; if my stop is taken out I'm out for just a few pips profit since
I closed half the position more than twice the distance of the entry from the stop.
Third chart shows that eventually I did move my stop to BE and was taken out 0 pips on that half of the trade.
This event however is in itself a very positive signal. Take a look at the RSI on the same chart; you can see that it is breaking the divergence line, flagging a possible divergence failure. In other words the down trend may be about to continue and we have a good signal for shorting.
The fourth chart shows that a short entry taken on a break of the low (where the original stop was) would have delivered some nice pips. Unfortunately I only figured this out as the move progressed.
A little later I got a chance to test the theory out, the fifth chart shows a short entry as the RSI positive divergence failed. I only closed half for profit again though and taking 0 pips on the remainder once more.
It's an interesting idea, from this maybe I can develop a reliable entry system to play divergence failures alongside straight divergence set ups.
Best Regards,
Neil
Attachments
Last edited:

