Dow 2007

You lot crack me up....all week i've been away working and yet I still managed to take 4k+ out of this frankly bloody obvious phase of the market....last week I posted enough detail on this thread and Lurkers journal for there to be no question or doubt about what would happen this week.......HELLO...like everyone should have been minted this week !....I give up..

I can only confirm that... for all those shorters out there, I'm with cv... why are you making it so hard on yourselves? I even re-iterated it 1 hour before the open of the session:

My analysis: longs, longs and more longs... European markets all higher, and DAX broke resistance, so expecting this to end near the highs. Consumer sentiment could spoil things though...
 
Come on guys...

This might sound harsh, but let this be a wake-up call (this is not directed at anyone personal and it's not meant to offend anybody)

Never - ever - rely on what you think or what you feel the market "should" do.
Trade what you see.

It was never going to reverse today... especially not after DAX broke that resistance and was already well under way in making it a trending day. You might say it's easy in hindsight, but I predicted a close near the highs (see post #1652) before the open.

I had the US indices pencilled in as a down day today (that said it's not over yet!).
Even Oscar has the S&P as a down day (he's been stopped out)...& he really is da man.

If you really want to short something, have a look at ER2, which I've been pointing out all along is much weaker and most likely has already topped (but if you want to be stubborn and keep shorting DOW go ahead...)

I think a big selloff before the close looks likely.

That's the kind of thinking that gets you in trouble...
For those interested in timing signals sell-offs hardly ever occur on Friday evenings... they either start from the open or they don't. Just have a look at each last Friday session, I mean really... how easy can it get?

It's over extended imo. But bewarned I'm short and on the losing side.

I'm not making fun of you Atilla, because there are a lot of them out there like you trying to short... but I remember two weeks ago you saying about exact the same thing. Now here we are, about 500 points up from the beginning of May...

However, this can't go on. So if 569 does get hit I'll have to stop the obsession with the DOW and move off to Gold or FX or even Oil.

It's a cliche, but it's never been more accurate... "The market can stay irrational longer than you can stay solvent. "

Atilla said:
Just added to my losing position by shorting it again. To hell with it. :devilish:
My reasoning is that this 550 area is going to be a psychotic spot for split personality traders to reconsider there position. We'll see.

And then we start to find reasons why the market should do this or that... :|
Or ego pops in and we refuse to acknowledge what the market is doing. :|
 
Last edited:
lurkerlurker said:
How has everyone else done on the Dow this week, and where do you all think it will be next week?

I don't make any predictions, but just for fun: DOW flies above 13500 and a possibility to see 13700. If I'm right, you owe me, if I'm not you probably won't remember this post anyway :)

Well we made it to 13600 this week... I guess I was close :cheesy:
 
thanks for your comments lurker, but honest, no worries on this end. this is the 4th day i trade this market, and it is on paper still. actually, the week is positive....not pip wise, but in learning. today the damage was minimal (even in paper pips). had the option to close flat or for marginal profit on a counter trend trade, but decided not to.

guess I should not scalp it and just swing it. scalping it doesnt suit my lifestyle. have a 4 year old, and the market is open when i childmind. think i can see the setups on the 4 hour chart, and just monitor the screen or set orders for best entries, set stops, and limits for exits on targets of measured moves.

the market i can day trade (and that i trade for real) is forex, but for some reason i am not comfortable swinging it.

anyway, has been a good week overall in terms of learning this new market. has got some clean price action, and relatively easy to read. have been experimenting with different timeframes, and still need to find which is best (at first glance, 4 hour charts do the trick), on the other hand, still need to see which are the best times to really spot price dictated support-resistance for swing entries.

well, goood weekend all

j
 
This might sound harsh, but let this be a wake-up call:

Never - ever - rely on what you think or what you feel the market "should" do.
Trade what you see.

It was never going to reverse today... especially not after DAX broke that resistance and was already well under way in making it a trending day. You might say it's easy in hindsight, but I predicted a close near the highs (see post #1652) before the open.


If you really want to short something, have a look at ER2, which I've been pointing out all along is much weaker and most likely has already topped (but if you want to be stubborn and keep shorting DOW go ahead...)


That's the kind of thinking that gets you in trouble...
For those interested in timing signals sell-offs hardly ever occur on Friday evenings... they either start from the open or they don't. Just have a look at each last Friday session, I mean really... how easy can it get?


I'm not making fun of you Atilla, because there are a lot of them out there like you trying to short... but I remember two weeks ago you saying about exact the same thing. Now here we are, about 500 points up from the beginning of May...


Firewalker / CV,

Yep both right can't argue against it. I can only state my reasons.

My Sunday's analysis on this thread at blog #1307 was as such.

By Wednesday I had got the timings wrong and missed out on an opportunity. I then felt I was right at the start of the week and having kicked my self for not sticking to my plan determined to see it through to the end by end of week.

However, I believe timing is out so it sort of carried on attempting to break 13500. Turned bak from 13480 twice.

I don't know I think analysis was right execution badly wrong.

I hear all your good advice and it is going in believe me. Thanking you kindly. Don't worry about being harsh it helps in fact.

Next week it's going down according to my analysis but will watch the charts. I would be interested in all your views and will change position.

Regarding other instruments, I did get the move on gold right and in a way mentally trading to re-inforce my confidence with the moves and I'm gaining. Likewise with oil. Such is life.

Once again just my thoughts and explanations on the week. Many thanks and kind regards. I can genuinely feel the support and well wishing of your strong comments wanting us - me - to succeed and I will try harder and be better next time. :eek:
 
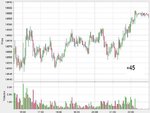
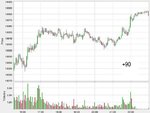
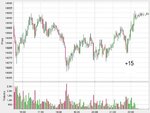
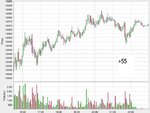
Fridays in a bull exhaustion phase

Nobody dares to hold shorts over the weekend:

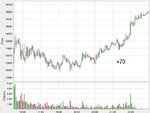
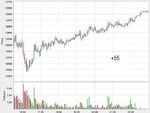
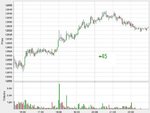
Starting with today I've gone back and uploaded each time the chart of the last day of the week and annotated the number of points the DOW changed from the opening. This does not include gaps (for example today where we were already up about +40 on the open).
 

Attachments

  • ym_20070518.jpg
    ym_20070518.jpg
    47.8 KB · Views: 156
  • ym_20070511.jpg
    ym_20070511.jpg
    42.3 KB · Views: 140
  • ym_20070504.jpg
    ym_20070504.jpg
    50 KB · Views: 131
  • ym_20070427.jpg
    ym_20070427.jpg
    51.2 KB · Views: 128
  • ym_20070420.jpg
    ym_20070420.jpg
    41.7 KB · Views: 132
  • ym_20070413.jpg
    ym_20070413.jpg
    40.9 KB · Views: 131
  • ym_20070405.jpg
    ym_20070405.jpg
    44.9 KB · Views: 140
Last edited:
Nobody dares to hold shorts over the weekend:

Starting with today I've gone back and uploaded each time the chart of the last day of the week and annotated the number of points the DOW changed from the opening. This does not include gaps (for example today where we were already up about +40 on the open).

Useful information, but I would have liked to know this 24 hours ago!

I'm going to focus on developing a trading plan which assumes we are in a bull exhaustion. I am terrified that the market will change next week and I'll be caught long on the wrong side.

Not to worry, I'll have a plan by Monday, and fear won't be an issue.

FW - you are right - I let my plan go out the window. When I get my backoffice statement I'll post the full trades, and the win / loss etc.

Going to post a full review of my performance, plus new rules / plans / method after I have thoroughly contemplated it.

Stay tuned, if I've not turned you off this thread completely by my failure to take good advice (just thinking about what CV said earlier - this is not intentional though) or to follow my own rules (which I break as soon as I realise they don't apply well).
 
I am terrified that the market will change next week and I'll be caught long on the wrong side.

If you have a plan to protect yourself, then whatever the market does (and it can do anything) you have nothing to fear. The market does its thing. Your job is merely to control yourself, to define your risk and degree of involvment. If there is a sudden collapse of this parabolic move and you are long, so what? Assuming you had a stop in the market, you were out at -10 or -20 (or whatever loss you had already defined) and waiting patiently for another opportunity. Those who are terrified and make rash decisions are the ones that pay you. It is our job to capitalise on mistakes, volatile emotions and fear. There is always another opportunity and usually a better price.

People can be made uncomfortable by the market because it presents no boundaries. You are free to trade for one minute or hours on end, once a year or several thousand times a day. Your work rate does not pay in the conventional sense. So you need a plan to set boundaries in this weird abstract unstructured environment. If your plan has a solution for anything the market throws at you and a way of defining and structuring the price action in a way that makes sense to you, trading will become peaceful and objective.

I'd advise against developing an intraday trading plan which assumes anything about the stage the market is in. It's never too high or too low and it can keep going or turn on a dime. In fact, if you are the type of day trader who likes chipping away for frequent small gains, there are almost always good longs and shorts to be had every day. A good setup will work in any type of market.

However, while it is unhealthy to assume anything about the market condition, if there is an 'obvious' longer term trend in effect* then you are can consider biasing your trades to take advantage until conditions change. But you need to define a 'change of condition' in your terms: e.g you might say that until a 30 minute bar closes below the mid point of the last three days' action the longer term up trend is intact.

Then you just have to work out what must the market needs to do to cause you to enter and exit. Let it define your trades on your terms. Live in the present. It's a joy when one truly accepts that he doesn't have to predict what the market should or will do when he can simply react to what it is doing.

Apologies for my wearing an ill-fitting guru hat again and no offence intended.

*it will be equally 'obvious' that the market was ripe for a savage three day correction, about three days after it starts. :)
But then again I am a terrible position trader, so I scalp for ticks all day long and have a delightful mousemat callous to show for it. Eeuw.
 
Last edited:
It takes courage to admit one is wrong ( especially publicly like here ) and good sense to do the right thing about it -
lots of bears have ceased posting on this thread recently and one only hopes its not because they lost too much.
 
O K guys, I was a bit strong so I apologize.......but it did prompt some very good replies , so maybe i'm forgiven huh ;)

c v
 
Hot off the press LOL

Staff at a hospital in the USA had a shock when they saw an unusual patient checking in - a black bear!
The young animal entered the building through the automatic doors and started roaming around the wards of the medical centre in Albuquerque.

Wildlife experts were called in to fire a dart filled with a special sleeping drug at the bear which then fell asleep and was taken away on a stretcher.

The young adult given a check-up then taken to nearby mountains and released


Black Bear ?

Sounds good to me...

I mean an omen to the week to come.
 
Afternoon all.

I've been trying to upload charts all afternoon, it aint happenin', so i'll get back to trading, it's a lot easier.:rolleyes:

Cash currently @ 13556.

Local support @ 13516

Can any of you guys put a chart up, say a 60 day chart or around that timeframe, with some S/R lines on it?

Reason!

Can anyone fit the Dow into a channel or wedge at the moment that tallies in with the supportive volume it's been getting?

If you look at the the last 7 sessions there's a rising wedge, other than that i can only really analyse this with measured up-moves using local support.

Any comments welcome.

Thanks.
 
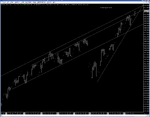
linesniffer, u can use big chart.com and for spx use interactive charts,click on draw trendlines and 1 year chart,connect 10/26/06 hi with 2/20/07 hi....next line connect 3/13/07 lo and 5/01/07 lo ..go back and uncheck draw trendlines....move cursor back to feb 07 area and hold down left click and drag to right of chart ,there is double resistance touch
 
Hi ammo.

I've seen that mate, there was quite a bit of support on the 15/05/07 taking it off the 13378 area, i was looking for support lines to justify this volume.

The wedge i've described does this, but i'm not convinced.

Anyway, thanks, be careful of selling resistance in this type of market, i've come a cropper a few times this year doing it.

Good trading.
 
CV you're a gentleman (who doesn't know his own strength) :)

LS are these any help?
 

Attachments

  • dow60.PNG
    dow60.PNG
    80.3 KB · Views: 159
  • spx.PNG
    spx.PNG
    58.5 KB · Views: 168
Thanks Frugi and CV.

Here's the strange bit...

Why can i not fit them lines onto my charts,...and they are nice lines by the way!

Sorry, yep, i can fit them lines onto the smaller timeframe but not the larger TF.

That volume i mentioned on the 15/05/07, just seems a lot for those particular parameters and situation.

Going back to the larger TF, do you think charts can have a slightly different calibration depending on the provider? My charts are cash charts by the way.

Thankyou.
 
Comparisons.

The date i have in mind is the 22-24 of Nov 06.

Take into consideration the Nasdaq and the S&P on them dates on a one year chart. The resistive trendline from those dates to the present is not broken by the Nasdaq and S&P. The Dow breaks out of this on the 02/05/07, it turns this resistance into support on the 10/05/07 (13207), this was the start of the small wedge you can see on CVs chart. It's a classis resistance channel for the Nas and S&P as from the 22-24/11/06, not for the Dow though.

Any thoughts?:idea:
 
New Dow Method

Hi all

Thanks for the support last week. CounterViolent, Frugi, FireWalker, Atilla, Dinos, fibonelli, and many others have given some good advice and been suitably frank regarding my progress. (no preference expressed, and apologies if I missed anybody out) I did say I would work on formulating a tighter system over the weekend, and work on my trading psychology also. The following is the result - it could use a little refinement, and I would appreciate comments and feedback. I've also worked my way through a good part of "Trading for a Living" and "Trading in the Zone" - interesting reads.

Instrument: DJIA (rolling cash, SB)

Strategy
At 1500, view 15 min chart. Observe MACD histogram to determine long term
trend. If trend is up, look to buy. If trend is down, look to short.

Examine the 5 minute chart to determine support and resistance levels and
confirm trend. Establish a "zone" where you would consider buying (ie around
support). Consider stop loss levels and profit targets. The zone must be
within the range of the last 2 30 min bars. Do not buy above the range of the
last hour.


Look at the 1 minute chart, which has 8 and 21 period DEMAs. If the 8 period
DEMA becomes greater than the 21 period DEMA while price is in the zone and a
long signal was given earlier, buy. Only trade if a sensible stop loss is
within 10 tics of entry. Maximum risk per trade: 10 tics. (DEMA method courtesy the excellent Dinos)

While in the trade, overlay the DEMA on 2, 3, 5, and 10 minute charts to get
successive entry confirmations. Pyramiding could be added later, but presently
would present inappropriate risk, except in the case where stop loss on the
first position was +14 (4 point spread, plus 10 point S/L on the second
position).

Every 15 mins, check long term trend on 15 min MACD. Write this down. Every 5
mins, consider possible entry zones in direction of the trend. Watch 1 min
chart for 5 min, look for DEMA crosses in direction of trend. While in a
trade, only rely on DEMA and RSI/CCI divergence as exit indicators on 1,2,3,5
minute charts (divergence must persist over 15 minutes, ideally with 3 peaks /
troughs).

Rules
No trading against the 30 min trend.
No averaging down. (goes without saying really)
Maximum risk 10 pips.
Maximum daily loss 30 pips. (should be appropriate to my account)
Use DEMA crossovers, RSI / CCI divergence on 1 minute to exit.
No new trades before 1500 or after 2030
Breakeven stoploss at +10. Trailing stoploss (50%) at 20.

Example

15 min MACD up. 5 min shows support at 14500.

DEMA crossover on 1 min. Buy at 13502. Stoploss at 13492 (below support).
Price moves to 13512. SL moved to breakeven. Price moves to 13522. SL moved to
13512. Price moves to 13514, then advances to 13525. Stoploss moved to 13514.
Price moves to 13540, then retraces to 13535. 20 minute RSI diveregence
confirmed, exit at 13530 for +28. Maximum risk 10.

I would be particularly interested on comments regarding the italicised portions. I could do with extra feedback here.

Given the choices of buy, hold, or sell, I think this system is sufficient in that it only offers 2/3 options at any given time. Experienced traders have pointed out that I do not do very well with the freedom to trade a market both ways. If I see indicators of a major reversal contradicting the 15 min MACD histogram trend, I'll cover positions and stay out. I shall not bet the farm on a short in an uptrend.

Anyone care to comment on the efficacy of such a system?
 
Top