Best Thread Correlation Trading - Basic Ideas and Strategies

I wish my rubbish morning sessions were as "bad" as yours!
Any chance you could put some little entry & exit arrows on the charts you post? It'd save the brainache lazy viewers like me have figuring them out.:confused:

I see your USDJPY divergence came good eventually, NVP. Looks like the tag's broken for a second day running.

can I have this one as well ?.......i'm working on my next 10,000 pip a day
scam letter :p


http://www.trade2win.com/boards/for...g-basic-ideas-strategies-250.html#post1088646

N
 

Attachments

  • e g trade.jpg
    e g trade.jpg
    31.2 KB · Views: 157

Attachments

  • temp.png
    temp.png
    16.6 KB · Views: 154
yep........I really must keep persuing this new trial indicator......look at the lovely market support for this move though once U/J got above the 92.....dj30 kept chuggin up (driving carry trade sells on the yen) and Gold was bearish that supported the rising USD.........luck or judgement who cares.....yen had been softerthan USD all morning since 8am so no reason for it to change tack at 92...... :smart:

1 nil !!! (y)

N

This is proper shiney cross-market correlation, isn't it? Is this something you're wrapping up into one MT indicator or is it just too complicated? I can't carry DJ futures & Gold prices in my head as well as all the forex pairs - complete cranial meltdown!
 
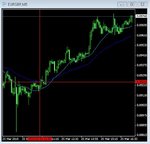
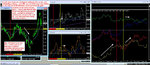
I see the problem on this pair - my chart indicates a buy but I've learned from the corrie not to trade a pair that are both the same side of zero... looks like it's about to push higher though.

GMP (and anyone else who wants to join the corrie clan)

the corrie is quite intuitive...and the more you play the better you get...

BUT

get a pot of coffee and go through the thread....:eek:...theres a lot of stuff (especially first half) that must be read.... as Ingot54 and Alan5616 push me hard playing with lots of MA / Delta settings and interpeting results

I would also recommend you settle down and really learn how to interpret Moving averages as thats what the corrie is......a giant 3D moving average machine of the G8

when currencies cross that is where the pair chart would cross the MA settings you have (try it)..........so if U crosses G on a 20/1 corrie you will see the 1ma cross the 20 ma at the same time on a G/U pair chart.............and so on if you set the MA to 20 and the delta to 10 guess what ?.....you will see the 10ma crossing the 20ma on a standard G/U chart (y) (well... within 95%+)

ZERO crosses repesent something diferent ...........this is where a currency moves above or below the G8 Average (Based on the MA/Delta setting you have)

imagine a pair chart that represented GBP against the G7 and a 20ma/1 delta on it........when the 1ma crosses the 20 MA on your chart thats shown as the GBP crossing the zero on the corrie chart set to 20/1

Then theres interpretation of the divergent/ convergent lines.....remember (just like macd's , rsi's , stocastics etc etc )......divergence lines are the strongest and always take precedence over converging lines for strength of moves

a converging line (on lower MA's) does not mean the price is moving much...it just means the MA is catching up with the price that diverged away earlier on (try it looking at a standard MA relationship to price on any chart)......

for me on lower MA's I rarely pay much attention to converging lines.....the money has to be on Divergence for entering trades.............

sure you may have to use a converging currency to pair up vs the diverging one sometimes but the real money will always be delivered from the diverger as it moves away from its MA ......

CAVEAT

I use the 1000/1 corrie a lot as you know....at this size of MA the convergence/Divergece is of minimal importance/distortion so its great to just watch pure price movement.......but on say 10-200 ma settings you cannot see the pure stuff and can instead focus on convergence/divergence plays

use them both .....different versions of the same fantastic little basic indicator......and boy does it have a great set of brother and sister hybrids you can build from it.........

experiment..............use any variation of MA/delta settings .use the great settings from the world of MA's

basics
5,20,50,200

fibs
3,5,8,13,21,34,55,89 etc etc

use the classic faster/slower combo settings as seen on macd's, Stochastics.....they are all as powerful on the corrie as on standard pair charts.......the sky really is the limit......

see why I never get time to trade yet........the more I learn the less I know ! :eek: )


anyway enough..............:smart:

N
 
Last edited:
GMP (and anyone else who wants to join the corrie clan)

the corrie is quite intuitive...and the more you play the better you get...

BUT

get a pot of coffee and go through the thread....:eek:...theres a lot of stuff (especially first half) that must be read.... as Ingot54 and Alan5616 push me hard playing with lots of MA / Delta settings and interpeting results

I would also recommend you settle down and really learn how to interpret Moving averages as thats what the corrie is......a giant 3D moving average machine of the G8

when currencies cross that is where the pair chart would cross the MA settings you have (try it)..........so if U crosses G on a 20/1 corrie you will see the 1ma cross the 20 ma at the same time on a G/U pair chart.............and so on if you set the MA to 20 and the delta to 10 guess what ?.....you will see the 10ma crossing the 20ma on a standard G/U chart (y) (well... within 95%+)

ZERO crosses repesent something diferent ...........this is where a currency moves above or below the G8 Average (Based on the MA/Delta setting you have)

imagine a pair chart that represented GBP against the G7 and a 20ma/1 delta on it........when the 1ma crosses the 20 MA on your chart thats shown as the GBP crossing the zero on the corrie chart set to 20/1

Then theres interpretation of the divergent/ convergent lines.....remember (just like macd's , rsi's , stocastics etc etc )......divergence lines are the strongest and always take precedence over converging lines for strength of moves

a converging line (on lower MA's) does not mean the price is moving much...it just means the MA is catching up with the price that diverged away earlier on (try it looking at a standard MA relationship to price on any chart)......

for me on lower MA's I rarely pay much attention to converging lines.....the money has to be on Divergence for entering trades.............

sure you may have to use a converging currency to pair up vs the diverging one sometimes but the real money will always be delivered from the diverger as it moves away from its MA ......

CAVEAT

I use the 1000/1 corrie a lot as you know....at this size of MA the convergence/Divergece is of minimal importance/distortion so its great to just watch pure price movement.......but on say 10-200 ma settings you cannot see the pure stuff and can instead focus on convergence/divergence plays

use them both .....different versions of the same fantastic little basic indicator......and boy does it have a great set of brother and sister hybrids you can build from it.........

experiment..............use any variation of MA/delta settings .use the great settings from the world of MA's

basics
5,20,50,200

fibs
3,5,8,13,21,34,55,89 etc etc

use the classic faster/slower combo settings as seen on macd's, Stochastics.....they are all as powerful on the corrie as on standard pair charts.......the sky really is the limit......

see why I never get time to trade yet........the more I learn the less I know ! :eek: )


anyway enough..............:smart:

N

...but if you're really lazy you can just use it as a handy strength comparison unit ;)
Actually, there's a proper distinction to be drawn here. Someone like me who's looking for small intraday moves of as little as 20 pips is essentially trading noise, and as such proper correlation doesn't really play a part at such small timeframes. FXCorrelator is most useful to me personally as a snapshot of the overall picture, but that's obviously not all it has to offer and my posts are probably giving a distorted picture of its application. A trend follower or a proper "investor" (as opposed to a daytrader) would probably get alot more out of it than my one-dimensional approach, so maybe I should throttle back on my posts here.
We need some trendfollowing lurkers to contribute!
 
Last edited:
This is proper shiney cross-market correlation, isn't it? Is this something you're wrapping up into one MT indicator or is it just too complicated? I can't carry DJ futures & Gold prices in my head as well as all the forex pairs - complete cranial meltdown!

Hey GMP......

you've come a hell of a long way in a short time my friend (ive been playing with srengthmeters for a long time now).....and If you had bought the following things from me already :-


  • my shiny strategies and customised systems modules
  • membersip to my training programme and corrie academy
  • my 10 DVD set
  • my weekly Webinars
  • my daily on-line trading room
  • my shiny website and Blog
    my Karen Brady book on fashion tips and looking good


then you would feel much more comfortable and organised as your journey continues towards the corrie grail.....


but you (and nobody else) has.....because they are all in my head.......

God help us all................hahahahahaha :LOL:

Neil

Seriously mate youre going fine......reduce your currencies to 4-5*** max on charts and start watching Gold vs usd for their inverse correlation.......Yen/markets can wait a while :smart:

*** drop NZD and CHF plus then decide on also Yen,CAD or AUS to drop.....depends on what you are doing...... JRP trades just EUR,GBP and USD so suspect hes dropped rest of G5 !
 
then its all about what you see........

heres overnights.....interesting

strong solid market pushes upwards above 20ma's (light blue) but look at the tag......usd is grudgingly fallng now and Yen is now rising (??)

to me this signals the tag want to go north and will do so even more if markets hesitate which they will at some point

then Watch the G6 for opportunities to sell when this opportunity arises

you could theoretically buy yen now as its already going north.......and stonger bias than USD by far ( Yen yesterday weak v USD...today strong ?)

Eurozone are the whipping boys.......take your pick , depends on news releases today as well

good luck all
N
 

Attachments

  • 26th.jpg
    26th.jpg
    141.2 KB · Views: 151
ummm bugger all then !

so just trade what you see all and good luck....

i'm stupidly busy today so will conribute when I can


N
 

Attachments

  • calender.jpg
    calender.jpg
    32.4 KB · Views: 152
needless to say I like selling U/J now .....when the markets fall (especially if DJ30 faster/before Gold) pile in in selling U/J as long as Dow30 is falling faster than Gold

dont go blind though.....use the pair chart and i would suspect a little retrace would be on the cards before the bg fall comes

92.37 is a key breach

N
 
...but if you're really lazy you can just use it as a handy strength comparison unit ;)
Actually, there's a proper distinction to be drawn here. Someone like me who's looking for small intraday moves of as little as 20 pips is essentially trading noise, and as such proper correlation doesn't really play a part at such small timeframes. FXCorrelator is most useful to me personally as a snapshot of the overall picture, but that's obviously not all it has to offer and my posts are probably giving a distorted picture of its application. A trend follower or a proper "investor" (as opposed to a daytrader) would probably get alot more out of it than my one-dimensional approach, so maybe I should throttle back on my posts here.
We need some trendfollowing lurkers to contribute!

mate - post what you want............we're all here to learn and posting here means you will think more about what you are saying and doing re trading

(no pressure then) :rolleyes:
N
 
Heres Boris from BK Forex......interesting

most Daytraders I have corresponded with over the years generally agree the 3 swings and your our rule for a days action.....that would more probably cost a max 6% on a day (3 X 2%) if I also incorporate most peoples 2% risk per trade rules I see...interestign that boris has a % drawdown ruling that naturally incorporates the running total for a day based on x trades)

also Boris talks about differing lot sizes based on his confidence level in trade.....hmmm......i've seen this approach before in some systems that even "grade" the trades from higher to lower probs.... :rolleyes:..........to me you are then really taking your system far toooo seriously - and why would you take a lower probability trade in the first place (??) - signals are signals......still what do I know as an armchair trader !


A System For Success

Last week I wrote, "Each day I attempt to ask and answer only two questions -What's Happening? And How Will It Affect Price? Get that answer right and you'll be on your way to being a successful short term trader."

That's only partially true.

Short term trading is never only about analytics. It is also about systemic risk control. Your analytics can change from day to day, moment to moment. In fact flexibility and open mindedness are the key attributes of all skillful short term traders. However when it comes to risk control your system must be well thought out and rigid as a column of steel. You can experiment all you want with your trading setups, but deviate from your risk control rules and you will always pay a heavy price. It doesn't matter if you run a 500 dollar retail FX account or 5 Billion dollar hedge fund like LTCM. Ignore the rules and the market will smite you.

Although everyone has a different tolerance for risk, here are my day to day rules.

1. Leverage
In trading there are two ways to generate leverage. You can use high margin or you can have a high turnover. I prefer the later. I don't trade with more than 10:1 margin and generally keep my ratio to 5:1. That means that for every $10,000 in my account I will not hold more than a 100,000 unit position at any given time. My goal is not to "press the pedal to the metal" on every trade but rather to make money one pip at time. My plan is take many trades throughout the day and average 20 pips/day or 100 pips/week. If I can do that consistently that means I am generating $25,000 of profit per year for every $10,000 of capital at risk. That would be pretty damn good.

2. Stops
I trade with fixed stops of 20 pips - regardless of whether I am trading yen, pound or any other pair. I know this ignores the whole issue of volatility but I don't care. It simplifies my trading enormously. I trade with fixed stops of 20 and fixed take profits of 20. During a typical day when I am busy with a million things this system has saved my hide more than once. I NEVER WIDEN MY STOPS, but I may bust out of the trade early if I don't believe it has the power to reach my target. Over a long period of time and after doing thousands trades I learned that 20 points is the perfect amount of risk for me. If I get stopped at -20 it's because I am dead wrong in my analytics or my timing.

3. Position sizing
Again I opt for simplicity. I generally open with 1 unit (so if I had 20K in my account my opening trade would always be 100,000 units) but if I am extremely confident in the trade I will double my bet and trade with two units from the start. That's the maximum position sizing I allow myself. I never add to a losing position but I will double my bet to two units if I get stopped out and I am confident that the trade should work and I was just early. If I get stopped on 2 units I step back and bring my size back to one because I am clearly wrong on the trade.

4. Day Limits
Generally I never reach them, but if I am down 5% on my equity (-$500 on 10K account) I stop trading for the day. There are a million factors that could be responsible for such a drawdown but the single most important action at that time is not to try to figure them out, or to try to get the money back, but to simply STOP TRADING. This is the most common reason why most short term traders blow up their account. When it come s to trading the Hippocratic oath is a pretty good rule to follow - "first, do no harm".
 
Last edited:
mate - post what you want............we're all here to learn and posting here means you will think more about what you are saying and doing re trading

(no pressure then) :rolleyes:
N

The thing is, I've been rather ignoring the fact that the title of the thread is "Correlation Trading" - my trades have nothing to do with market correlation, I'm just using FXCorrelator as a useful at-a-glance way of spotting potential pairs to examine for a possible trade. It saves me cycling through a dozen charts every 15 minutes, but it doesn't actually affect whether I enter a trade or not.
Followers of the thread are presumably far more interested in learning correlation strategies than watching off-topic trading decisions.

Hi GMP

fair point......still pitch in anytime you want re questions on the corrie then (y)

regards
Neil
 
Hi N & G + all else,

That N & G salutation reads like a UK building society's name - perhaps you two are the waiting in wings mysterious buyers of collapsed Northern Rock!

GU; Fell straight into the bull trap by entering long on open 08:05 bar and promptly got SL hit by tail of 08:15 bar for a 21 pip loss. Second trade buy stop at 48468 filled during 09:20 bar and (of course!) price went gently down for four bars, flattened out and rose up beyond initial entry point, dropped down again for two bars then 10:10 bar came to rescue and propelled price northwards making new 10:20 local high which couldnt be held and at end of 10:35 bar TS was taken out for 20 pip profit. Price looked to be stuck in a fairly volatile range after that so left the pair alone.

EU; First trade entered long at 33602 (took some slippage there) on open 08:05 bar, price jumped up then settled down again, drifted for three bars, rose slowly up to new 08:50 local high, paused then rolled over with 09:50 bar taking out TS for 3 pip profit. Second trade buy stop at 33837 just hit by wick of 10:00 bar, price crawled sideways for two bars, popped up to make new local high then ran out of steam and retraced down, flatened out again then 11:00 bar woke things up and price moved upwards to make 11:10 new local high, retraced with higher low for two bars, rose up again to challenge local high, then rolled over with more momentum and trade exited on close of 11:55 bar (time ran out) for 3 pip profit.

EG; Had to wait until 10:15 bar for first trade, entered short on close of this at 89964 price moved back up slightly then dropped back below initial entry to 10:45 new local low, then it reversed and trundled back up the hill to take out adjusted SL by wick of 11:10 bar for 11 pip loss. Second trade entered long at 90112 on open 11:20 bar, price moved up a few pips, paused with small retrace then moved up past entry point and keeled over so trade exited on 11:55 bar close for 9 pip loss.

A real pigging morning to end this week on, I just couldnt seem to get any rythmn going at all on those trades and got chopped around in the process. Trade well and regards,

Simon.
 

Attachments

  • gu260310.gif
    gu260310.gif
    17.1 KB · Views: 126
  • eu260310.gif
    eu260310.gif
    16.1 KB · Views: 89
  • eg260310.gif
    eg260310.gif
    15.7 KB · Views: 116
The thing is, I've been rather ignoring the fact that the title of the thread is "Correlation Trading" - my trades have nothing to do with market correlation, I'm just using FXCorrelator as a useful at-a-glance way of spotting potential pairs to examine for a possible trade. It saves me cycling through a dozen charts every 15 minutes, but it doesn't actually affect whether I enter a trade or not.
Followers of the thread are presumably far more interested in learning correlation strategies than watching off-topic trading decisions.

Hi Gavin,

I mentioned same thing to NVP quite a few weeks back as really, in the main, its only EG trades that are corrie indy based in part of the decision process for me - N's reply? Keep on posting....

BTW; Hope today's charts with those virtually uncontrollable mt4 arrow thingies were a bit more clearer for you - you can see where I lost all that blood!

Simon.
 
needless to say I like selling U/J now .....when the markets fall (especially if DJ30 faster/before Gold) pile in in selling U/J as long as Dow30 is falling faster than Gold

dont go blind though.....use the pair chart and i would suspect a little retrace would be on the cards before the bg fall comes

92.37 is a key breach

N

Hi all

just a quick revisit of this U/J earlier.............there was a retrace as you can see below ......then a nice push down to the Breach level I was hoping for (but it didnt breach !!!).....read your price action manuals as this is a classic resistance level that would not allow the pass....such is life

i'm on a steep learning curve on this pair........for as long as it takes :smart:

N
 

Attachments

  • U  J training trades .jpg
    U J training trades .jpg
    144.9 KB · Views: 137
Hi N & G + all else,

GU; Fell straight into the bull trap by entering long on open 08:05 bar and promptly got SL hit by tail of 08:15 bar for a 21 pip loss. Second trade buy stop at 48468 filled during 09:20 bar - 10:35 bar TS was taken out for 20 pip profit. Price looked to be stuck in a fairly volatile range after that so left the pair alone.

EU; First trade entered long at 33602 (took some slippage there) on open 08:05 bar, with 09:50 bar taking out TS for 3 pip profit. Second trade buy stop at 33837 just hit by wick of 10:00 bar, and trade exited on close of 11:55 bar (time ran out) for 3 pip profit.

EG; Had to wait until 10:15 bar for first trade, entered short on close of this at 89964 to take out adjusted SL by wick of 11:10 bar for 11 pip loss. Second trade entered long at 90112 on open 11:20 bar,trade exited on 11:55 bar close for 9 pip loss.
A real pigging morning to end this week on, I just couldnt seem to get any rythmn going at all on those trades and got chopped around in the process. Trade well and regards,

Simon.

messy morning Simon...........in truth USD has been as flat as a pancake so you are relying on the volatility of the other currency to make the money.....(nononono :rolleyes:)....and the Euro pair have walked the same path since just before 9am......yuck !

Take a picture all as you rarely see that much claret on JRP's results.......and even then its just 15 pips or so.....thats less than a stop-loss for most....

N
 
Last edited:
hi all

I like selling u/J again.....look for sells down to 92.30....watch that bump on way down

N
 
Top