You are using an out of date browser. It may not display this or other websites correctly.
You should upgrade or use an alternative browser.
You should upgrade or use an alternative browser.
Frankly I am not good at posting real time
while trying to manage a position
So here it is for what its worth
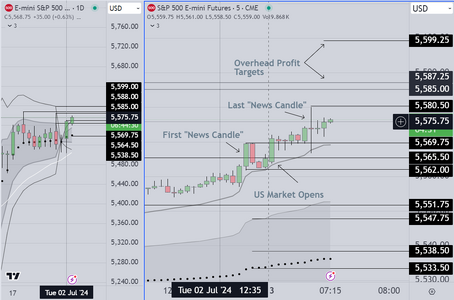
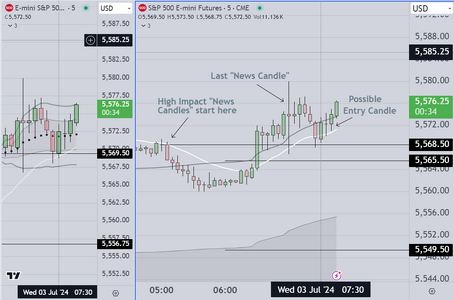
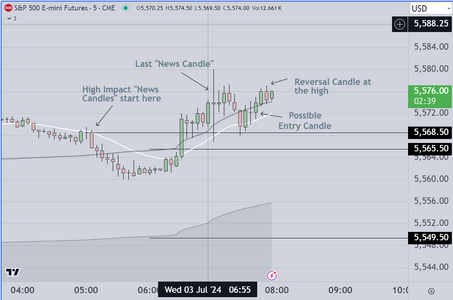
The entry candle is called "possible" because it
could have triggered either long or short
One should also remember that context is key
1) This is a holiday, so staying in a position is more
risky. One should assume that today is a scalp day
2) There for I would be prior to a test of the high or low
where automated software is likely to reverse the market
while trying to manage a position
So here it is for what its worth
The entry candle is called "possible" because it
could have triggered either long or short
One should also remember that context is key
1) This is a holiday, so staying in a position is more
risky. One should assume that today is a scalp day
2) There for I would be prior to a test of the high or low
where automated software is likely to reverse the market
Attachments
I have just finished a training session.
I have been using a Weekly VWAP envelope with excellent success
In addition to the envelope, I also show traders how to incorporate
Volume Profile POC (to obtain a directional skew).
Some of this is obvious for example when price is below the VWAP
odds favor short trades, Price action above the VWAP suggests
long trades have the edge. Using the VP/VWAP combo allows
the trader to obtain a significant statistical edge
The trade setups shown in this example are
of two (2) types
1) Breakout-Retest-Continuation Entry
2) 1-2-3 (Multiple Tests of a Key Reference)
The hit rate is high (if the rules are followed) and the price
action is persistent
These setups tend to occur in the middle of the week and
are easy to anticipate in the context of pending economic news
Attachments
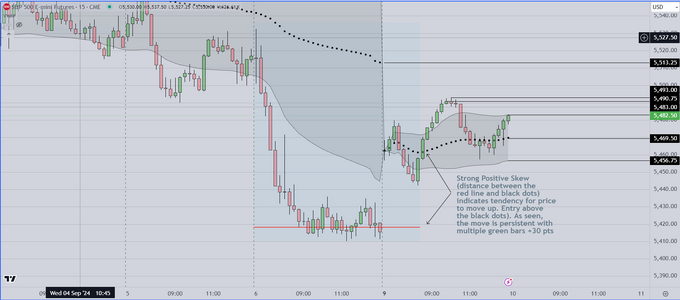
And here is an example of a long entry based on positive skew (and price action)
The trick to this is to learn where to anchor the VP/POC (Red Line) and unfortunately
in order to learn this, you would have to see me advance the VP/POC one bar at a time
Its not possible in this format.
What you can see is that at some point, the skew (the space between the red line and
the black dots) becomes positive AND the price action moves above the dots, which
signals a long. As seen in the example, the skew is strong and the resulting move is
persistent, about 30 pts.
In my classes I teach traders the underlying statistics that backup the system logic,
how to decide where the anchor the VP/POC and how to interpret the price action
in order to find the best entry. Management of the trade, including where to put
your stop is also important. Most professionals know at least some of the basics
and so this proceeds quickly
Attachments
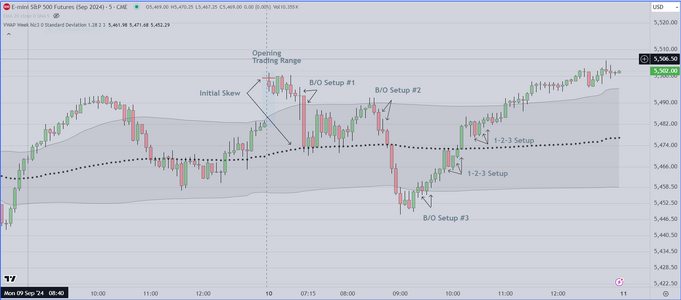
To facilitate my classes I am marking up each day's chart
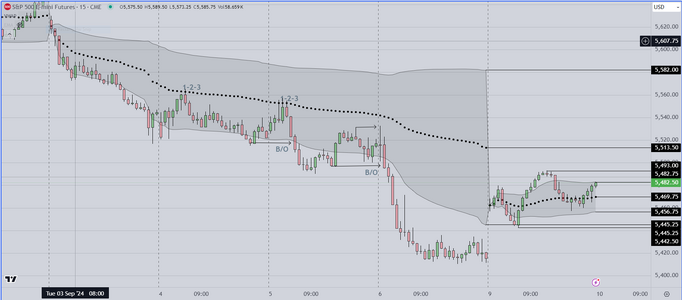
Today's Markup is relatively simple as follows
1) We start with a negative initial skew as shown by the distance between the red line
(the VP/POC) and the Black Dots (Weekly VWAP). Because the red line is (far) above the
VWAP, the statistical skew is significant, which means that the tendency for price to move
toward the VWAP is strong.
2) For the first 30 minutes, price moved in a tight range (trading range) then it broke to
the downside as suggested by the initial skew. This "breakout" (B/O) is my preferred setup
and has the highest hit rate. It is characterized by a break up or down past a key reference
followed by a retrace, with entry at the open of the next bar. In this case it resulted in a
nearly 20 pt win as price touched the VWAP (black dots).
3) As seen in this chart, markets often stall out as the big institutions decide which way to go
and during this process they "stage inventory" moving price to test or retest the edges of the
VWAP envelope. From this point we see another B/O entry. This entry (also a high hit rate)
can be held for a swing to the opposite edge of the VWAP envelope.
4) Unfortunately it is impossible to show the red line (VP/POC) advancing bar by bar, but if
I could, you would see that its changing position signals each swing. Using these tools
and with sufficient screen time, I am now able to see right away when I am wrong, which
allows me to minimize losses, and when I am right, I am able to get "in" the trade early
and thus maximize profit by holding longer.
Attachments
Last edited:
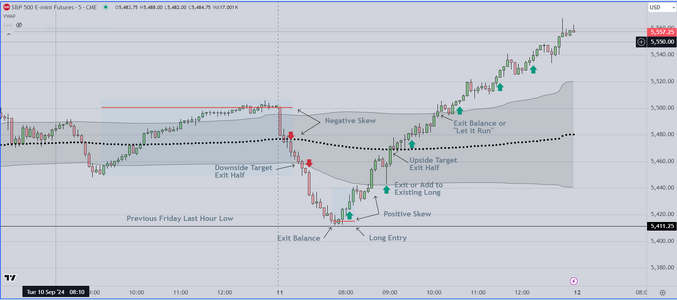
Hello Everyone
Here is the Markup for 11 Sept 2024
I am experimenting with different ways to indicate entry (Green/Red Arrows)
and trying to show how I use the VP/POC (Red Line) to create directional skew.
As mentioned previously, ideally a person following in real time would see
the position of the Red Line "jump" from above to below the VWAP (Black
Dots). This sudden change always indicates a strong tendency for price
to move up or down, creating high percentage entries that (as you see
below) result in big swings (of at least 10 pts).
Although I do not work with retail traders often, when I do, it is gratifying to
see how the light goes on in their minds, as they see (in real time) how the
skew develops, and then within a couple of bars, price starts to move strongly
up or down. Once they see it a couple of times, it seems to give them the
confidence they need to enter the market and (more importantly) to hold a
position long enough to obtain a significant profit.
If I may suggest, the real problem for retail (amateurs) is that they don't have
a system that inspires confidence. As a result they hesitate, they get in late
and they "trade for ticks" instead of for 3,5,7 or even 10 points. The bottom line
is that they might have a couple of winners (for ticks) followed by one big loser
that gives back everything they have won and more.
Good luck
Attachments
Last edited:
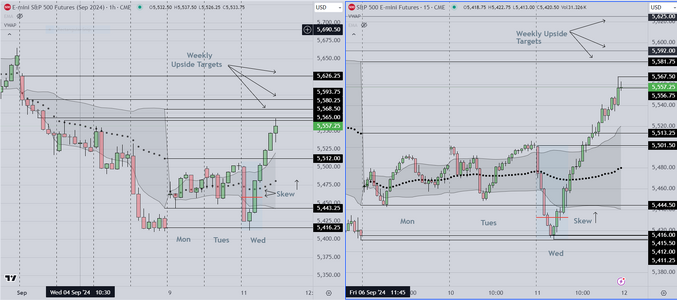
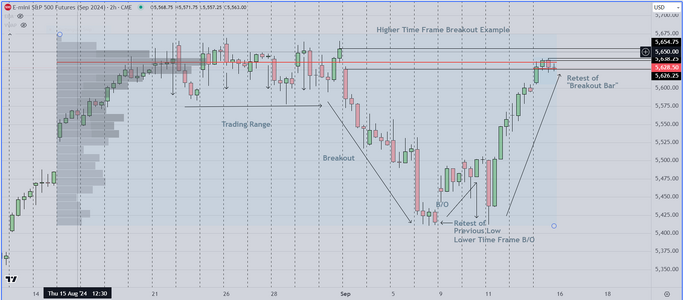
Attached below is an example of an hourly & 15 Min "Markup"
(hourly candles on the left side, 15 min candles on the right).
This is part of the method I teach commercial traders, and it allows them
to identify important patterns in each session's price action. Notice
how the patterns of the first couple of days seem to repeat. This is
known as "trading range" action. It is important because once you see
and identify it, you can decide whether to trade it, or to stand aside and
wait for price to trend (a much more profitable trade for retail traders
to take). Why is this so important for retail traders? Because without this
knowledge, struggling traders tend to get into unproductive early trades,
that are mostly losers. Then they have to spend the rest of the day
trying to "catch up".
Attachments
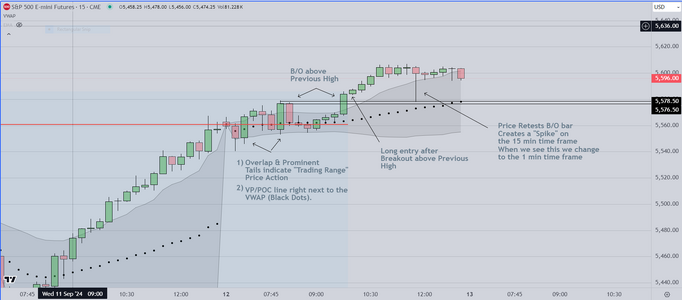
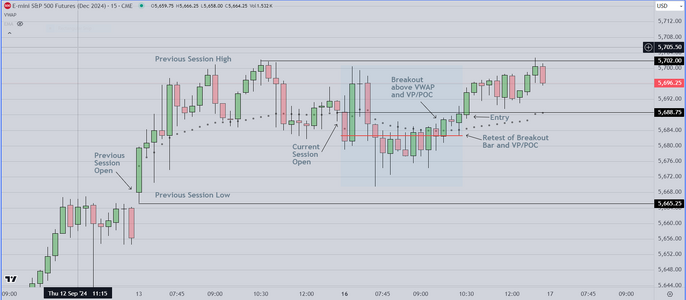
Markup for 9-12-2024
As mentioned previously, we are experimenting with various ways of "Marking Up" a session chart
The primary points to make are as follows
1) We begin by characterizing the previous price action. Why? Because price action is cyclical
Skilled traders can anticipate (with good accuracy) the next session's price action, and confirm it
within the first half hour of the new session.
2) We anchor the VP/POC and extend it to the right to obtain the "Statistical Skew", which is predictive
of future price action. Decisions to enter based on skilled evaluation of skew create an edge that is measurable
and if often an improvement over what a retail trader can obtain using standard indicators.
3) Based on previous price action we suggest that retail traders stand aside if the price action is "Trading Range"
and wait patiently for price to trend above or below the "Range". We also suggest that retail traders NOT trade
"for ticks", but try to hold for 3 -5 pts.
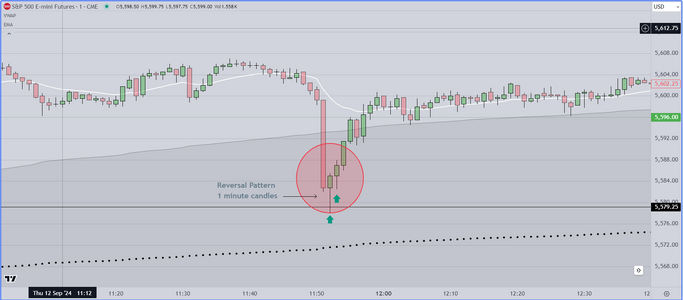
Today's "Tip"
It is often the case that price will retest a "breakout bar", creating a "spike" on a 5 or 15 minute candle time frame
when that happens, simply move to a 1 min time frame and you will see a reversal pattern that can be used to
get on board (with the trend). This can add significantly to a profitable day.
As mentioned previously, we are experimenting with various ways of "Marking Up" a session chart
The primary points to make are as follows
1) We begin by characterizing the previous price action. Why? Because price action is cyclical
Skilled traders can anticipate (with good accuracy) the next session's price action, and confirm it
within the first half hour of the new session.
2) We anchor the VP/POC and extend it to the right to obtain the "Statistical Skew", which is predictive
of future price action. Decisions to enter based on skilled evaluation of skew create an edge that is measurable
and if often an improvement over what a retail trader can obtain using standard indicators.
3) Based on previous price action we suggest that retail traders stand aside if the price action is "Trading Range"
and wait patiently for price to trend above or below the "Range". We also suggest that retail traders NOT trade
"for ticks", but try to hold for 3 -5 pts.
Today's "Tip"
It is often the case that price will retest a "breakout bar", creating a "spike" on a 5 or 15 minute candle time frame
when that happens, simply move to a 1 min time frame and you will see a reversal pattern that can be used to
get on board (with the trend). This can add significantly to a profitable day.
Attachments
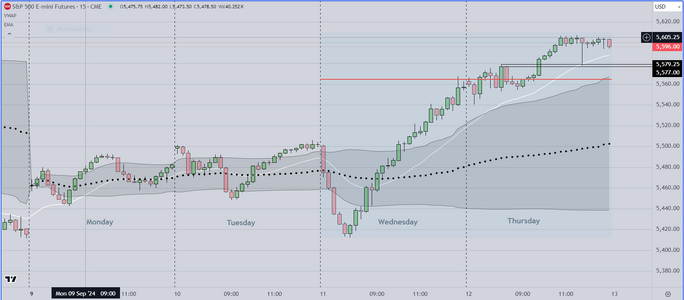
Finally
We attach a chart showing the Weekly VWAP envelope
This is something that we have used for years and it has
proven itself over that period of time as a reliable way
of framing price action.
Notice that volatility is lowest on Monday & Tuesday
and is increasing as price continues to trend. Trend can
be characterized (accurately) by the candles forming
above the envelope (and the 20ema). This allows
the skilled trader to hold winners longer.
Attachments
Last edited:
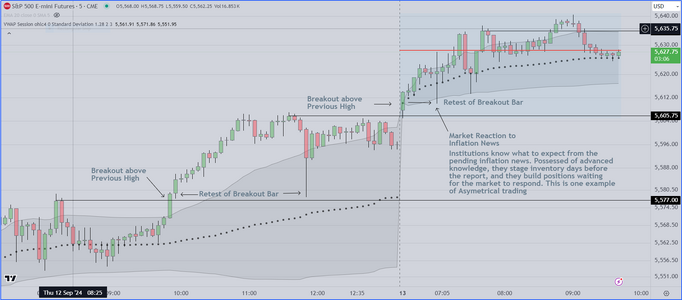
I am done for the day and will post this chart to illustrate a technique
that has been profitable for many years
Breakout-Retest of the breakout bar
This one technique allows me to make a profit and get out
with very small risk and is therefore "Asymmetrical". When I was
taught this technique, I wanted to trade size immediately, however
the person who taught me cautioned that "nothing works all the time"
and to learn to build a position over several days (as he often did).
Now I use this on several time frames, trading around existing positions
and it is the basis of my system
It will be interesting to see if anyone recognizes its potential
* I edited my chart to provide a bit more context
Attachments
Last edited:
The attached chart shows an example of a Breakout (from a Trading Range) down, followed
by a minor breakout and (again) a pullback to retest the low.
A strong (Wide Range) bar up starts the reversal back up to retest the origin of the move
This is common price action and is meant to educate struggling traders, many of whom are
still using traditional indicators.
This pattern, which is current, shows a possible "Major Trend Reversal" at the top.
The red line (VP/POC) suggests that the statistical skew was "symmetrical" while price
was moving in a trading range, followed by a move down as institutions create a profit
opportunity. At the bottom, price gaps up, retraces back down (a minor B/O) the reverses
back up to the original trading range .
These types of patterns are very common. Once a trader "knows" the logic, the rest is about
identifying entries and determining stops (if they are to be used at all).
Attachments
Here is the chart for today 9/16 for trading the US open at 6:30 am local time
I have simplified the chart, so that retail traders can learn the (breakout) setup
and (hopefully) start to make money sooner.
The black dotted line is the VWAP. This is the weighted average of all the volume
from the open to the present candle.
The red line is the VP (Volume Profile/POC) and the distance from this red line
to the Dotted Black line is the "Skew". If the red line is below the Dotted Black
line, it means that when price is at the line, it will tend to move up. If the red line
is above the Dotted Black line, it means that when price is at the red line, the
tendency is for price to move down. Its that simple, you only have to know two (2)
things to know the probable direction of price.
"Context" is everything else, from the previous session to whatever happens from the open
until a setup occurs. The setup is a simple breakout, followed by a retest of the breakout
bar. Once the breakout bar is retested, entry is next (in the direction of the skew).
We advise retail (amateurs) to wait patiently for price to breakout, because if they don't
it is likely that they will enter trades with less of an edge, and find that they spend the
rest of the day trying to get back to break even. IF instead they will just wait patiently
for the breakout and setup, odds favor a significant winner.
In the instance seen on this chart, waiting for the setup resulted in a 9 point win
Today was an experiment. There were three (3) retail traders in the room and one (1)
friend who trades his own account and has skills. We spent about an hour explaining
the basics and going over chart examples. As you can imagine, there were many questions.
This system (only one setup) is as simple as it gets. If a retail trader can't make this work
they probably should not be trading.
Attachments
Last edited:
Today's chart markup
We reached our profit target early today as did most of the
class. The chart is self explanatory.
A couple of critical notes however as follows
Students watching the open asked why we did not take long
trades today (the initial skew was to the upside). We replied
that this decision was made with benefit of experience. Specifically
we know that an interest rate cut is pending (and is probably 100% certain)
if we know that, you can be sure that the big institutions who control the
market also know it. The logic they employ is very different than what a
(small) commercial trader uses. In this instance, they take the opportunity
to sell the market down to a price where they can stage (purchase) inventory
at a discount to fair value. They will purchase as much as they can without moving
the market, and when the rate cut is announced, they will sell "into" the resulting
move back up to new highs. And yes at the new high, they will sell that inventory
and take even more profit.
There are three choices (long, short, or stand aside). I chose to wait for the down move
as the skew shifted to the short side. Once I met my profit target I chose to stand aside
As regards the "big picture" time will tell, whether I am right or wrong
Attachments
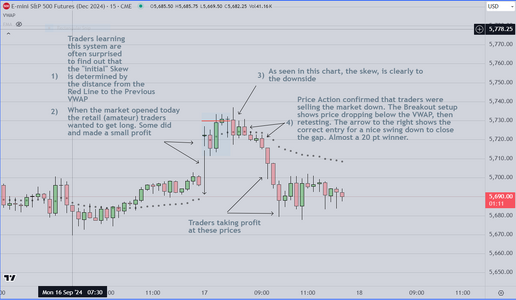
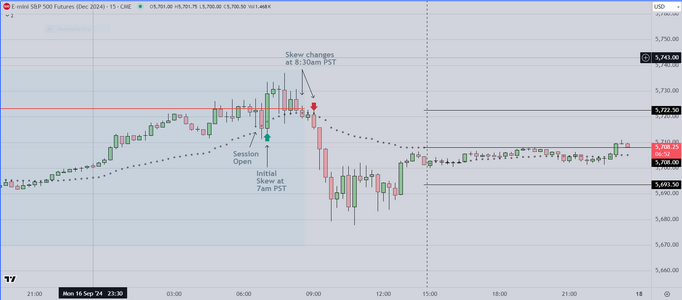
One of the attendees yesterday, seemed to have problems identifying the
change in skew (from up to down). I suggested that they try using an RTH
chart to see if that might help
Here is an example for those who might find it easier to manage
As you can see, the initial skew was up at 7am, and so some of the attendees
were able to take profit on that candle
After that however, the skew reversed abruptly at 8:30am (as seen on the chart below)
Traders who recognized the change, were able to get short as price broke out
to the downside. That setup (breakout-retest-entry) is my primary trading tool
and it is the only setup necessary for retail traders who want to actually make a
living in this profession.
As mentioned previously, it is critical to learn to anticipate days like this one.
The logic isn't a secret, and can be learned if one wants to put some effort
into it.
Attachments
Last edited:
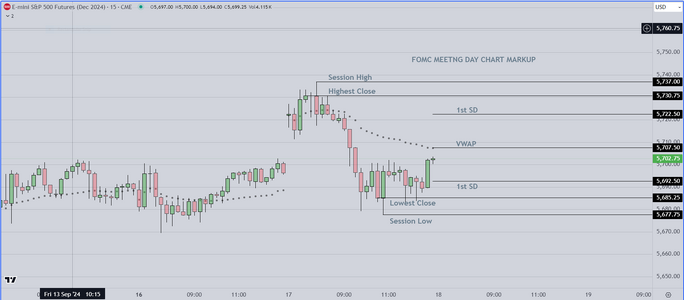
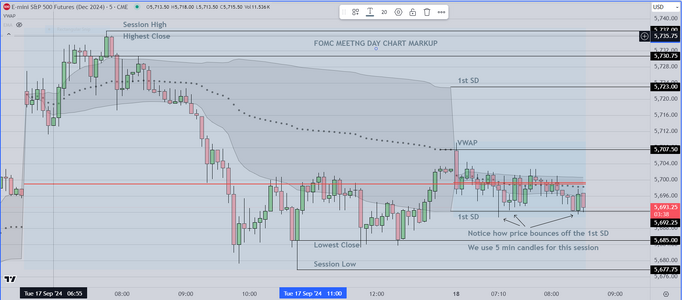
Most traders (certainly retail or amateurs) should not be trading today
As seen in the chart below, the Price action is "TR" (trading range) with lots of overlap
and prominent tails.
Aggressive pros will take the opposite side of the moves from inside the VWAP to test the
1st Standard Deviation Line. They know that the computers are programmed to enter at those
prices and to scale in lower if necessary.
There have been three (3) reasonable trades so far, scalping only of course and then standing
aside until the announcement
My marked up chart shows the entries. I am probably done for the day however I continue to monitor
and comment.
Attachments
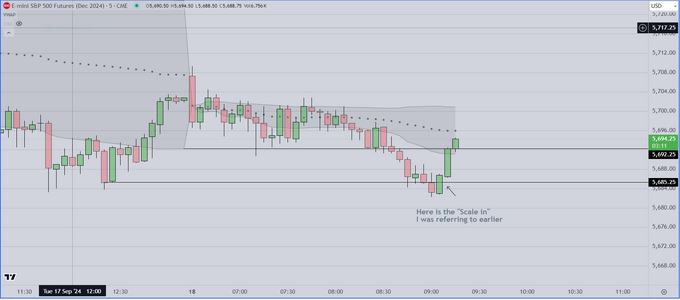
My last post for this session. I have cleaned up my chart, removing all markup lines
Also please notice that the "scale in" I referred to in the previous post has occurred
For those who have an interest in learning more about the importance of
pattern recognition, take a look at the price pattern for July 30 & July 31st, the previous
FOMC sessions. You will see that they are similar
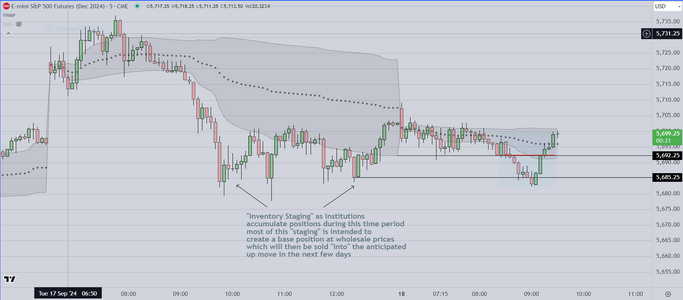
And finally, a second chart showing how institutions create base positions by "staging"
meaning, they sell the market down to an area where they can obtain inventory at what
they believe will be "wholesale" prices. They wait for the anticipated event to take price
back up, and "sell into" the anticipated rally. They also operate in the options market
in this case selling puts which will expire worthless. Over the next few days we will see
if that forecast is correct.
Good luck
Also please notice that the "scale in" I referred to in the previous post has occurred
For those who have an interest in learning more about the importance of
pattern recognition, take a look at the price pattern for July 30 & July 31st, the previous
FOMC sessions. You will see that they are similar
And finally, a second chart showing how institutions create base positions by "staging"
meaning, they sell the market down to an area where they can obtain inventory at what
they believe will be "wholesale" prices. They wait for the anticipated event to take price
back up, and "sell into" the anticipated rally. They also operate in the options market
in this case selling puts which will expire worthless. Over the next few days we will see
if that forecast is correct.
Good luck
Attachments
Last edited:
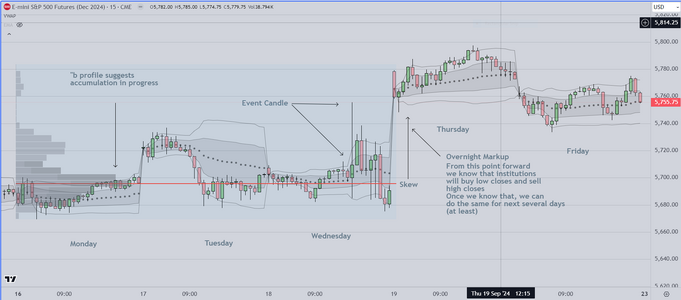
Posting a chart showing the previous week
I can talk about it in much greater detail if there is
interest (and readers decide to engage).
In my opinion, creating this chart (adding more information
day by day) allows me to obtain a significant edge. This last
week for example, I was able to determine that institutions
were accumulating contracts, anticipating an FOMC interest
rate cut. Once I make a decision, I look for confirmation based
on how participants act at high and low closes.
Attachments
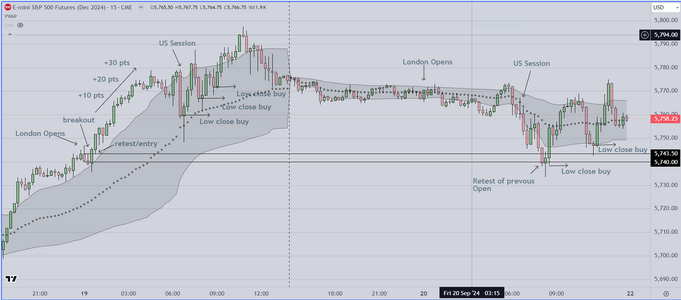
and here is a chart showing price action post the rate cut
As you see, institutions come in to buy the London Open
Once you see that, skilled traders will buy each low close
and they will continue to do that until it doesn't work
The next day we see an interesting pattern, where buyers
come in at a retest of the previous London Open. As before
skilled traders will continue to buy each low close
Finally, readers should know that this type of analysis works
for all markets (including FTSE and DAX)
Attachments
Last edited: