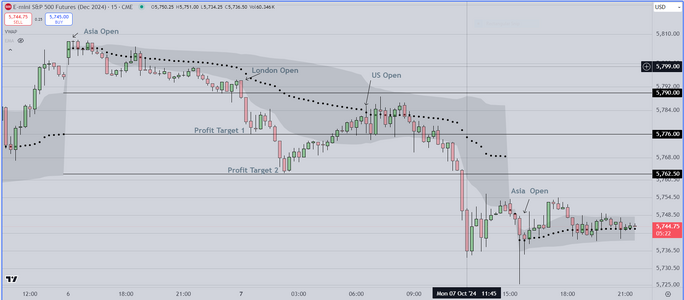
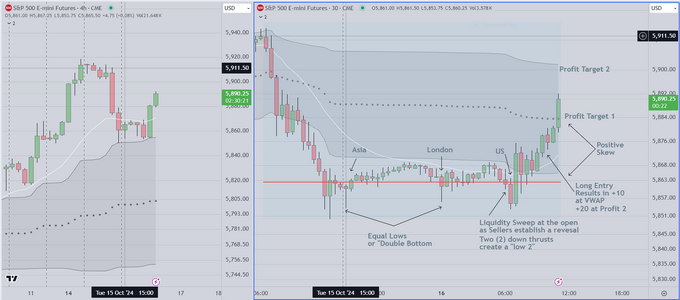
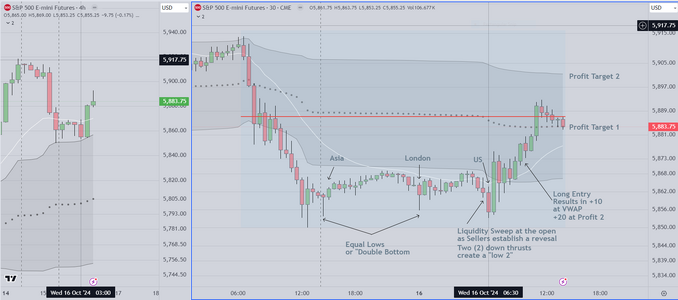
Chart Markup for Friday 10-4
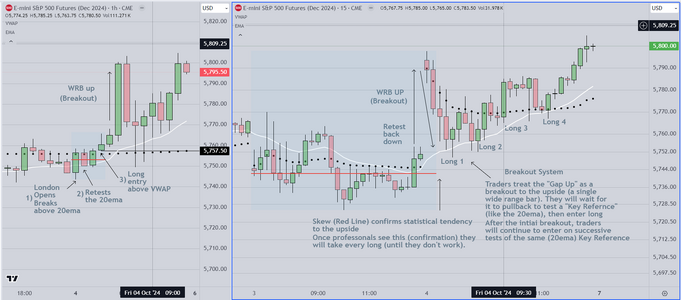
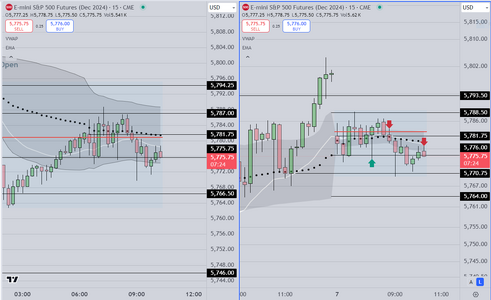
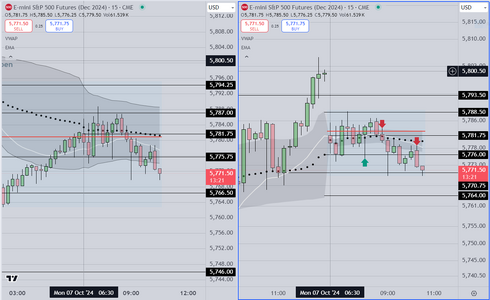
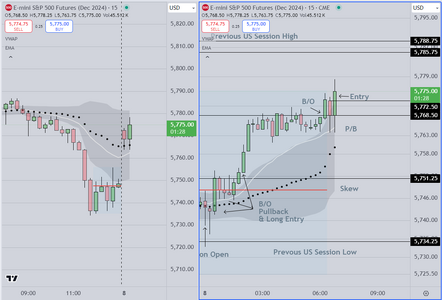
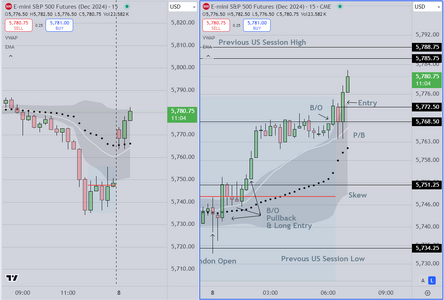
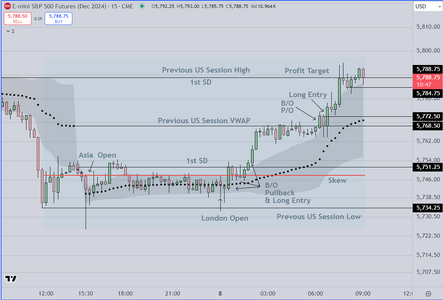
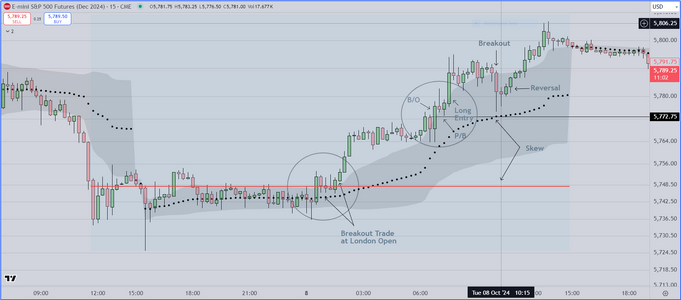
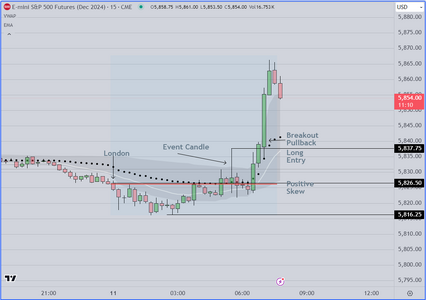
ETH Markup (Left Side)
Left side shows hourly candles and ETH time frame
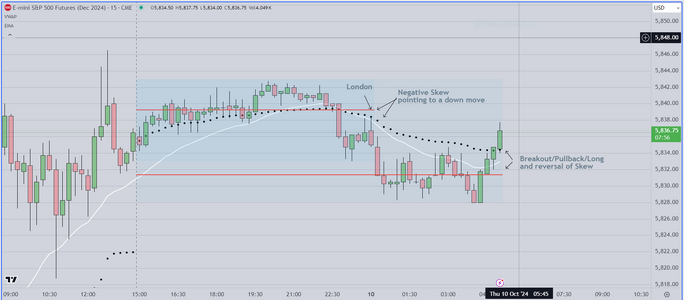
As can be seen plainly, the skew (red line relative to the
VWAP) is to the upside. Evaluation starts at London Open.
Price trends up, retests back down to the 20ema, then breaks
back up past the VWAP. Long entry at 2am PST US time would
have resulted in a significant winner
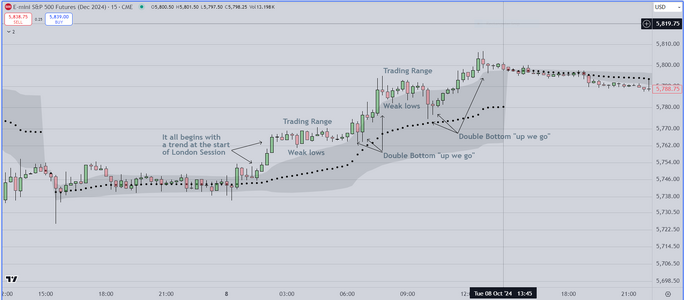
RTH Markup (Right Side)
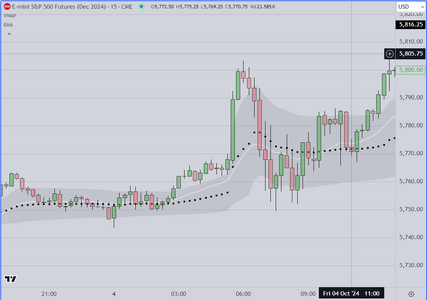
On the right side, 15 min candles. Same premise, during ETH price
gaps up. Traders interpret this as a single wide range bar (WRB)
They wait for a pullback to retest the 20 ema, and then buy every
retest. This pattern (repetitive tests of the 20ema) occurs about 20%
of the time, once traders identify it, they will continue to trade it from the long
side, until it fails. On this occasion it was successful to the end of
the session.
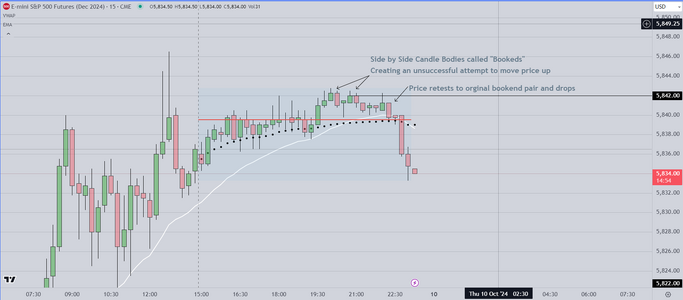
Final Note
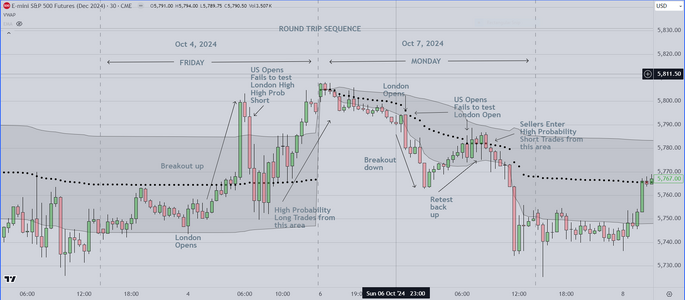
The objective is to develop a system whose statistics can be known and
traded reliably. Today's price action was unusual. It is more common for
breakout setups to fail (about 75% failure rate is common) and so we
look first for the short side. If as seen on today's chart, we see a trend
from the first pullback, AND the skew is in agreement, traders will assume
that this may be a trend day (only about 20% of days consistently trend)
They will monitor the first trade, then continue to take longs until they
fail.
Attachments
Last edited:

