Beyond Price Action

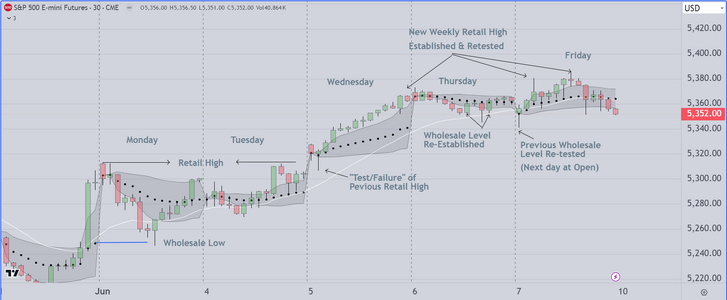
Here is the Weekly Markup that we create during our "End of Week" Session

We will be going through this in about 30 Minutes for our clients. During this time
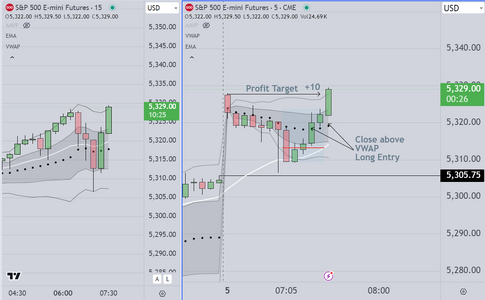
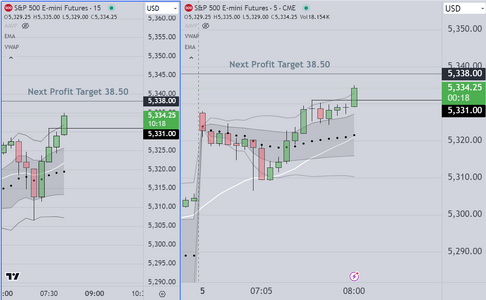
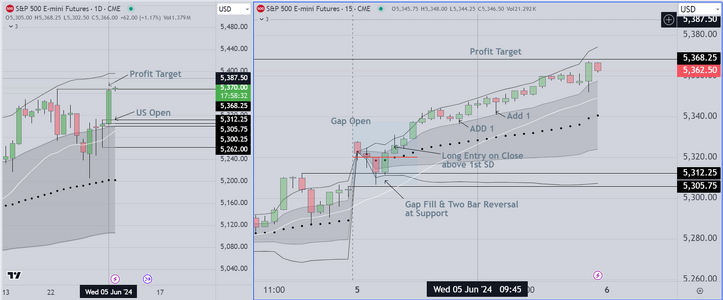
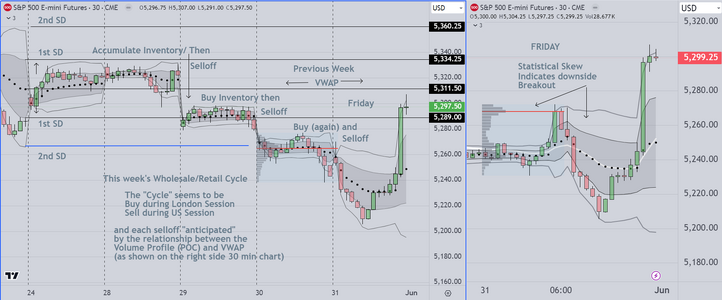
we review the week, looking at the TIMING of the buys and sells, so that traders can
see the prices where computer programs were activated

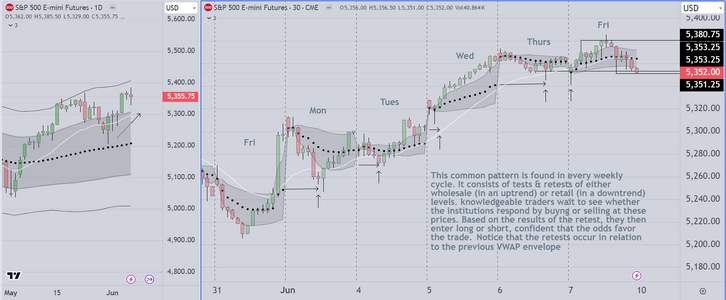
After they get into the routine (doing this analysis regularly) the cycle (Wholesale/Retail)
starts to become obvious. The result is that traders learn to anticipate where to
enter and just as importantly, how long to hold positions

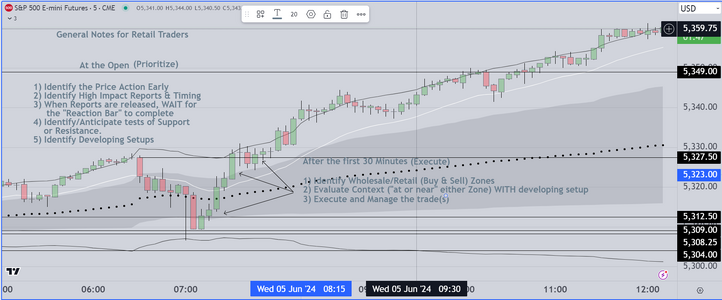
At the risk of being tiresome, let me state the obvious. Just learning "setups" isn't enough
to create a viable (profitable) business Professionals learn to see the bigger picture (context)
and they ADD setups (and those setups work if applied at the right time). This (in our opinion)
is the difference between making a (very good) living as a professional, or, losing money
(so called "death by a thousand cuts") as retail traders get whipsawed back and forth trying to
find a good entry.

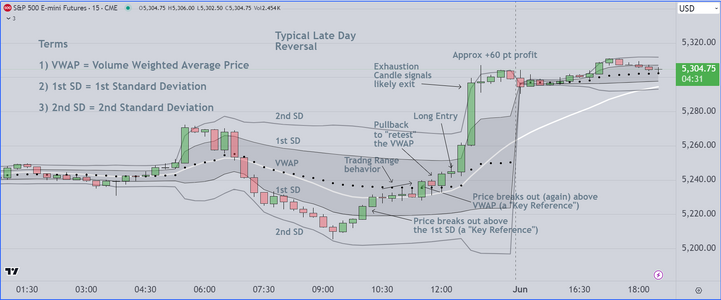
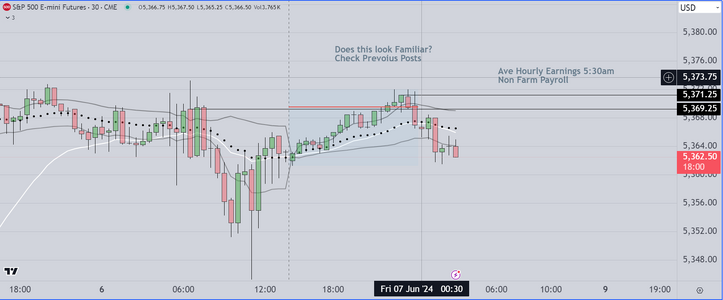
We assume everyone notices the late day (Friday) reversal, which signals the start of a new "Cycle"
 

Attachments

  • End of Week Chart Markup.PNG
    End of Week Chart Markup.PNG
    210.4 KB · Views: 30
Last edited:
Today's chart shows Friday's "Late Day Reversal" AND it also
shows an example of one of our primary setups ("Breakout")
above or below a "Key Reference". This one setup has withstood
the test of time, and we can find at least two (2) profitable breakouts
on every chart and every time frame. The odds of success will vary
depending on the trader's ability to understand context. We show
struggling traders a basic rule set and then we suggest that they
markup charts on the weekend to identify the setups and the context
that worked in past. Generally, once a trader has done this for a few
weeks, they start to "see" not only what works, but when to stand aside
These setups happen so frequently that missing one does not significantly
impact performance over the weekly and monthly time frame
 

Attachments

  • Late Day Reversal Example.PNG
    Late Day Reversal Example.PNG
    170.7 KB · Views: 10
Here is our Monday Markup Example chart

This display is setup to be read from left to right, starting
with the daily chart. On that chart we see the following

Daily Chart (Left Side)

1) The VWAP frame is Quarterly (rather then Monthly)
2) Most recent price action shows a breakout above the
1st SD, followed by a pullback to retest the 1st SD.
3) The Breakout setup activates when price exceeds
the high. This price action is also consistent with a
"2 Bar Reversal". Computers recognize these setups,
and this suggests that at least some of the big institutions
believe they know how the economic reports will play
out tomorrow

Session Chart (Setup Evaluation)

On the right side, we see the marked up chart showing
price magnets (price targets above previous price action)
as well as lines extended from previous VWAP "Frame"
Professionals WILL trade using the previous VWAP envelope
They know that the VWAP needs to accumulate a
"Statistically Significant Sample of Data" in order to work
accurately. This is why we recommend that traders become
familiar with basic stats, or learn from someone who can
teach the basics in summary form.

Final Note

What happens overnight (from my standpoint) until London
Opens, and from London Open until USA Opens, is part of
the puzzle that we try to solve prior to the US market open
at 0630 hours (PST) We factor in price action, consensus as
regards high impact economic reports, and any additional
data available.

In the near future we will create a couple of live trading events, so that
interested traders can see how this process can add value to
their trading
 

Attachments

  • Monday Markup Example 1.PNG
    Monday Markup Example 1.PNG
    157.8 KB · Views: 9
Last edited:
Very Nice Trading Today!

As often happens on a trend day, we are done early

The rules we follow have worked (once again) to

1) keep us from making stupid mistakes (poor entries)
2) allow us to wait patiently for the right context before
choosing an entry
3) to obtain confirmation (to figure out which side is
dominating the market)

As with any successful business, we operate according to
proven rules. Our primary rule is

When you have multiple data inputs, "Prioritize then Execute"

Prioritize (Step 1)

As with every market day, we teach students to look at
the big picture first (Daily Chart, Position of Price as framed
by the Quarterly or Monthly VWAP and Pending Economic
Reports)

Execute (Step 2)

We wait patiently for price to display tradeable behavior
Trend (one of our setups) or Trading Range (we mark high and low
closes)

For retail traders, we suggest they stand aside during the first part
of the session which is likely to be trading range.

As price breaks out, we follow along and evaluate as follows

Breakout/Pullback/Entry or
Test/Retest/Entry
H2/L2 and entry on Failure

We teach the nuances of each setup during our classes

When to hold for a swing, or standard scalp (each one defined
by analysis of previous week's price action). When to add (for
aggressive participants, and when to lighten up or close out
for those who are more risk averse)

We attach a chart showing the "overlap closeout trade" that occurs
in the context of a trend day, and Euro traders who have made money
on the previous trend, look to take profits and/or close books.
 

Attachments

  • Overlap Pivot Closeout Example.PNG
    Overlap Pivot Closeout Example.PNG
    139.9 KB · Views: 10
Last edited:
Happy with my performance on this one

Its not about the trade. This is a common entry for commercial traders
and is known as an "OD" (Open Drive) entry

It occurs when the "reaction bar" after release of an economic report
creates a strong bar (either direction). The base of that bar is the entry
and it is pretty simple (and consistently reliable)

A nice way to start the trading day
 

Attachments

  • OD Short Example Econ Report.PNG
    OD Short Example Econ Report.PNG
    105.7 KB · Views: 9
And the follow up (a Reversal)

here you can see the Skew Reverses First
then the entry is taken

Again this is basic for skilled commercial traders
who have seen this play out. Experience counts
here and I have "seen this movie" before

Pleased with my performance, NOT because of the trades
they are routine, but because I was able to capture them
for these posts AND trade them (keyboard skills)

back to work
 

Attachments

  • Profit Target Hit +10.PNG
    Profit Target Hit +10.PNG
    110.2 KB · Views: 10
  • Skw Reversal and Long Entry.PNG
    Skw Reversal and Long Entry.PNG
    103.9 KB · Views: 10
And this last chart showing the overhead profit target at 38
 

Attachments

  • Profit Target Forecast.PNG
    Profit Target Forecast.PNG
    110.3 KB · Views: 7
and the 2nd target hit (while I was posting)

The importance of this is NOT whether the target was hit
but how to make the determination whether to stay in a trade

The way that we teach folks to evaluate is to look at ATR (Average True Range)
NOT for the day, but by time segment....The opening hour and 2 hour segments
In this instance we believed that currently volatility would support staying with
a continuation entry

The general rule is that based on the first hour's range, one can anticipate
that in the next hour, the range may double.
 

Attachments

  • 2nd Profit Target Hit.PNG
    2nd Profit Target Hit.PNG
    113.5 KB · Views: 11
Here is a copy of the basic (Prioritize & Execute) Rule Set
that I provide to my clients

The basic skills are relatively simply to acquire. What is not so simple
is to gain the right mindset. To know when to stand aside and how to
profitably spend your time (processing and prioritizing the data), before
making the decision to "execute and manage" trades

Skilled commercial traders START with the right mindset. For example
a skilled trader looks at the developing chart (the Globex Chart) and
right away, he or she can quickly identify the Wholesale and Retail price
ranges. If they anticipate a trend day, they look to get long (to execute)
at the best Wholesale price possible. Once they are long, they look to see if
price closes above the 1st SD. If price does close above the 1st SD band
they look at add on pullbacks (this is called "structuring the trade")
And of course if works the same on the short side

Notice on my chart how once price closes above the 1st, it continues
as institutions ADD to positions on pullbacks. Skilled traders
monitor the Dow on a 30 minute basis. Check out the timing of the
continuation moves. Why do you think that happens (luck? Coincidence?)
With so much money on the line, how likely is that?
 

Attachments

  • Proritize & Execute.PNG
    Proritize & Execute.PNG
    165.5 KB · Views: 15
Last edited:
I corrected my previous post just now.

In the original I suggested that commercial traders would look to get long
at the "best possible Retail price"......That was a mistake on my part. For those
paying attention, you ALWAYS want to get long at the Wholesale level

You want to buy cheap and sell expensive....and vice versa
This basic method is how options traders make money and it works
the same for professionals trading stocks, & futures as well.

A little disappointing that with 5K views of the thread, no one seems
to have picked up on this
 
Here is the chart display that I recommend for new traders

This way of trading has a number of advantages as follows

1) It keeps traders out of the market early on., which is important to prevent
new traders from starting the session with losses.
2) It is easier to see developing setups on the 15 minute time frame
3) Also easier to see breakouts above and below the 1st SD (and to hold profitable positions)
4) Finally, the skew (created by the relationship between the red line & VWAP "dots") is also
easier to read.

If you look carefully, you can see that this makes it possible for a patient trader to watch, evaluate,
"prioritize" and (when the "planets align") make the decision to "execute" and manage the trade.

Also please note that as the profitable trade develops through time, it is easy to see where to add
as price tests and bounces off the 1st SD or the 20 ema
 

Attachments

  • 15 Min System for New Traders.PNG
    15 Min System for New Traders.PNG
    161.3 KB · Views: 15
Last edited:
Attached below is a chart showing the preliminary Markup
for tomorrow's US session. that new and/or struggling traders
use in our classes

and as seen on the right side display, we also monitor "high impact"
economic reports

Students start the day about an hour prior to the US Session Open
During that period, we show them how to evaluate the previous
price action (both Daily/Weekly and 15 min candles). We discuss
the probable direction, based (again) on previous price behavior
and (finally) we look at the previous week's opening patterns

New & Struggling traders are encouraged to "monitor only" and
Identify price action for at least the first 30 Minutes (the first two candles)
During that time we show them our 5 min chart AND we demonstrate
how to use the "Skew" to provide a significant additional edge

Tomorrow (Thursday) is an important day in our schedule, and so we
will not be posting

Good luck everyone
 

Attachments

  • Prelim Markuip New Traders.PNG
    Prelim Markuip New Traders.PNG
    146.5 KB · Views: 14
We have modified our charts. Take a look and let me know
if you find it easier to work with.

We will post two (2) charts,. On the left side of the first
chart, we removed the candles, so that the relationship
between the VP/POC and the VWAP median can be seen
What you are seeing is the development of a negative skew
at 7am (30 minutes after the US open). This suggests that
institutions are starting to sell (aggressively) In our class
we talk about how to interpret this data accurately. It is
critically important to have this confirmation before entering
as position.

The second chart presents the same look, however this chart
shows candles in place. Struggling traders will recognize that the
early price action created a "trading range", as it often does during
the first hour. In our class they are trained to stand aside, waiting
patiently for the inevitable break out (or one of three reliable setups)

A word about "mindset"

Perhaps the biggest problem for struggling traders, is learning to
wait patiently and to screen the various opportunities taking only
the best (high probability) entries

The most valuable lessons that we offer are actually about the analysis
of prior sessions price patterns. In these sessions, traders learn to identify
the actual prices, where institutions are coming in to buy or accumulate
(at wholesale) or to sell or accumulate (at retail). This seems to be one
place where the "light goes on" for traders who previously were entering
then finding that their positions reverse on them because they are
entering at the wrong time and/or price.
 

Attachments

  • Simplified Display New Traders.PNG
    Simplified Display New Traders.PNG
    139 KB · Views: 13
  • Simplified Display with Candles.PNG
    Simplified Display with Candles.PNG
    148.8 KB · Views: 14
Here is my "markup" and trading setup of choice for the London Open

As you can see, I document pending (high impact) economic reports
AND I anchor the POC at the Asia Open. Then I wait (patiently) for
London to open. I read the skew. I trade the setup and as often happens
I exit with a small scalp

I do this about twice a week, taking a small (less than 5 pts) scalp
I then get a short nap, and return to trade the US session

Take a look at the chart and compare to the chart on the previous post.
Repetition is way I make a living. Before I learned the importance of
repetition, my results were inconsistent.
 

Attachments

  • London Open ETH Example.PNG
    London Open ETH Example.PNG
    105.2 KB · Views: 13
Here is today's 15 min chart
Easy day to trade, based on retest of previous "Wholesale" levels
and using a simple "breakout protocol"

The chart shows the previous Wholesale levels where Institutions
created their entry levels. The arrows show the previous session
trend moves originating at a specific range of prices. Today all you
had to do was wait patiently for price to retest, and then take the breakouts

The overhead profit target is determined by the Daily chart (on the right side)
and was hit early in this session.

"Best Practice" for new or struggling traders is to 1) Learn to Mark up charts
accurately, 2) Wait for price action to confirm the statistical skew, 3) Wait for
a breakout from either Wholesale or Retail levels, 4) Execute the trade at the
right prices 5) Hold long enough to overcome expenses, which we define as
a "standard scalp = 3-5 pts, or a "swing" of 7-10 pts.

We updated the chart just now to show the most recent breakout in progress
 

Attachments

  • Early Trend Retest of Wholesale Range.PNG
    Early Trend Retest of Wholesale Range.PNG
    164.4 KB · Views: 11
Last edited:
This last chart is an example of what we call an "early closeout" pattern

On Friday, as we near the close of the Euro/USA overlap session, it is
common for (human) traders to close their books early. It is after all
6pm in London. Automated trading continues of course however
the pattern recognition computers are always ready to take profits if
they see evidence that other participants are doing the same

The previous breakout failed, and retraced to test the VWAP and
20ema, before reversing. We leave early as well, to prevent late
day "give backs"
 

Attachments

  • Friday Early Closeout Pattern.PNG
    Friday Early Closeout Pattern.PNG
    161.4 KB · Views: 14
Last edited:
Significance of Wholesale & Retail Levels


The chart attached below shows the emphasis that we
place on accurate identification of wholesale and retail
prices.

This business model has been used successfully by institutional
and Commercial trader for decades.

New & Struggling traders who learn to accurately identify these
levels have a significant edge. Generally, the trades they take
have higher "win rates". Also it provides the confidence they
need to hold positions longer. This (by itself) can make the difference
between being a net loser and real economic freedom.
 

Attachments

  • Retests of Wholesale-Retail Levels.PNG
    Retests of Wholesale-Retail Levels.PNG
    137.5 KB · Views: 12
Last edited:
DEFINING WHOLESALE & RETAIL LEVELS

This post is one of the last in our series, aimed at providing
new & struggling traders with alternatives that can be used to
create a viable trading system. For me, this was life changing.

This last chart displays a summary of the process that professionals
use to define wholesale and retail price levels. It displays a full week
and during this time period, one can see how the first day or two
are used to define and test these levels. Once the basic levels are
defined, each successive day (usually) consists of an early retest,
followed by either trading range or continuation of previous trend.

In the next few days I will create a live event where interested traders
can watch as I trade. I will do this for two (2) sessions.
 

Attachments

  • Weekly Wholesale Retail Levels.PNG
    Weekly Wholesale Retail Levels.PNG
    137.6 KB · Views: 11
Here is another chart showing a common weekly cycle
In this case, the chart shows price retesting the prior week's
wholesale low, then institutions come in to buy. This confirms
that they define those levels as "Wholesale" value, AND are willing
to put money to work to move price higher. At some point (of course)
they will decide the sell "inventory" to take profits. We hope that
knowledgeable observers will see the opportunities that exist as a result
of this repetitive behavior.
 

Attachments

  • Weekly Cycle Example 1.PNG
    Weekly Cycle Example 1.PNG
    183.2 KB · Views: 8
An additional note about these last several posts

As mentioned previously, the majority of volume in every liquid market
is automated. The reason is that skilled programmers know how to recognize
the patterns that we have pointed out, AND they also know how easy it is
to make money by trading both long and short at various points within
the larger pattern (the "big picture"). What you are seeing is the result of
institutions using money to accumulate positions, that they hold, while
the human traders, go long or short at intervals during the weekly and monthly
cycle. This is known as "trading around a core position"....Once you figure out
what the core position is, AND you identify the test/restest prices, it becomes
relatively easy to figure out the prices at which to go long or short, and whether
to hold for a swing (7-10 points) or take a smaller "standard scalp" (3-5 points)

What is interesting to us, is that up to this point there have been no questions or
comments. That suggests either 1) observers understand everything we have posted
and are making use of it. or 2) Are complacent, and have little interest. Either way
we intend to hold a couple of days of live trading, then close out the thread.

Traders should be advised that FOMC decisions and release of minutes will affect
the market's behavior. It will be interesting to see how it all plays out.

Good luck in the coming week
 
Top