Beyond Price Action

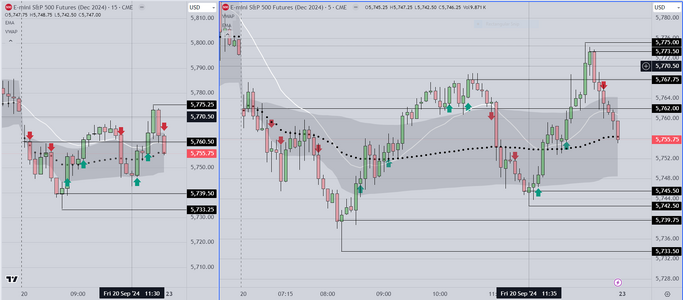
Here is my Markup Chart for Friday 20 Sept

This chart is based on the "Breakout Setup" that I suggest Retail Traders
use. It allows them to concentrate on a pattern that seems to display
a consistent edge. In my recent class, I show the students how to analyze
previous weekly performance to quantify whether the setup is working (it is)
and also to determine the percentage of setups that were successful (79%)
during the previous week.

For the coming week, we start by removing the red & green entry arrows
and we use the outline (horizontal lines) to create a framework.

We also use the FRVP (fixed range volume profile) to identify the "initial skew"
which when used in combination with the VWAP, creates an accurate forecast
for the direction of price at/near the open.

Notice that the display contains two (2) charts, a 15 min and a 5min chart. We
do this to show the extra granularity that the 5 min chart provides. This extra
detail allows skilled, experienced traders to find additional entries. Unfortunately
it seems to confuse retail traders and the result is that they tend to take bad
trades early in the session. We suggest newbies concentrate on the 15 chart
and focus on only the setups that are clear and present in that chart, while
reviewing the 5 min chart later, to learn to recognize those additional setups as
they develop.


Good Luck Everyone
 

Attachments

  • Fri Sept 20 Markup.PNG
    Fri Sept 20 Markup.PNG
    115.3 KB · Views: 30
Last edited:
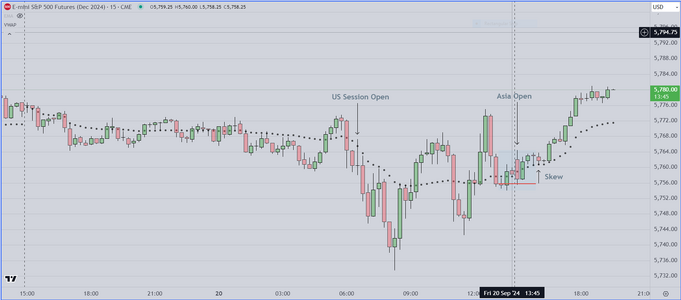
And my Markup for Asia to London

Given the context, this was one of the easiest trades to anticipate

an early breakout to the upside

The details of the Breakout Setup are basic

1) Price breaks above or below a "Key Reference"
2) Price pulls back to retest the Breakout bar high or low
3) Entry on the next bar that breaks above or below the Breakout bar

The problem for most retail traders is inability to recognize the setup
as it develops. I suggest that traders start by focusing on WRB's (wide range bars)
that break above or below a previous high or low. Then I move on to the variations
that occur most often. During the weekend. we go over those variations and replay
them.
 

Attachments

  • Asia to London Sesson Breakout.PNG
    Asia to London Sesson Breakout.PNG
    77.8 KB · Views: 10
Last edited:
Professionals call this a "Clean Chart" example.

Interestingly, if you research this "system" on Google for example
the AI component will suggest that neither VWAP or VP (Volume Profile)
have predictive ability. This is great example of the way that AI creates
misinformation. If you take a moment to think about it, both skilled and
unskilled automotive mechanics have access to the same tools, however
the skilled mechanic can fix your vehicle, while the unskilled mechanic can
in some cases, make it worse. Clearly It's not the tools, but the skill with which
they are used, that makes all the difference.

In this example, we removed everything, except the two (2) tools which when
combined (and interpreted accurately), produce a statistical tendency for price
to move from an area of low volume, to an area of high volume. I have used
this tendency (profitably) for more than a decade. The chart shows another
example of how this works, and yet, a trader still has to learn where to enter
and when & where to cash out.
 

Attachments

  • Clean Chart Skew Example.PNG
    Clean Chart Skew Example.PNG
    60.8 KB · Views: 9
Last edited:
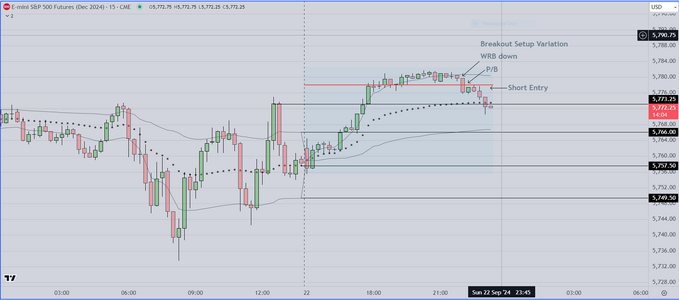
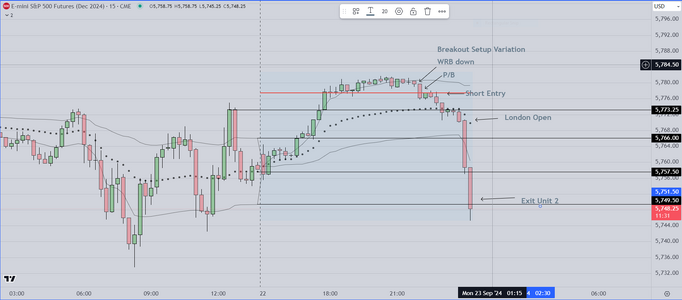
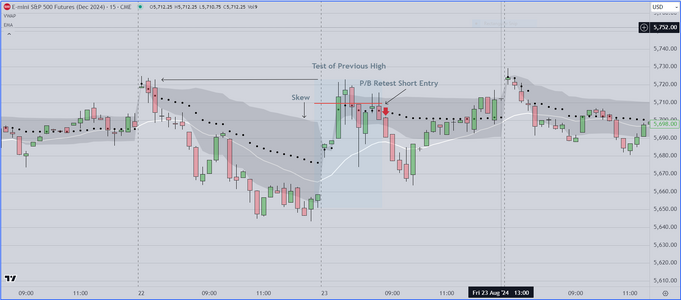
Here is a breakout example that might interest readers

It is a variation of the basic rule set. The "variation" is
that it uses the Volume Profile POC as the "Key Reference"

Notice (as mentioned previously) this setup starts with a WRB
(Wide Range Bar). Once you see it, you simply wait for the next
bar to complete. If it were to trade above the Red Bar {VP/POC)
it would invalidate the setup. Because it tested the POC and then
failed, it signals a short entry for (at least) a scalp.

"Standard Practice" suggests a multi-contract bet of at least three (3)
units. Professionals would scale out one (1) unit. This practice is
known as "buying a stop". The balance is held to a standard swing,
which is defined as a "measured move".

Timing of this setup suggests that traders would monitor London
looking for continuation (down). If that doesn't happen, "buying
a stop" allows the trader to exit at break even. A common practice
amongst commercials
 

Attachments

  • Breakout Setup Variation.PNG
    Breakout Setup Variation.PNG
    84.4 KB · Views: 10
Last edited:
We post this follow-up chart showing the London Open and
continuation of the price action down. As readers will see (if they
refer to the chart below), a short trade based on the Breakout
setup we outlined, resulted in a profitable swing. Most commercial
traders would exit another unit at a test of the lower 1st SD, leaving
one (1) unit to run. Because of the context, the trade would be
exited on a close above the 1st SD.

We will stop here, and get some sleep before trading the
US session opening in about 6 hours (US time)

Good Luck Everyone
 

Attachments

  • Follow Up London Open.PNG
    Follow Up London Open.PNG
    91.1 KB · Views: 10
I thought I would take a moment to talk about context, specifically the
context that traders obtain from the higher time frame (daily candles for example)

If you look at the daily chart (as I use it) what you should notice is that the S&P (Emini)
has breached the all time high, and what you have are a series of doji's. This type of
candle indicates indecision (lack of conviction). In addition, this kind of price action
also signals "trading range" price action. So what do we take away from this?

If you look at the chart posted below, you can see what the larger range is easily enough
and you can see that for each of the last few days, the range is small relative to the previous
Commercial traders know this to be a "limit order" environment. They wait for the first few
bars to establish the range, then they use limit orders to buy previous low closes and sell
previous high closes. They know that if they are wrong, price is not going far from their
initial entry, and they can make money by scaling in. For professionals this is easy money
Amateurs in contrast cannot compete, because 1) they don't have sufficient account size
to afford to scale in 2) Don't know how to structure the limit orders and finally 3) they don't
have enough experience to know WHEN to scale in

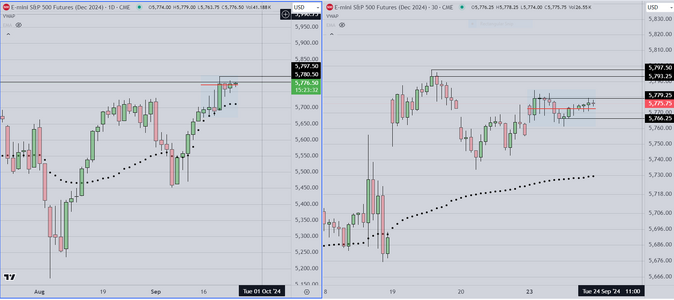
The chart below shows Daily Candles on the left side and 30 min candles on the right
As can be seen all time high is marked on the left (two horizontal lines) and on the right
we see the most recent 30 min sessions. Professionals wait for the first candle (perhaps two)
to complete then they establish the high and low closes. From that point forward they scalp
by buying each low close, and selling each high close until that doesn't work, and when it goes
against them they scale in, using the candles bodies as points of entry. As mentioned, yesterday's
session was relatively easy money IF you had the prerequisites (experience, a reasonable system
as outlined, and the ability to recognize opportunities as they occur

When I work with new fund hires, we start with either 30 min or 15 min candles. We mark successive
high and low closes, then we "read" the flow, using a session VWAP and VP/POC to obtain skew
The skew allows the trader to decide which side to favor, so that IF price does breakout, they will
be on the winning side of the breakout.

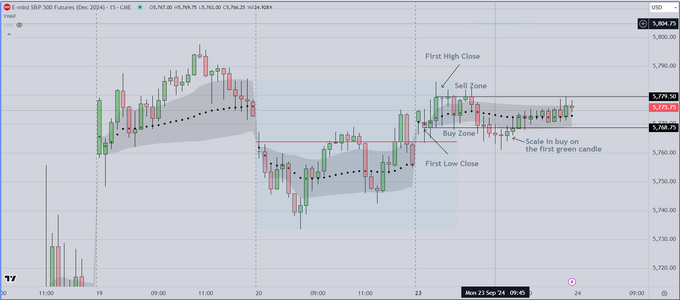
The right hand chart shows the scalping framework that I use. The red line shows the skew, which is
to the upside on this date. We mark the high and low closes then spend the rest of the session
buying low, because that is where the low risk entries are located. On the single occasion where price
drops below the framework, we simply wait for the first green bar and scale in long, and as you can see
it becomes a profitable trade. If you look on the right side of the chart, you can see that these are 10 pt
trades IF you let them run between the lines

There is a bit more to this of course, but it's impossible to provide all the details in this format.

Each of the last several days could be traded in the same fashion

Good luck everyone
 

Attachments

  • Session VWAP Scalp Framework.PNG
    Session VWAP Scalp Framework.PNG
    83.1 KB · Views: 11
  • Daily & 30 Min Example.PNG
    Daily & 30 Min Example.PNG
    79.2 KB · Views: 9
Here is my markup chart for Wednesday 9-25-2024

Notice that the chart shows 30 min candles. what I have learned from
my retail students is that using 5 min candles causes confusion, and
the result is losing trades early in the session. In contrast, using 15 min
or 30 min candles, makes the price action easier to see, in particular
students can see how the breakouts, retests and points of entry develop.
Also it means less trades. Now one might think of this as undesirable, however
if we look at actual performance over time, it turns out taking fewer trades, but
more winners, and holding those winners longer, is the key to transitioning
from being net losers to winners, and this seems to take three (3) to six (6) months
on average, depending on the trader's ability to learn to control their emotions.

Finally, in today's class one of the students mentioned that it was easier to hold
winners, when they can see me doing just that, (while explaining why). Yesterday
I asked traders to look at the price action that occurred during the previous release
of New Home Sales data which occurred on August 23rd. Our last chart today
shows how price action developed on that date. See any similarities?
It is this kind of preparation that we teach to our students. It is how a professional
operates in any market. This is the way that skilled traders obtain a significant edge.
This type of preparation allows me to have the confidence to trade size, and to hold winners
to a logical profit target, which for me is +10 pts
 

Attachments

  • Wednesday 9-25-2024 Markup.PNG
    Wednesday 9-25-2024 Markup.PNG
    103 KB · Views: 8
  • Previous New Home Sales Session.PNG
    Previous New Home Sales Session.PNG
    90.1 KB · Views: 9
Last edited:
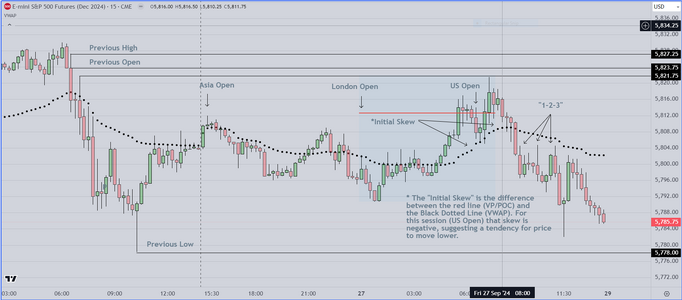
Here is the final Markup for Friday 9-27

I have simplified the chart as much as possible
It shows 15 min candles, the session VWAP (Black Dotted Line)
and the Initial Skew which is describes the statistical tendency
for price to (during this session) to retest the previous session low

Because this is my first experience with Retail Traders, I asked them to
1) trade sim accounts only, and 2) at the end of each hour I asked them
to predict whether price would move up or down in the next hour. This
was especially instructive for those who claimed to have a background in
statistics, but when it came down to it, really did not.

Bottom line, we started by showing our pre-market preparation, how to create
a trading plan, and then as the market opened, we watched together UNTIL price
exhibited the following "Repetitive Behavior"

1) Test of a Key Reference----We wait for price to test an important level, either up
or down (doesn't matter which)
2) Continuation, Reversal, or Trading Range----Again, we don't care which one, we just
want to identify accurately and then adjust to what we see
3) Wait for the setup---We teach Retail Traders one (1) setup, which is a Breakout--Pullback/Retest
followed by an entry, in the direction of the skew. Turns out this is the only setup that retail
traders need to create a viable trading business.
4) Traders learn that a) Good trades move into profit right a way, and losers wiggle around
showing indecision. We teach traders get out of losers within a minute (literally within 60 seconds)
and to hold winners (AS LONG AS THE SKEW REMAINS THE SAME AND PRICE CONTINUES TO
TREND)

That is as simple as I can make it, and yet I have traders tell me that they could not stay with a winner
very long (until they watched me do it) because the were fearful that the winner they had would turn
into a loser. At that point we have "the conversation" about trade size and scaling in.
 

Attachments

  • Friday 9-27-2024 Final RTH.PNG
    Friday 9-27-2024 Final RTH.PNG
    99.8 KB · Views: 9
Last edited:
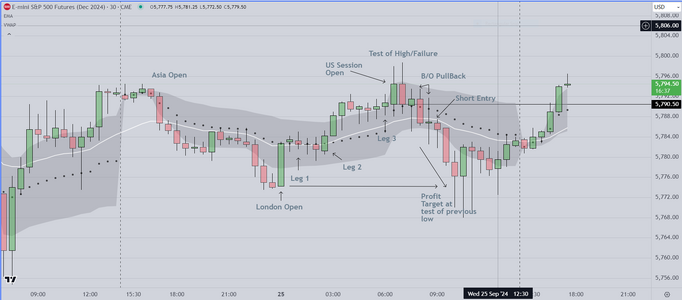
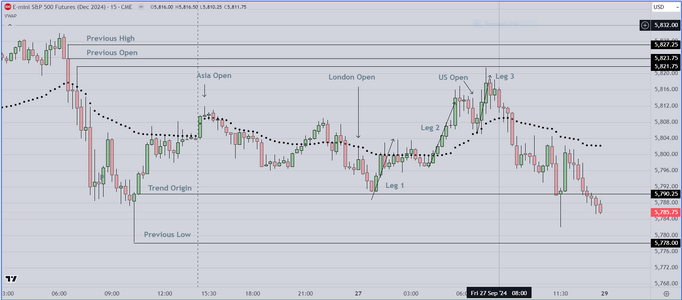
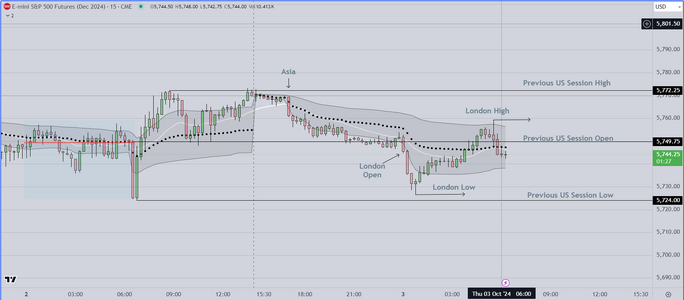
Here is an example of how important it is to utilize "Leg Count" in trading

Typically the market moves in "Legs" punctuated by sideways (trading range)
pauses. In the chart example below, I placed a line through each of three (3)
legs. At the conclusion of the third leg, price fails and one can see the result
A strong move down to retest the previous session low

If you look closely, you can see that this constellation starts to build at the start
of the London session. During the first 90 minutes, Leg 1 is created then, four (4)
hours later, Leg 2 was created. Seeing this, skilled traders know that they can
wait for a pullback and Leg 3. As you can see, that is what happened as price
pulled back to test the VWAP (a "Key Reference") then up to test the previous high
(another "Key Reference") and because the skew tells us what to expect next, we
wait for the Breakout Setup and Short entry, with a logical profit target (test of
the previous low).

What is fascinating about this is that we outlined it PRIOR to the open as part of
our trading plan. Participants watching this, asked "how can you be sure this will
happen"....and I said I am not sure...it is simply a logical progression. If you think about it
Price can do three things, long, short, or sideways. This is just one of the options, one
that makes sense IF you have sufficient experience (if you have seen it play out before).

One last note

We complete our analysis about 30 minutes prior to the open (of the US session).
At that point we review briefly and we take questions. Our final comment is about
the importance of developing discipline, and the confidence that comes from
generating a plan that is "actionable", meaning that as the market develops, you
can actually see one of the options emerge as "real" (this is really happening).
After you show folks how to do this a few times, it is gratifying to see the light go on
as they see it as possible for them to create a sustainable business model.
 

Attachments

  • Revised Friday Markup.PNG
    Revised Friday Markup.PNG
    80.4 KB · Views: 10
Last edited:
Here on the West Coast US, it is Saturday night 11:30pm

I have enjoyed posting these last few months and my recent foray
into training retail traders has been interesting. I have learned a lot
from my students, some of whom are neighbors and friends of friends
who heard about me and wanted to see (primarily) 1) If it was a "real"
possibility, and (for those who have traded unsuccessfully in past) 2) whether
they could learn something that actually worked. What was unsaid (of course)
was that for the most part, they were unwilling to put much effort into it
until they saw me demonstrate the process. Then, as I mentioned, the
lights went on. Suddenly the questions from all sides, and finally the
concerns "what's the catch". That after all is basic human behavior.

I am going to continue with this small group and my expectation is that
at least a few of them will find the success they have been hoping for.
As with all things in life, some will not and some will decide it is just
too much work to learn to control their emotional response to the
uncertainty of trading, waiting, and watching each trade unfold. It
certainly isn't for everyone.

I may post a few more pre-market markups, and then I will close
out the thread. I notice that there were a lot of views, and a few
guarded private messages, but other than that no real engagement
from readers (which is fine).

Good Luck Everyone
 
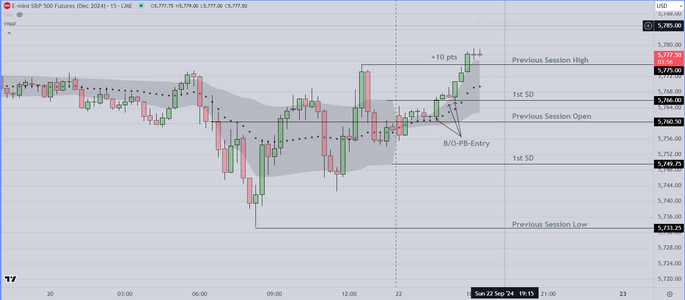
And here is the modified Markup chart that I use as my point
of departure for this next Monday. As can be seen, we simply
re-label the various "Key References" so that when the ETH
session starts (Sunday at 3pm PST US time), we can obtain
a sense of how the market is trading during Asia, and London
Market Sessions. This also allows us to use the price action
critical to our preparation (the London Session). This explains
"how" we obtain our edge and create the trading plan(s) prior
to the US Session Open

Additional Comment

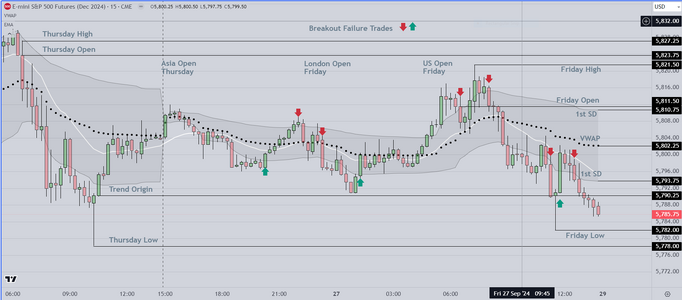
While markets do vary somewhat, the consensus amongst professionals
is that about 75% of breakout attempts fail. When we say that they "fail"
we are talking about price breaking out of the previous session(s) high
& low. Also, commercial traders learn that breakouts of the 1st SD
(Standard Deviation Band) also fail quite often. That is why our
breakout setup requires a retest of the breakout bar (to confirm that a
breakout is in fact likely to be successful). It takes a while for retail
traders to learn to see these "failures", but as they become more
observant, they start to see these as legitimate opportunities for
trades. We list some of the common "failure setups" as follows

1) breakouts of previous high/low
2) breakouts of "big numbers" (5800, 5900, etc)
3) breakouts at specific session times (weekly, monthly, quarterly
highs/lows
4) breakouts of 1st SD bands (only when price approaches from
inside the VWAP envelope)

These are the most common "failure & reversal" points. Most
commercial traders learn them early on, and because the odds
favor their success, they are willing to enter and hold for scalps
 

Attachments

  • Breakout Failure Examples.PNG
    Breakout Failure Examples.PNG
    127.9 KB · Views: 6
Last edited:
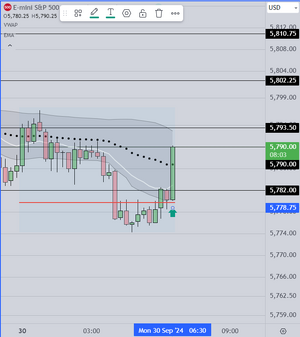
Initial B/O trade at US session Open

Price positioned inside the VWAP and confirmed by VP/POC Skew
easy trade for everyone to take
 

Attachments

  • Breakout up.PNG
    Breakout up.PNG
    39.8 KB · Views: 7
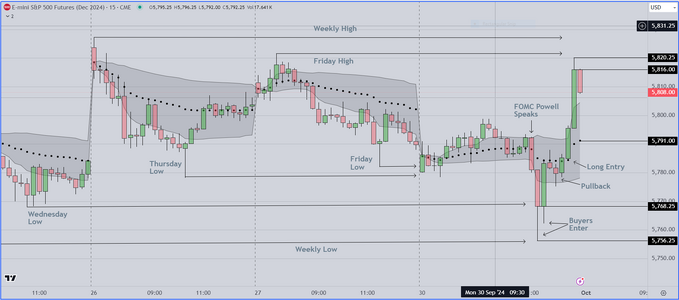
And this followup chart example

This is all context critical, meaning that for this day
we have a high impact event that controls the market
(Fed Chair Powell speaks) and so for those of us who
know how this plays out, it is predictable as follows

1) Shortly prior to the open, a breakout setup develops
(on several time frames). It is confirmed by the initial skew
to the upside
2) At the open, the first bar is a breakout into the VWAP envelope
It is also the entry bar. Both the institutions and commercials know
that the "event" is likely to be positive.
3) The retest is also predictable. Breakout bars often retest and
when it does, you watch for the quick reaction at the edge of the
VWAP. The "buyers tail" develops and then everyone gets a small
scalp up. Easy trade

So at this open. The initial trade is based on the skew and is good
for almost 10 pts. The retest is good for another 5
After that we wait for the event bar
This is likely the only post for today
 

Attachments

  • Breakout & Retest Entries.PNG
    Breakout & Retest Entries.PNG
    68.1 KB · Views: 8
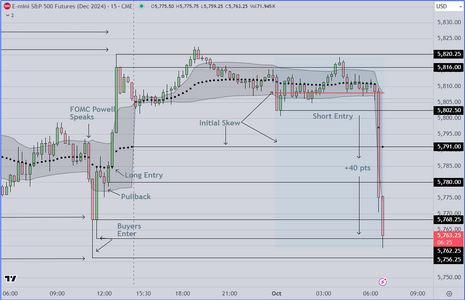
And the "Initial Skew" trade that setup early this AM (West Coast US Session)

The context was the pending PMI economic reports which suggested uncertainty
and the skew which was symmetrical in the pre-market, and just prior to the open
FELL SIGNIFICANTLY, confirming that institutions were selling. We went with that
signal and let it run, which is what you want to do in this situation. The result was
+40 pts

If you look at the right side of the chart you can see that our markup from yesterday
provided the framework for this short entry and will provide the same, for the long
reversal shortly

Good luck Everyone
 

Attachments

  • Initial Skew Trade.PNG
    Initial Skew Trade.PNG
    87 KB · Views: 9
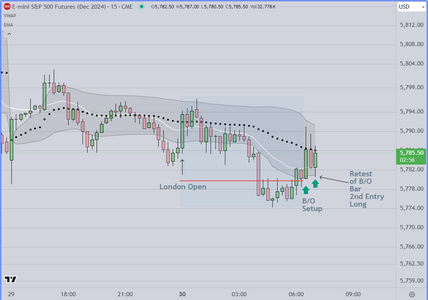
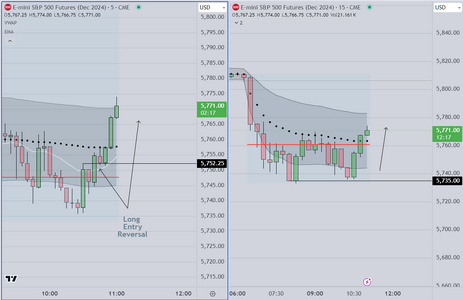
And here is the reversal I was anticipating

As seen in the chart, we look for the reversal
to begin at the low end of he VWAP envelope
AND with benefit of a positive skew

Interesting (to me) that even when predicting this
in my room, the students were hesitant to take the
trade. Various reasons given including protecting
profits from earlier trades (which is fine). But in
terms of "best practice", readers should know that
what works in trading is 1) skill (a trading plan that
has an edge) 2) taking valid setups, and 3) managing
trades correctly (holding winners as long as possible)

This chart shows the long entry on both 5 min and 15 min timeframe
I always suggest that students trade 15 min.

Final Note

In this class I ask students to trade sim and MES (Micro) rather than
the full contract. I do this to demonstrate a couple of important
points. The first is that in order to transition to profitability, students
have to learn to 1) recognize context and setups 2) be willing to hold
for at least 3-5 points (preferably 7-10) and 3) cut off losers quickly
As is often the case, several students found themselves net losers
going into this last time period. I took the liberty of asking them
to take the reversal, and even though they were uncomfortable (at
times), to hold for a test of the upper SD band. The result was that
they more than made up for early losses and were net winners
Tomorrow and over the next few days, we will see if they have actually
learned this important lesson and can find a way to manage their emotions
while trades develop.


Done for the day
 

Attachments

  • Late Session Reversal.PNG
    Late Session Reversal.PNG
    78.6 KB · Views: 8
Last edited:
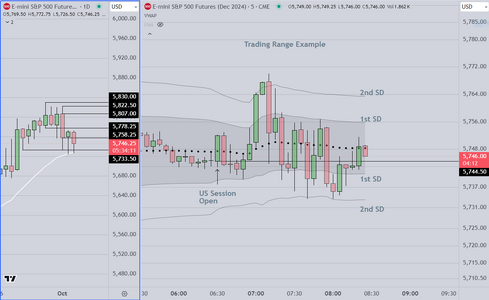
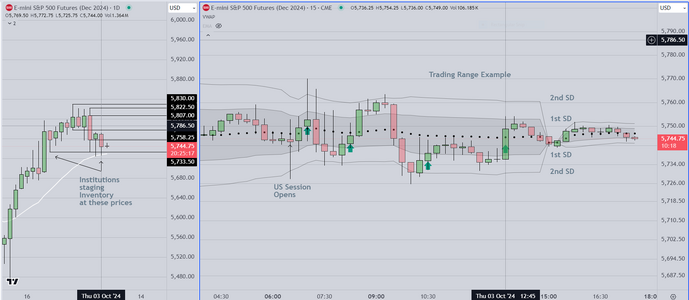
Thursday 10-3 Markup

The initial Markup is on the left. It is what the students start
with and from this point they establish scenarios (long, sideways, short)
They start with "context", meaning that they look initially at the impact
that pending economic news may have on price action. This is established
by review of previous release dates

After that they create the scenarios, based on specific price ranges
for example in the chart on the left, we have the daily candles (also on
the left showing that buyers came in (note the buying tails at the area
testing the 20ema. This established the buy zone. On the upper end
we can see on our ETH chart, where sellers came in the move price lower

Finally we monitor the first hour to see which direction is chosen, or if the
day is to be a "trading range", where the boundaries are going to be established
This is simplified because of the VWAP envelope

Obvious trading range day, with possibility of a late day reversal at or near 10:30am
local time..
 

Attachments

  • Trading Range Example 5 10-3.PNG
    Trading Range Example 5 10-3.PNG
    82 KB · Views: 6
  • THursday 10-3 Markup.PNG
    THursday 10-3 Markup.PNG
    95.1 KB · Views: 5
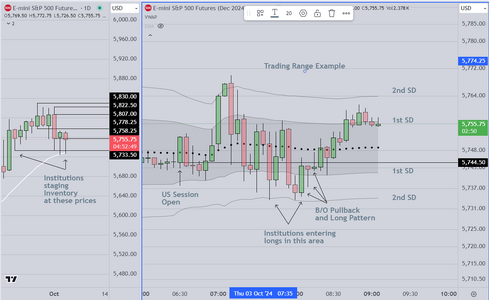
This will be my last chart today

As can be seen on the daily chart to the left
Institutions use previous lows (also known as "Failed or Weak Auction Prices"
as places to build positions. They wait for a retest and then put money to work
to move inventory up from these points. At the same time, they may sell options
to add a low risk profit element to their longer time frame strategy (obviously
the strategy works on the short side as well).
 

Attachments

  • Mid Morning Markup.PNG
    Mid Morning Markup.PNG
    101.7 KB · Views: 7
Last edited:
Here is my "End of Session" Markup

Readers reviewing the previous posts will
see how we prepare, and create scenarios
What they cannot see, is the way that we
adjust our plan as the session develops
Unfortunately did not have sufficient room
for additional students, so this will have to
be sufficient for now.

Additional Note

In the previous chart(s) I sometimes show 5 min candles
and at other times I show 15 min candles. In my room I
encourage retail traders, particularly those who have been
unsuccessful, to transition to 15 min, because it seems to
help with making better decisions. The chart below shows
how a trading range is approached using 15 min candles
 

Attachments

  • Thurs end of session Markup.PNG
    Thurs end of session Markup.PNG
    113.4 KB · Views: 8
Last edited:
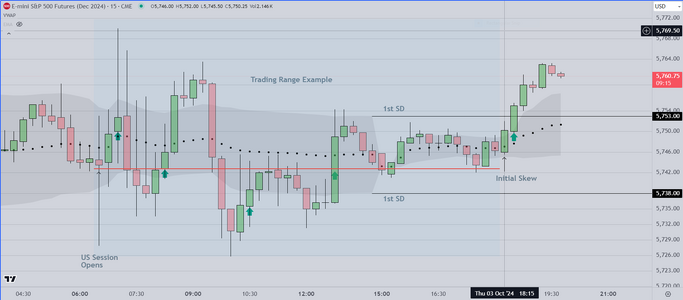
Here is the version of a 15 minute chart that I suggest for retail traders
who may be having difficulty. It removes all but the most essential data
and it shows the initial skew, which is critical for making fully informed
decisions
 

Attachments

  • Simplified Retail Chart.PNG
    Simplified Retail Chart.PNG
    80 KB · Views: 7
Top