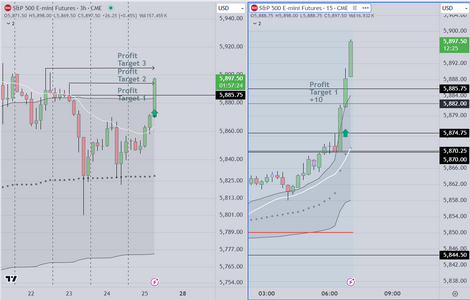
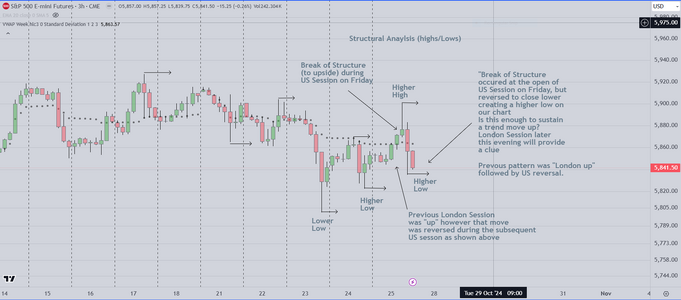
Referring to the previous post, we offer the following comment
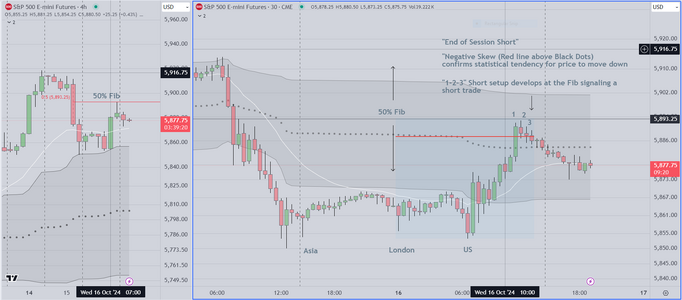
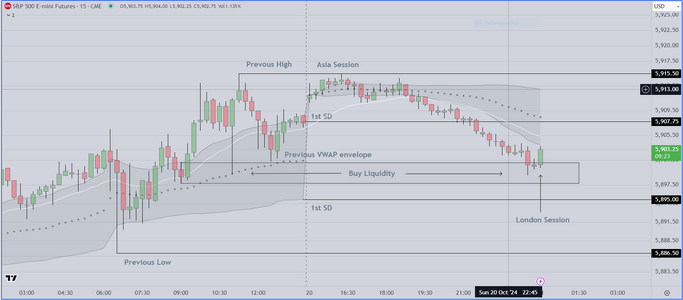
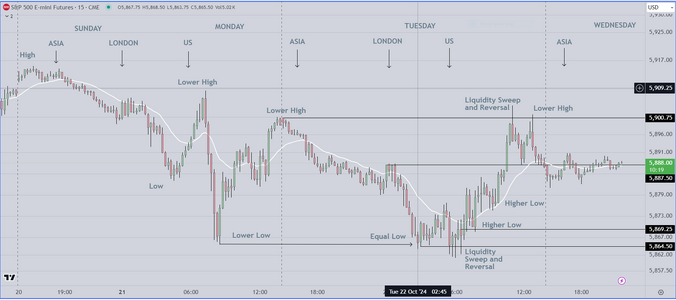
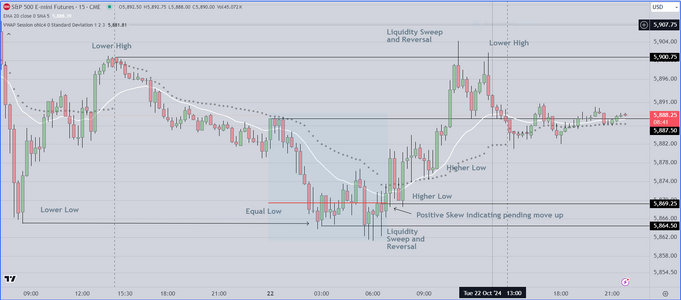
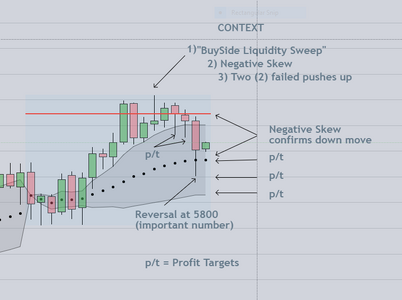
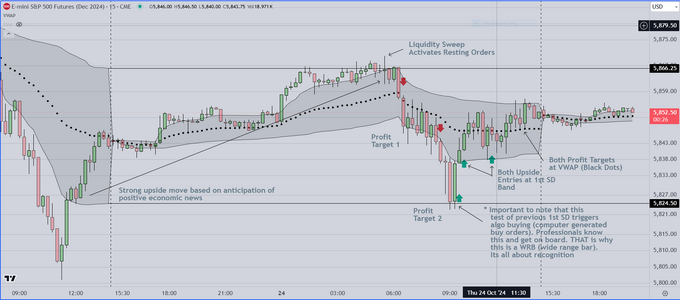
1) Overnight (US time) Asia drifted down from the open (as often happens)
and at the open of London Session, price reacted up briefly, but failed
and the distribution expanded to the downside. This is critical information
for the professional trader. Why? because it is counterintuitive. The initial
reaction up was five (5) points (a scalp). Normally that would have been
followed by another 5 point swing to the upside. What matters is the LOGIC
behind this behavior. I interpreted it as follows
Critical Importance of Understanding "Context" & Market Logic
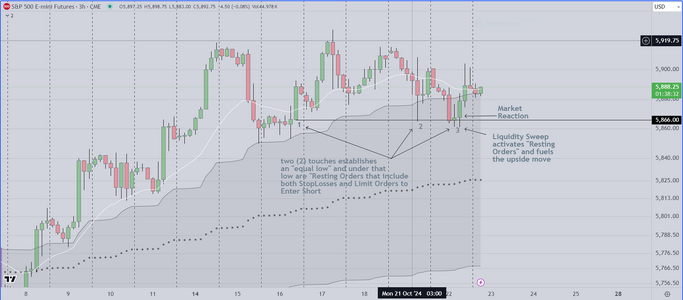
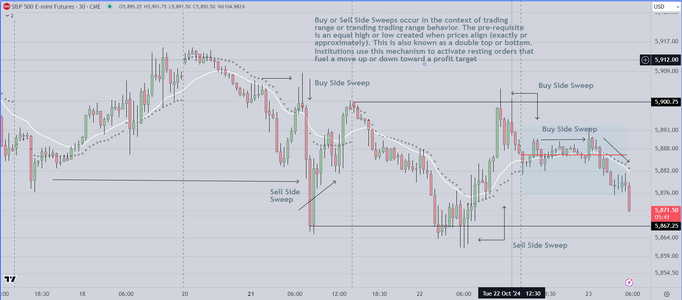
2) On a Monday, anticipating significant earnings reports, institutions will protect
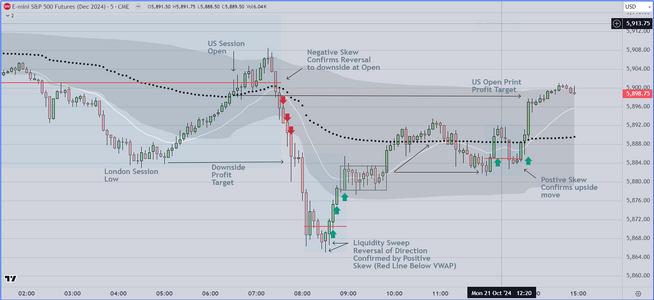
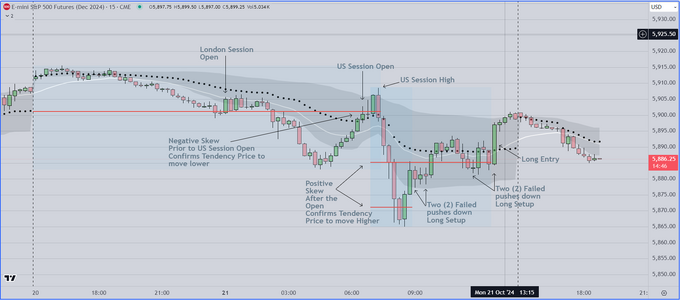
profits using the London Session as a "Pivot". Notice that London opened and
moved down, followed by a late session reversal to the upside. Then at the open
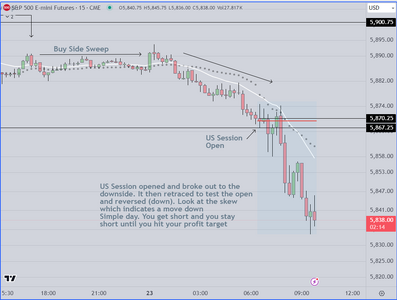
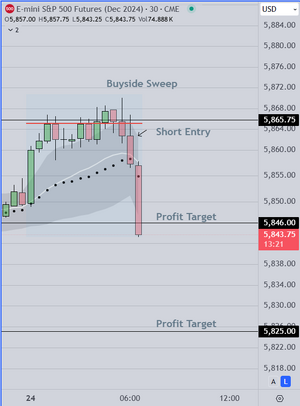
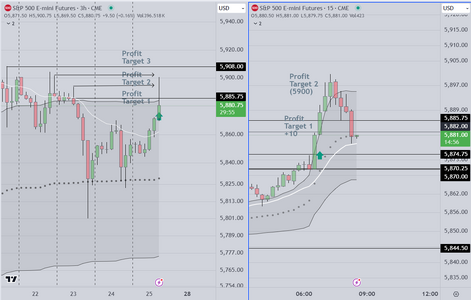
of the US Session, price attempted to take out 5900 but could not. Notice that
the Skew was negative (above the VWAP) confirming the statistical tendency
to move down. Institutional computers calculate this and send sell orders. As
price closes BELOW each "Key Reference" (the Standard Deviation Band, and
the VWAP), it signals other institutions to "Go With" (Sell the Market Down)
and that is what they do....this short setup had very high odds of success, and once
the students heard the logic they took the trade. A solid early profit to start the session.
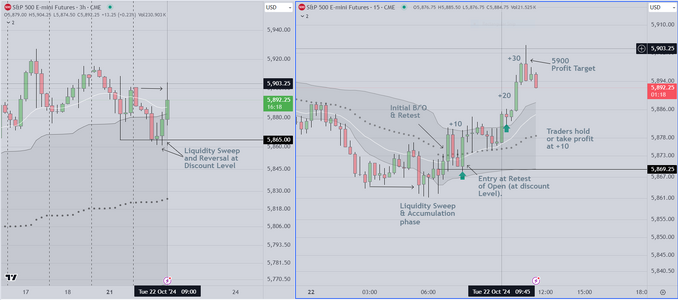
After this early move down, institutions slow down and wait for prices to stabilize
At the low, we see price RE-ENTER THE VWAP ENVELOPE FROM BELOW AND the skew
reverses (see the chart). This signals a) accumulation at discount prices, and b) a reversal back up
Prior to the US session open, during our review, students asked the obvious question
how can I know this, and aren't there other equally valid scenarios? The answer is yes,
of course there are other ways to interpret the data, however after more than fifteen (15)
years of experience and thousands of hours of screen time, I have a record that I can trust,
and so I take the trades (and hold my position) and if I am stopped out, (suggesting that I
am wrong) I make the appropriate adjustment. Today worked out as forecast.
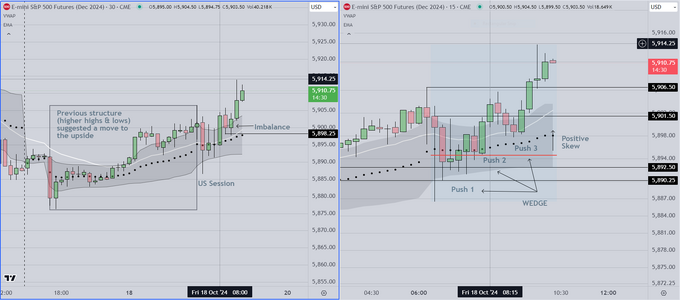
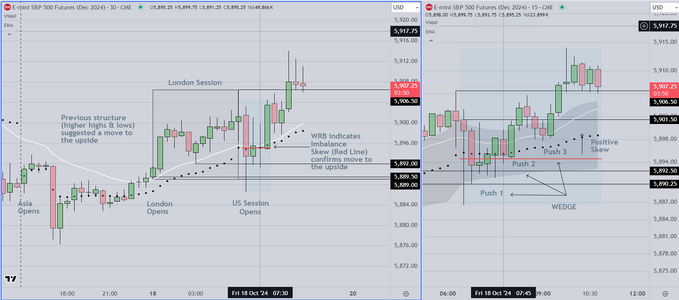
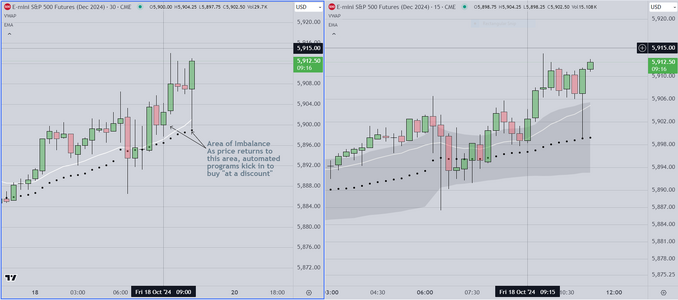
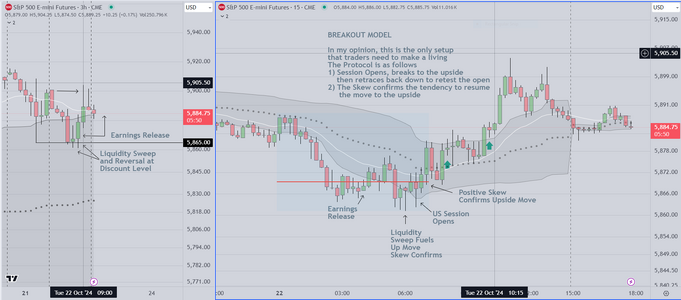
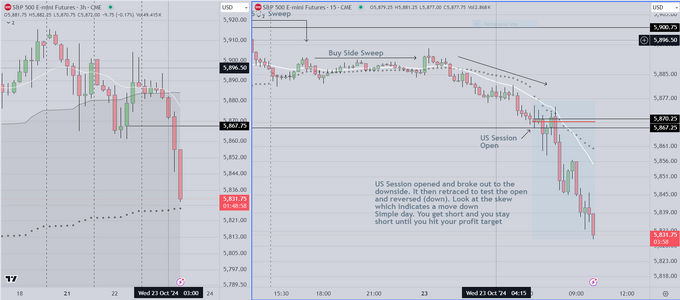
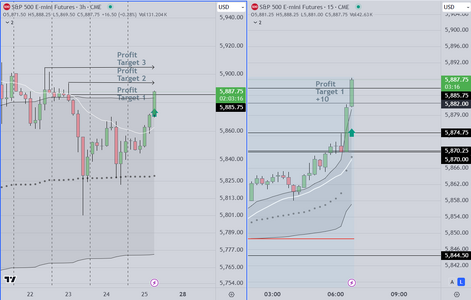
The Markup chart shows the skew at various intervals throughout the session. I notice that
there are many YOUTUBE traders who suggest that they know how to do this, and explain
THEIR logic using all kinds of jargon. As far as I can tell, the skew is the only volume based
tool that works consistently, when used in a skillful way (anchored and interpreted properly)
I notice that there are no other "Internet traders" using it, and that is understandable. Early
in this and my other thread, I suggest that struggling traders take the time to learn basic
statistics. Interestingly the response was negative. I get it, but remind folks that the time is
going to go by anyway, and without the proper background, I don't see how a retail trader
can complete. In the long run, they will give back whatever they win using various indicators.
Good Luck

