You are using an out of date browser. It may not display this or other websites correctly.
You should upgrade or use an alternative browser.
You should upgrade or use an alternative browser.
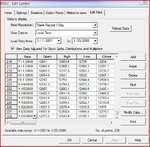
The settings seems to be fine- just to confirm-do you have downloaded data more than 2 days?
Raj
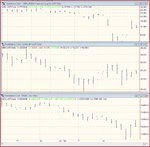
Yes, could well be a data problem, i pulled up a few charts, and i either got one too many day bars in the stocks, or one too few day bars in the indu
glen
Attachments
Glen,
I would try putting this into a new RS screen intra-day on Monday and see if it will work rather than EOD as you have it now just as an independent check.
Paul
will do Paul, however I think i would like, if possible, to use this EOD.
If i was going to short a basket off the weak list, it would be nice to know that they were not strong against the market in the last few days before entry.
thansk
glen
The settings seems to be fine- just to confirm-do you have downloaded data more than 2 days?
Raj
yes, seem to be missing data from Thursday for INDU
might be a problem with Yahoo? not sure
ta
glen
Attachments
Yes, could well be a data problem, i pulled up a few charts, and i either got one too many day bars in the stocks, or one too few day bars in the indu
glen
Sometimes, for the intraday charts, the diveg ind does not indicate in my RS when I open the prosuite program but starts to indicate with 'live' streaming data after market opens (not sure if it makes sense )- so if you try what Paul has suggested then maybe it'll start to work...
Raj
Sometimes, for the intraday charts, the diveg ind does not indicate in my RS when I open the prosuite program but starts to indicate with 'live' streaming data after market opens (not sure if it makes sense )- so if you try what Paul has suggested then maybe it'll start to work...
Raj
my only problem with this, is i can not stream live into all of the weak list, only 50 symbols with IB.
i'll play about with it tommorrow night, see what happens
thansk
glen
yes, seem to be missing data from Thursday for INDU
might be a problem with Yahoo? not sure
ta
glen
Must be something to do with streaming, and not data incorrectness. As i added a bar for INDU on Thursday, and it didn't make a difference
glen
my only problem with this, is i can not stream live into all of the weak list, only 50 symbols with IB.
i'll play about with it tommorrow night, see what happens
thansk
glen
Hi Glen
Apart from any technicalities regarding getting the indicator to function, I wonder why you want to use anything more than the macci anyway. As we have been told, if its OB/OS and turning then that is the 'signal' along with overall market direction. Why add something alse to look at for daily swings?
Just my thoughts.
Cheers
Steve
will do Paul, however I think i would like, if possible, to use this EOD.
If i was going to short a basket off the weak list, it would be nice to know that they were not strong against the market in the last few days before entry.
thansk
glen
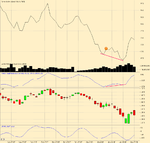
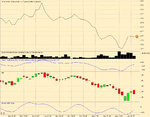
Attached an equi-weighted index of 44 stocks from Grey1's weak list of 1-10-2008. Notice the divergence of the true strength index (ergodic).
This is posted as an observation only - in other words don't read too much into it.
The other observation I would make is that some of the industries that have been real dogs of the last six months have been the best performing over the last week or so, with quite dramatic spikes. Whether this is a more long lasting sector rotation remains to be seen.
Attachments
Hi Glen
Apart from any technicalities regarding getting the indicator to function, I wonder why you want to use anything more than the macci anyway. As we have been told, if its OB/OS and turning then that is the 'signal' along with overall market direction. Why add something alse to look at for daily swings?
Just my thoughts.
Cheers
Steve
Hi steve,
I was just going to use it as a safety filter. i.e. don't enter a short if the stock is strong against the market even if the MACCI is overbought
ta
glen
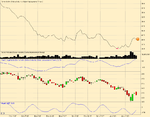
Attached an equi-weighted index of 44 stocks from Grey1's weak list of 1-10-2008. Notice the divergence of the true strength index (ergodic).
This is posted as an observation only - in other words don't read too much into it.
The other observation I would make is that some of the industries that have been real dogs of the last six months have been the best performing over the last week or so, with quite dramatic spikes. Whether this is a more long lasting sector rotation remains to be seen.
this is very interesting, i like your work in this area
thanks
glen
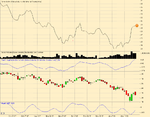
Some dogs of industries that have bitten back (industry classification from Yahoo finance)
Retail, real estate, building have bounced
how do you use this information in pracitical terms?
are you looking for money flowing from one sector to another?
what sectors are now doing badly as result of these sectors spiking?
thansk
glen
this is very interesting, i like your work in this area
thanks
glen
I have been developing my own screener (technical and fundamental) in Java. It has taught me a LOT about stock trading and market behavior. Grey1's stuff is invaluable and a great motivator.
I'm at the point where I don't need Tradestation, RadarScreen or eSignal etc etc, with the huge bonus that if there are problems or features I need, I can make the requisite changes very quickly.
How do you incorporate fundamental data in your scanner and where do you get this data from?
Thanks,
Imran
how do you use this information in pracitical terms?
are you looking for money flowing from one sector to another?
what sectors are now doing badly as result of these sectors spiking?
thansk
glen
To be honest, I'm not quite sure at the moment. I'm in the process of going back over several years of market history, trying elicit some common traits.
My hypothesis is that sector rotation may be pronounced at climatic sell offs. I may be completely wrong in this.
Yahoo Industries with worst relative strength over last 5 days are Personal Computers, Health Care Plans, Drug Manufacturers, Other health industries, biotech, telecom etc
How do you incorporate fundamental data in your scanner and where do you get this data from?
Thanks,
Imran
Screen scraping from Yahoo finance. For non-US stocks (which I am interested in for time zone reasons) I'm looking for other sources. (For the technically inclined, I use JTidy to clean the HTML pages and convert them to well formed XML, which is easier to deal with).
At the moment, it's a bit crude eg sort/screen by such things as price/book, PEG, current ratio, etc etc - just the raw data from Yahoo.
I've only a couple of months of fundie data at the moment, and don't have any fundie screens showing any edge, but I've got some quite interesting technical screens. One of the more interesting is to sort by the Sharpe ratio of a stock - long the highest and short the lowest.
Last edited:
Screen scraping from Yahoo finance. For non-US stocks (which I am interested in for time zone reasons) I'm looking for other sources.
At the moment, it's a bit crude eg sort/screen by such things as price/book, PEG, current ratio, etc etc - just the raw data from Yahoo.
I've only a couple of months of fundie data at the moment, and don't have any fundie screens showing any edge, but I've got some quite interesting technical screens. One of the more interesting is to sort by the Sharpe ratio of a stock - long the highest and short the lowest.
Thanks very much for the info.
Regards,
Imran
Glenn
Experienced member
- Messages
- 1,040
- Likes
- 118
Must be something to do with streaming, and not data incorrectness. As i added a bar for INDU on Thursday, and it didn't make a difference
glen
Glen
I've found that some EL Radar code doesn't deal very well with the end of one day and the start of the next. To me its a TS glitch. As others have said you'll probably be ok once you get some intraday data going.
If you look for Daily OB stocks you can just Connect those (up to 50) in Globalserver to update intraday and leave the rest to update with EOD data.
(Thinks - I'm sure I had more than 60 tickers running in Radar a while back before my PC problems. Is 50 the limit or not ?)
As Evostik says, not sure you need the Diverge anyway unless you are doing something different. I don't use it but wonder anyway whether it was intended for use in the Daily timeframe ?
Glenn
Hi steve,
I was just going to use it as a safety filter. i.e. don't enter a short if the stock is strong against the market even if the MACCI is overbought
ta
glen
Hi Glen
I guess you could write a simple indicator that just tells you, for example, the percentage price change in the last X periods (X being set as an input). In the list include the indu itself, Then just sort the column by change in %. Those above are strong relative to INDU etc.
Just thinking outloud and this might be silly?
Cheers
Steve
Similar threads
- Replies
- 309
- Views
- 114K