A Professional Approach to Trading Futures

I am done for the day and wanted to publish
this version of the Simple Retail Chart, that I
will be using in my next class

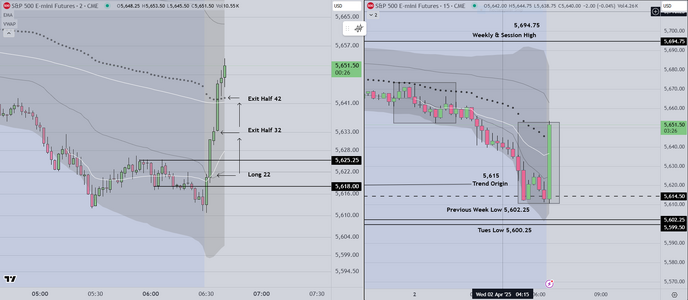
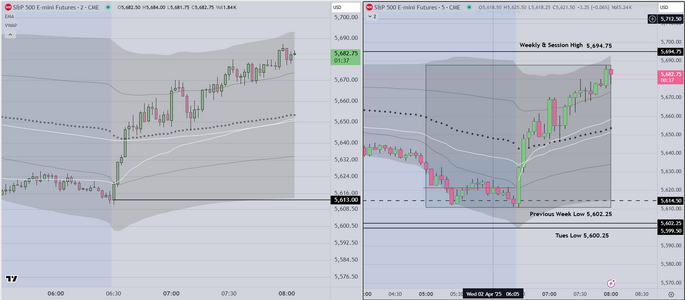
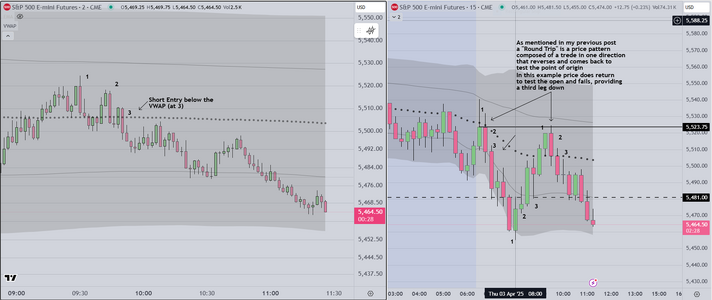
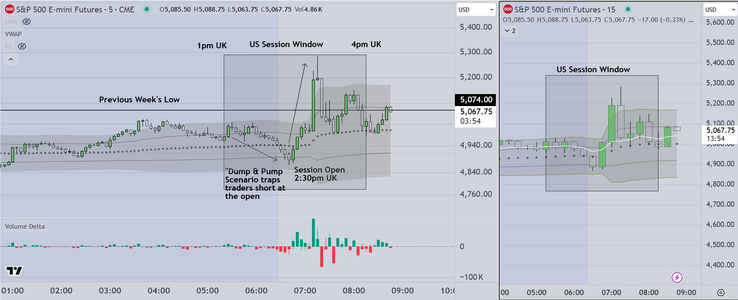
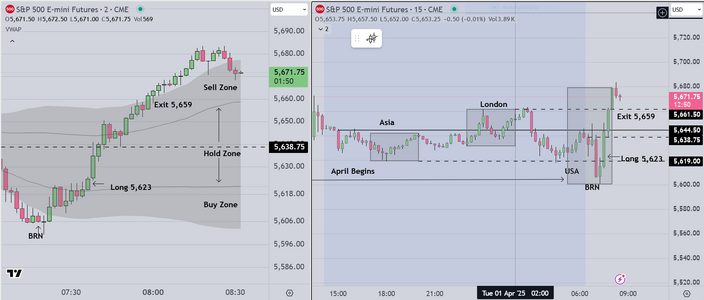
On the left, two (2) minute candles against a
stripped down VWAP Envelope (I have removed
the VWAP median). On this chart one can see the
Buy & Sell Zones, located between the 1st & 2nd
Standard Deviation Lines. Basic parametric statistics
tells us that most (about 2/3rds of prices will fall inside
these lines, AND when price action is "Trading Range"
it will tend to move from the outer bands to the midpoint
and when price trends it will often move from the one side
to the other.

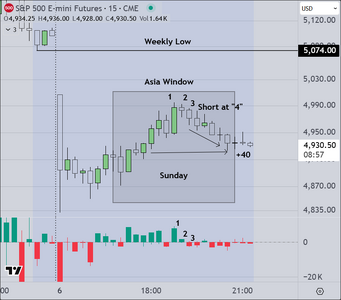
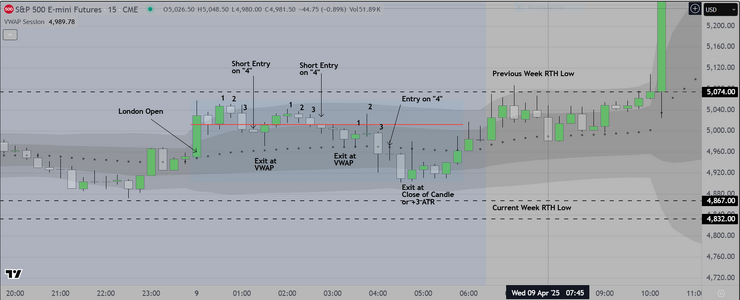
On the right side, the "Big Picture" showing the "Timing Windows"
representing Asia, London and US Sessions. Each is three (3) hours long
and within each window is almost always a trading opportunity. We
suggest students trade within these windows to maximize opportunity
and minimize losses while they learn. Finally the relative position of
the Windows can be used to determine whether the market is trending
or in a trading range (just extend lines from the high/low).

We spend a lot of time showing traders the basic tools of the trade
including 1) VWAP, 2) Volume Profile, and 3) Statistical Skew.
What these three tools have in common is, they are all based on
volume. We have also used "Order Flow" in past and it works IF one wants
to put in the time, however the influence of HFT (high frequency trading)
has made it very difficult for retail traders to learn that style of trade. This
in our experience is much more accessible for amateurs.

Good luck
 

Attachments

  • Simplified Retail Chart Example.PNG
    Simplified Retail Chart Example.PNG
    125 KB · Views: 41
Last edited:
Today was an example of an "Event Day" and we start
by marking up the right side of our chart, to show the
weekly & current session highs & lows.

The value added after the basic markup is about experience
as follows

1) We know that institutions will move price from one extreme to
the other (highs to lows and reverse). This is "known" by experience
AND simply reviewing previous week and month price action

2) Given the tendency for price to "Dump & Pump", reversing at lows
we prepare for that by monitoring the overnight market. Notice the boxes
showing Asia/London moving price down to retest the lows.

3) Is it coincidence that price is at the low at the open of the US session of
S&P Futures.. Hardly. Asia and Euro drive the market down, and stage inventory
at the low, ready to profit from the reversal. It is called "Cooperative Signaling"
We have talked about it previously.

4) At the open, we monitor short time frame candles (we prefer 2 min candles)
As price moves up, we see that the first candle is "strong", so we enter and hold
for minimum +10, leaving a runner in place

With Trumps comments scheduled for later today, we will likely close our book of
business early (to better manage risk)
 

Attachments

  • Event Trade 4-2-2025.PNG
    Event Trade 4-2-2025.PNG
    120.5 KB · Views: 15
As mentioned we are done for this session and wanted to offer a
further observation

Notice in the post above (item 2) we mention that we start to monitor
what is for us, the overnight markets (Asia/London). Notice also that
during these sessions price trends lower. The reason is obvious

Finally notice that when price reverses, at the US session open, that it
moves ALL THE WAY BACK UP to the London Open. This is by design
We have mentioned the concept of "Cooperative Signaling". Market
participants, are working together to move markets in such a way as
to provide each other the opportunity to make money at both ends
(long & short). Look at the previous session. See how similar the patterns
are.
 
Final post today

We show an adjustment that we incorporate to provide retail traders with
a few more high odds trading opportunities

On the right side of the screen we change from 15 min candles to 5 min
and we add anchored VWAP/FRVP combination. As was mentioned in response
to a question from a member, when used in a disciplined manner it provides a
significant edge.
 

Attachments

  • Trading Diplay at 8am.PNG
    Trading Diplay at 8am.PNG
    130 KB · Views: 16
I used the 15 system today
and it continues to work well

I have a couple of previous students observing
and they recognized the setup and entry quickly

Easy day so far
 

Attachments

  • Trading with 15 Min Candles.PNG
    Trading with 15 Min Candles.PNG
    115.4 KB · Views: 12
This followup chart shows traders taking profits
at the previous low (as expected)

+10 and +10 for the runner left in place

and finally, I suggested to those watching that this
is the time to walk away with money and not risk
losing it later in the day. This (if I may) is the way
that retail traders can learn to making a living
(a good living) by intelligently managing risk.

Postscript

I removed the prior chart, replacing with one that better documents
the market "logic" as follows

The initial thinking is that the market is likely to "gap & run" on the open
because of concerns about the effect of tariffs on the American economy
This is simple, and obvious. The setup continues to be a 1-2-3 algo
and the 15 min chart shows the predominant price action clearly with institutions
making money on the downside initial move, then (I assure you) they will
reverse and take it back up trapping traders on the wrong side, while making
a lot of money on the impulse move up

Good luck
 

Attachments

  • Follow up Thurs 3 Mar.PNG
    Follow up Thurs 3 Mar.PNG
    116.7 KB · Views: 14
Last edited:
Here on the West Coast USA, it is 9am and I am
heading out to get breakfast

As the chart shows the anticipated reversal did in fact
trap traders on the wrong side and has already provided
+10

Professionals call this a "round trip"

Good luck
 

Attachments

  • Round Trip.PNG
    Round Trip.PNG
    53.9 KB · Views: 15
Have just returned from inspecting my new home
construction, and thought it would be instructive to
post this follow up

The "round trip" I referred to previously has completed
As the chart markup states, a "round trip" trade consists of
a move in one direction, followed by a reversal back to test
the point of origin. As seen in the chart attached, price returns
to test the US session open. This is programmed by institutions
and is the reason I am able to forecast it with some confidence.

After that sequence completes, we see a third leg and all three
could have been traded using my preferred 1-2-3 algorithm

The two minutes candles on the left side of that chart show a 1-2-3
setup with entry just below the VWAP. Again this is not coincidence
programs are constantly monitoring price action and activating orders
to "hunt stops" and to create signals that other institutions use so that
they know where to add or subtract from base positions. For those
who may not know. the top tier institutions trade using a method called
"always in", meaning that they maintain a baseline that is net long or
short, and they add or subtract as the day proceeds. Using one of several
tools, I am able to see where they add or subtract, then I simply "go with"
the flow.


Good luck
 

Attachments

  • Round Trip FollowUp.PNG
    Round Trip FollowUp.PNG
    120.2 KB · Views: 13
I felt that it was time to modify my charts, to provide a different visual
Works well for me

This chart shows a specific trade that happens at the end a trending
session. What I want to suggest in this analysis is the importance of
learning to monitor how volume changes at specific times as follows

As always we start by referring to a price pattern on the left. One principle
we teach is for students to learn to prepare to trade by "scanning left" to
see if there is a previous price pattern that will affect your entry. What we
see on the left in this chart is called a "Trend Origin". This is always the 2nd
candle in a trend. When price comes back to this price, skilled traders know
that it may affect how price acts at the point of retest.

Setup Analysis

We look at the volume associated with each candle in our 1-2-3 setup.

1) Candle 1 = 30,000 contracts. Green candle of average size compared
with previous candles (scan left), buyers in control.

2) Candle 2 = 33,500 contracts. This candle shows us that sell volume entered
in sufficient numbers to cancel out the previous candle, and it suggests a possible
reversal.

3) Candle 3 = 28,000 contracts and the candle shape is a "doji" with a "buyers tail".
This tells us that buying volume came LATE during the candle formation. It means that
the algos (computer generated buys) were activated at a specific price to try to reverse
price to the upside, however the buying volume was not "aggressive" and so the attempt
is considered to have failed

The obvious entry is a stop order short at the open of the next candle, with a stoploss
at the top of the previous candle, and a profit target at the previous low (minimum).

Skilled professionals look at this using a "Footprint" or simply monitoring individual candles
as I do. Doesn't matter how you do this, only that you know that it is possible and that it
can provide an edge, IF you can learn the discipline.

The advantages of learning this method are many

1) You can see how important it is to learn to monitor volume, how it gives you a real edge
and makes the decision process easier
2) It provides the emotional support that retail traders need, to know when to pull the trigger
and to stay in a trade longer (you can continue to monitor volume as the trade progresses.)

I do this every day. What it instills in a trader is called "Positive Mental Control"....YOU are in control
not the market. Nothing happens that you can't see and explain in simple terms.

Good luck
 

Attachments

  • Trend Day EOS Trade.PNG
    Trend Day EOS Trade.PNG
    59.9 KB · Views: 12
Last edited:
Interested readers will find a markup of the Asia to London
session, and inside that chart we focus on a timing window
composed of 15 min candles. The purpose of the "window"
is to narrow the focus, to a time period that we know (from
experience, should produce at least one tradeable setup

We use a similar technique for the London and US sessions
as well.

Our preferred setup is an Algo (1-2-3) that is accompanied
by a specific volume pattern. If that pattern or something
very close to it, doesn't happen, we simply move on to the
next "window". The Asia session is usually not one that we
trade, however it is volatile because of the Trump tariffs
and so we anticipated this setup. We will get some sleep
during London Session and be ready to go, for the US
which should be (again) volatile. Our approach will be
to scalp +20 per trade, and to find four (4) opportunities

Good luck
 

Attachments

  • Asia Example Sun-Mon.PNG
    Asia Example Sun-Mon.PNG
    53.2 KB · Views: 11
Good Afternoon London

We are done for the day here in the US

The Markup shows a scenario that professionals know
by the quaint colloquial phrase "Dump & Pump".

The added tool that we have introduced is a session timing window.
The window is usually about 3 hours (give or take) and within the
window, the trader's objective is to identify specific setups and obtain
a minimum profit that varies according to volatility. We look for
previous volatility of about 3 ATRs

In this environment, we look for the big institutions to try to trap traders
on one side, then reverse the market to the other side, so that the trapped
parties have to decide whether to stand aside and watch or "chase the market"
Commercial traders who are paid to make money (not to stand aside) will generally
chase, and the orders they input as the market moves, are what extend the move

This is simple "market logic" and skilled operators know it, they identify it, and then
depending on their skill level, make decisions as to when to trade, and how long
to hold

My guess is that the retail traders who may read this have no clue as to how to proceed
If that is the case, they may want to start by reading this, and considering 1) whether
to pursue trading as a profession, or leave it to others and go on about their day jobs.
or 2) learn how to think in a similar way about how (and why) the markets move as
you are seeing today.


Good luck
 

Attachments

  • Dump & Pump Example.PNG
    Dump & Pump Example.PNG
    139.5 KB · Views: 10
Our final post for the day

This expanded chart includes the London Session
and shows readers that Euro Institutions engaged
in the same behavior during this time frame. This
would have looked similar for DAX and FTSE

Postscript

For those interested, one of the reasons we now use
a "timing window" is to prevent being caught if the market
"circuit breaker levels" are hit. We do not want to be in a
position, with the market halted, and then have to wait, while
the markets reprice. It is also a risk management tool.

for those interested in the details, the NYSE would halt trading
if the market were to drop by more than 7% (stage 1) and after
that to more than 13%, (stage 2) and finally if the market were to drop
by 20% (stage 3) another halt would occur. I believe that would halt
the market for the rest of the session. Professionals know this by the
term "locked limit down". A perceptive reader might see that institutions
also do not want that to happen, and THAT alone is reason for them to
activate buy orders and engage in the "dump & pump" scenario. Are we
on the same page now?

Good Luck
 

Attachments

  • Expanded View Dump & Pump.PNG
    Expanded View Dump & Pump.PNG
    119.7 KB · Views: 12
Last edited:
We attach a special chart that (at least tries) to show
a cyclical scenario that is known as "Pump & Dump"
or (conversely) "Dump & Pump".

The primary framework that we trade is weekly. We look
for the market to make what we have called "Round Trips"
between the highs & lows of the previous week.

We also try to inform students about the tendency of the
market to "trap" traders either "into" bad trades, or "out of"
good ones. The general rule is to ask yourself (before pulling
the trigger) "trade or trap", which is this likely to be?
The correct answer is that it depends on whether the trader
has done their homework (analyzing the previous week's charts)
If they have, they know that there are certain prices & times, that we
call "hold ups" where the market oscillates up and down, trying
to attract orders. Once they have attracted enough orders on one side,
the big institutions come in with large volume to reverse the market,
and move away, leaving one side "trapped out" of a strong move.
Those stranded traders, usually chase ("fear of missing out") and these
late orders fuel the larger move

This is an unusual time in history. This last week in particular has been a significant
opportunity for us, and we have been lucky to have a reasonably accurate understanding
that works. Readers will notice that we post less as time goes on, and if the economic
conditions worsen (as we believe they will), we will stop and concentrate on maximizing
our presence in the markets.

Suggest readers ask any questions they may have in the next week or so, while we are still
available.

Good luck
 

Attachments

  • Cyclical Scenario.PNG
    Cyclical Scenario.PNG
    116 KB · Views: 11
Last edited:
We stayed up to trade the London Session
which starts at Midnight US time.
Three easy trades based on the premise that
Institutions will not move the market very far
until after the FOMC meeting minutes are released
which would be about 2pm London time.

The Skew was negative and the preferred setup is
a 1-2-3 algo, with entry anytime after "3". We generally
scalp this kind of day, and the volatility is measured
in ATR's. In our class we go through the process of
measuring ATR so that the student can know where
to exit at maximum profit. This part of the curriculum is
critical because the major institutional & commercial
firms use ATR (average true range) data to make most
decisions, in fact some commercial traders construct
their entire trading strategy around that data, entering
after the market move a certain number of ATR's, exiting
after an anticipated reversal (for example)

We are a bit sleep deprived and so will probably not post
again today

Good luck
 

Attachments

  • London Session Trades.PNG
    London Session Trades.PNG
    106.7 KB · Views: 12
Thanks for your work. If it isn't too rude, could you change the way you present the trades into something that is clear where entry, exit and stop loss are?

Sorry to be a pain 🙂 but I think it is more beneficial for everyone
 
I understand your comment.

I don't think you are being rude. You may however want to consider the following

I am trading a total of ten (10) contracts, and in high volatility "regimes", I enter
in units of three (3) at a time. My preferred setup is represented by a 1-2-3 algo
For a long setup, the first candle is "1" and is red (a down candle), the next candle is "2"
and is a green candle, and candle "3" is also green. Entry is at the open of "4". Stoploss
is critically important, and is determined by some multiple of "ATR". Profit targets are
also determined by "ATR" and most retail traders are not familiar with how ATR is used.

A short setup is composed of a green candle ("1") followed by a red candle ("2) and another
red candle ("3") with entry at the open of "4" (also presumably a red candle). Stoploss & profit
targets determined by use of Average True Range (ATR).

In future I will try to outline the specific entries, however I anticipate that amateurs will discover
that they cannot trade as I do, because they simply don't have a suitable account size OR they
are risk averse, and cannot stay in a trade while it "presses" their point of entry. This is why
commercial traders who trader OPM (other people's money) are able to do what they do, and
why big institutions are able to move markets.

What I CAN do is to point out how retail traders can minimize the emotional stress of trading
by being very selective about how they choose to enter (based not only on price, but also with
regard to timing), AND to choose the right markets to trade. For example, an aspiring retail
trader might want to consider 1) trading sim, or the 2) MES contract rather than the "big" S&P
contract, or even 3) trade a few shares of SPY if they wish to put funds at risk. Personally I would not
suggest that anyone trade live until they have proven to themselves that they can make a consistent
profit using a sim account.

Good luck
 
Last edited:
Here is a revised chart, where I have spread out the candles
so that I can document the 1-2-3 setups

The first two are classic, the third is a special case, and what makes
it "special" is the pin atop the candle which tells us that buyers attempted
to move the market higher, then sellers came in to overwhelm them and
drive the market down. THAT by itself was the primary factor in deciding
whether to take that trade.. I assumed (because the skew was increasingly
negative), that price would breakout through the bottom of the VWAP envelope.
As readers can see it did not breakout to the downside, however it did result in a
very profitable trade.

So those who thought this was an improvement, please do ask any questions
but do understand that I am not going to go into detail as regards ATR. In previous
posts I suggest strongly that readers learn the basic math (mostly statistics, but certainly
to include this important tool). Most respondents demurred, and did not want to take
the time to get that background.

As I can (and will) say again, the time is going to go by anyway. You can invest in yourself
or you can let the markets run over you time after time.

Good luck
 

Attachments

  • Revised Chart.PNG
    Revised Chart.PNG
    97.4 KB · Views: 10
Last edited:
As with most things in life
I learn more from my failures than from
my small successes

I missed this trade. I was looking at the screen
as it developed and asked myself "trap or trade"
as I was trained to do. I thought it would be a trap
and reversal. Instead it was a continuation/leg 2
down. The setup was valid

My "after action" report on this will include the
analysis of volume. Those who can, should look at
the volume of each of the bars (I did not) and they
will see steadily increasing volume of each of the
down bars, signaling that sellers were continuing
to enter, and not enough buyers to reverse direction
So the important lesson to learn is "don't be mentally
lazy, when price is stalled and just oscillating, take time
to check the volume of each bar, in order to help you
make decisions"

For me, this was a lesson also about getting enough sleep
I should know better than to trade when sleep deprived.

Lesson learned (again)

Good luck
 

Attachments

  • Leg 2 Example.PNG
    Leg 2 Example.PNG
    68.7 KB · Views: 7
Back
Top