A Professional Approach to Trading Futures

Mentioned this in a previous post

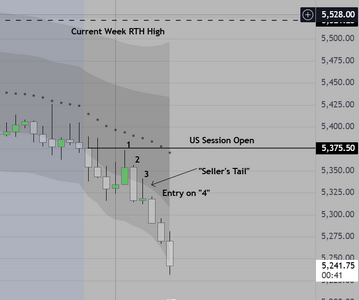
This is a special example of a "1-2-3" setup
where one of the candles has a long tail, which
we call either a "buyer's or seller's tail". This
type of candle suggests that price was moved in
one direction initially, then failed as the other side
came in (more aggressively) to reverse. In the right
context it confirms that the reversal will continue
 

Attachments

  • 15 minute exmaple.PNG
    15 minute exmaple.PNG
    41.9 KB · Views: 23
This will be my last post today

Readers please make note of the timing of
this post. Here on the west coast USA it is
12:26, and in London 8:26

In thirty minutes, if one were to monitor
volume on the S&P Futures, you WILL see
a significant spike in volume followed by
continuation. This is known in my world
as "last call". Does not always play out
(nothing does) however this one trade
can sometimes make your day.

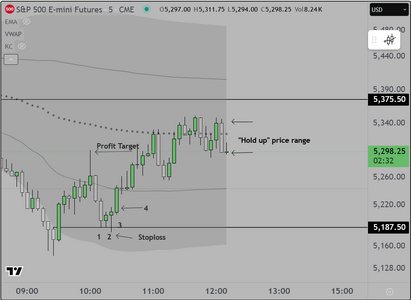
The attached chart shows an example of
what professionals call "Holdups or hold up prices"
In this range, institutions fight it out to see which
side will control and create a final "leg" up or down
and of course, sometimes neither side wins and
the market simply moves sideways into the close

Good Luck
 

Attachments

  • Late Reversal & Holdup Example.PNG
    Late Reversal & Holdup Example.PNG
    58.8 KB · Views: 9
Before I walk out the door I have time
for this last post

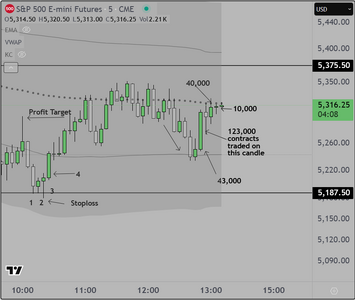
Here is the chart showing the volume
spike at 8:55 London time

Notice the big difference between the
preceding and following candles. We call
this a "tell" and in my class I use it to show
students how to position themselves, once
they have done their post market analysis
Unfortunately I don't have the time or resources
to go into more detail in this forum

Good luck
 

Attachments

  • 0855 Candle.PNG
    0855 Candle.PNG
    59.9 KB · Views: 8
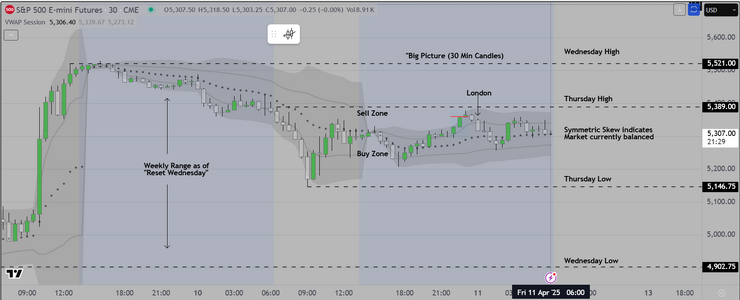
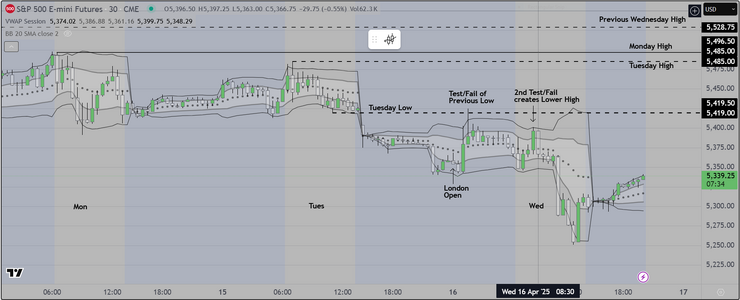
Here is our starting "Big Picture" 30 min candle chart Markup
showing the range as of Wednesday.

Professionals will "Reset" the market on Wednesday, creating a new
range from which to trade. Within that range we look for signs that
institutions are likely to buy the low end, or sell the highs. Of course
there are times (now for example when we are in the middle and we
wait for economic news to provide the impetus for movement in either
direction. Today the US market will start "in balance". When this happens
we look for breakout trades at specific times (3pm London for example)

London provided a nice short opportunity as seen on this chart. We do not
have time to provide entry details, since our market opens quite soon. We may
do that later if time permits

Good luck
 

Attachments

  • Wednesday Reset Example.PNG
    Wednesday Reset Example.PNG
    129.5 KB · Views: 8
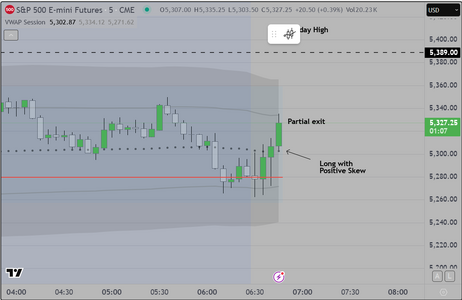
First scalp trade off the open today

We post this one, but will stop at this point
to concentrate on the work at hand

Good luck
 

Attachments

  • Initial Scalp 4011.PNG
    Initial Scalp 4011.PNG
    61 KB · Views: 7
Done for the day

Today was a easy day. Once we identified
the price behavior as "trading range" we made
the required changes as follows

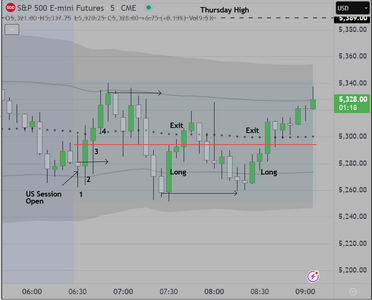
1) We change from 15 mn candles to 5 min candles
2) Entries are restricted to the Buy & Sell Zones which
are represented by the 1st Standard Deviation Lines of
our VWAP envelope
3) The first trade is (for us) usually a scalp and so we used
our preferred 1-2-3 Algo with entry at the start of "4"
4) From that point forward we entered at the edges of the
1st SD, trading from the long side only, because the skew
changed from symmetrical (neutral) to positive (long only).
This indicated to us that the institutions were looking to move
the markets higher, trapping participants as they accumulated
inventory for the late day move (which obviously has not happened
yet).

So the way we train students to act in this context is simple. We provide
a "timing window". For the US session that window extends from 1pm
to approximately 4:30pm London time. Within that time frame we show
them how to obtain a reasonable profit by a) identifying the price behavior
b) using the tools to identify valid setups, c) structuring the trade entries
by using the appropriate order types, and d) executing and holding winners
to a logical exit, while exiting losers at or before the stop is hit. Its that simple.

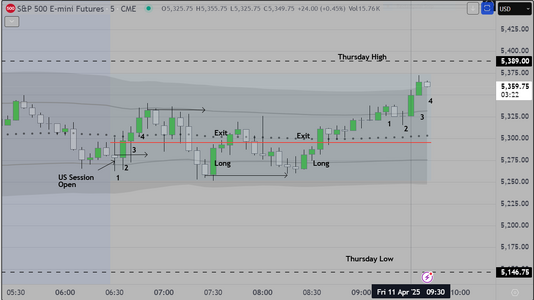
The chart shows the trades. Interestingly we had several students from our original
class watching and some did trade. Two of them had been having difficulty holding
winners. This was their description of the problem. I told them that it was likely that
the REAL problem was they did not accurately identify the context, meaning that they
were entering at times when most professionals were exiting. In plain English, they
were entering late, holding for a short while and then when others were taking profit
they were stuck, or were flushed out at break even (if they were lucky).

Trading range price action is difficult for retail traders. The preferred entry is at the 1st SD band
on a limit order. In volatile markets, this insures that trader gets a reasonable fill
If in contrast, they enter using market orders, they will always pay a sizable spread
meaning that the position had to move further in their desired direction in order for them
to make a profit. Explained this quite a few times, but to no avail. Oh well.

The other option is to stand aside and wait patiently until the market breaks out. There is nothing
wrong with that approach, in fact it often saves retail traders from losing money. Once the market
breaks out and pulls back, they can look for a 1-2-3 and off they go. Usually this is a late day breakout
trade that can be held, sometimes into the last hour.

Good luck
 

Attachments

  • Firday 4-11 trades.PNG
    Firday 4-11 trades.PNG
    60.9 KB · Views: 8
Thank you Sir, for your kind comment

As we were leaving the house, saw what looks to be
a late morning breakout (we spoke about previously) to the upside

entry would be at or near 54 and the profit target 30 pts or more
higher.

Good luck
 

Attachments

  • Late Morning BO 4-11.PNG
    Late Morning BO 4-11.PNG
    72.9 KB · Views: 8
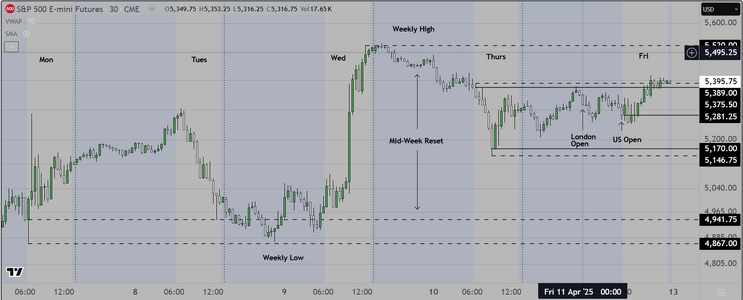
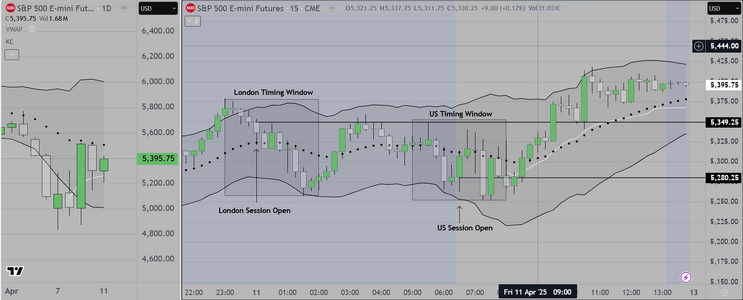
Posting a 30 min markup chart, showing the weekly cycle that forms
the basis of the system that we teach. Retail traders can see that price
tends to move between the weekly highs and lows.

Moving one step further, we transition to a 15 min chart and we divide that
chart into individual "timing windows" (one each for Asia, London and US sessions)
Within each window we show traders how to to look for specific high odds setups.
If the setups present themselves, traders can trade any of the three sessions. IF not
they simply "pass" and move on to the next session, or another market, or they
may elect to wait for the next day's opportunities. This allows traders to be selective
and take only the best setups, reducing losses and maximizing gains.
 

Attachments

  • Weekly Chart.PNG
    Weekly Chart.PNG
    110 KB · Views: 10
Last edited:
Finally, we post a last chart for the weekend

We have been working on a simple system
that incorporates Keltner Channels. It will continue
to use the "Timing Windows". We are still testing
this system and once it passes our basic screening
we will offer it to those may prefer it over the VWAP.
 

Attachments

  • Keltner Channel System.PNG
    Keltner Channel System.PNG
    135.1 KB · Views: 13
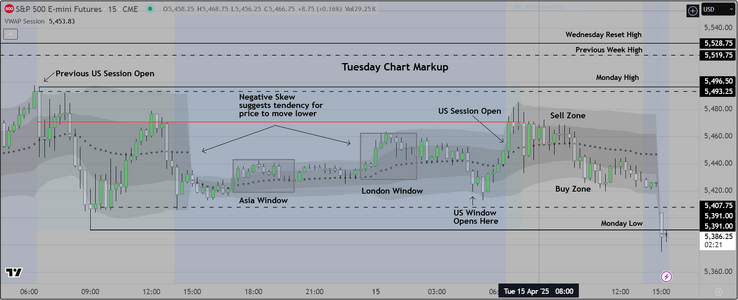
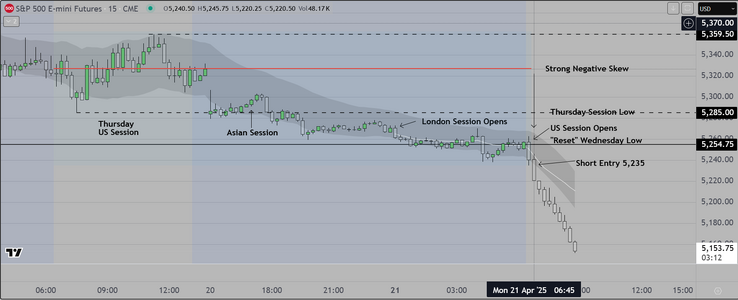
The US session of S&P Futures has completed and we have "marked up"
our chart for the day. We will post this one (the display that we use regularly)
and another that we have developed for retail traders. That one uses Keltner
channels and seems to be more accessible for amateurs who might be struggling
to learn how to trade.

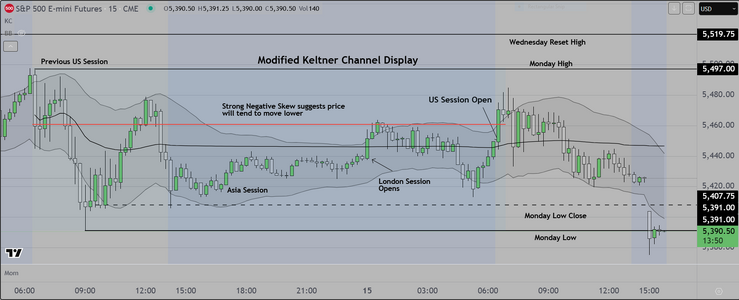
As you look at the right side (we call it a "Modified Keltner Display), there is a lot to
"take in", however some of the more important things to note are as follows

1) This system uses "ATR" (average true range) as its basis, and that corresponds well
with what many commercial firms use as a measure of volatility in the market.

2) Traders may notice that every time price leaves the channel, it tends to reverse back
inside. This is by design.

3) I have modified this display to accommodate my "Statistical Skew" and this means that I can
tell early on, whether price will exhibit a tendency to move higher or lower at each session's open

Finally, readers may notice that this was an inside day, and the skew was negative going into the session
This means that it was quite predictable, to trade the short side and look for scalp trades, rather then swings

The trading plan for this day, was to go into the session looking for ways to get short and then get out with
small profits, several times.
 

Attachments

  • Tuesday Chart Markup.PNG
    Tuesday Chart Markup.PNG
    139 KB · Views: 7
  • Modified Keltner Display.PNG
    Modified Keltner Display.PNG
    131.1 KB · Views: 7
Last edited:
Back
Top