A Professional Approach to Trading Futures

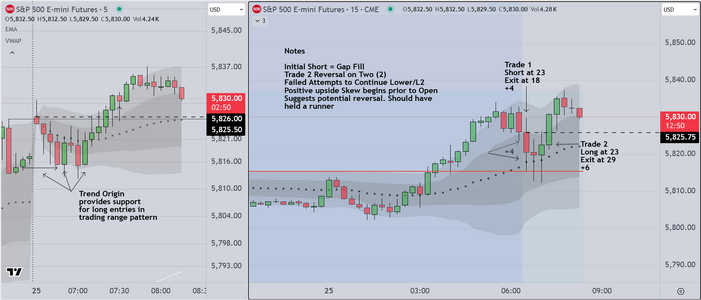
Tw0 (2) trades on the 15 min chart today.
Easy day

Skew starts positive (early) and this suggests the possibility
of a reversal after the initial move to fill the gap
When the gap is small, the trade is called a "layup" and professionals
will take it as a "scalp", then they wait for market technicals to signal
a reversal. The reversal can be seen in the price action AND most professionals
maintain a shortlist of high volume stocks (NVDA/APPL/TSLA for example) and
as they turn, we look for setup signals to match.

Although I met my quota for the day, I did not keep a runner in place
and that was a mistake.

Good Luck
 

Attachments

  • Tues 25 Mar.PNG
    Tues 25 Mar.PNG
    145.6 KB · Views: 28
Last edited:
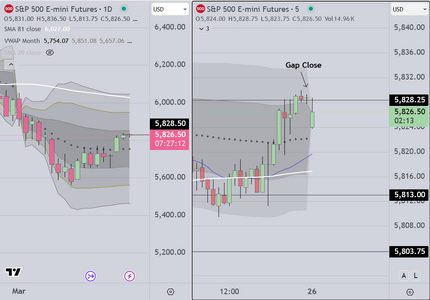
Gap Close on Open Example

I have friends watching along with me today
so I can only post this without any added color right now

More to come
 

Attachments

  • Gap Close.PNG
    Gap Close.PNG
    99.5 KB · Views: 10
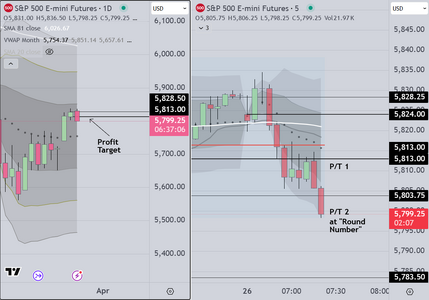
Now that the first hour has passed, we post
a followup chart for interested readers

The purpose of our curriculum is to provide
aspiring traders with a systematic approach
that has the potential to become the basis
for a sustainable vocation. I incorporate
what I call "behavioral targets", into each step
As an example, the "behavioral target" for the
1st hour is to discern probable market behavior
and from that create one or two actionable trades
leading to profit. Ultimate goal depends on the
volatility that the market displays.

We show aspiring traders how to prepare prior to
the open, how to make those determinations, and
if the price action setups present themselves, to
take the trades, manage them in a skilled fashion
and exit, without giving in to emotional stress.

The attached chart shows one example
 

Attachments

  • Follow up on 2nd Trade Mar 26.PNG
    Follow up on 2nd Trade Mar 26.PNG
    106.3 KB · Views: 12
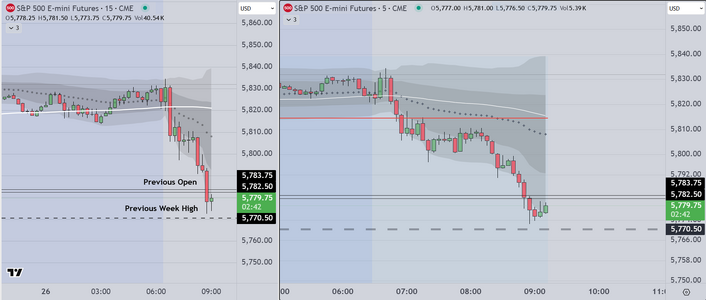
We are finished for the day

Our work is completed IN THAT we tried to
convey the possibility, that a reasonably
diligent person could learn to do this
and that IF they could also learn to control
their emotions, they could make a reasonable
living doing so.

As interested persons can see, success in this endeavor
depends on 1) Preparation, 2) Creation of a reasonable
plan, 3) Identification of setups 4) "On Time" entries
and 5) Intelligent Management of Positions.

I learned this from a skilled person and I think of him
whenever I trade. I hope he would be proud of what
I am doing.

Good Luck
 

Attachments

  • Mid Morning 26 Mar.PNG
    Mid Morning 26 Mar.PNG
    117.9 KB · Views: 13
Good Day

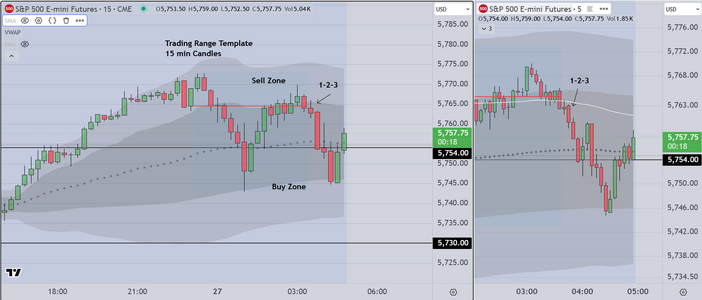
Today is 27 March and I am monitoring the markets
I have prepared a plan and will look for scalps early
followed by a late day breakout. Because of the tariffs
proposed by Trump, I think we could see a break to
the downside

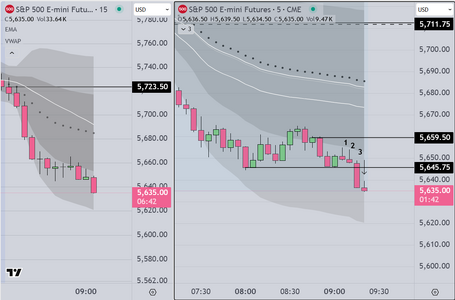
Attaching a screen display showing both 15 and 5 min
candles. The display is titled "Trading Range". Within
the range we see both buy and sell zones. We also show
a FRVP/POC (point of control) which allows us to see
the statistical skew, which is "skewed" to the downside
and we have annotated a short trade based on a simply
breakdown 1-2-3 algo (entry on 4). As mentioned
previously, I have tested this extensively and find that it
works by limiting what an amateur can do, and it seems
to provide more accurate signals. So it should take an
amateur trader less time to become profitable. In tests
with volunteers, it has proven to work well.

Good luck
 

Attachments

  • 27 Mar.PNG
    27 Mar.PNG
    123.7 KB · Views: 6
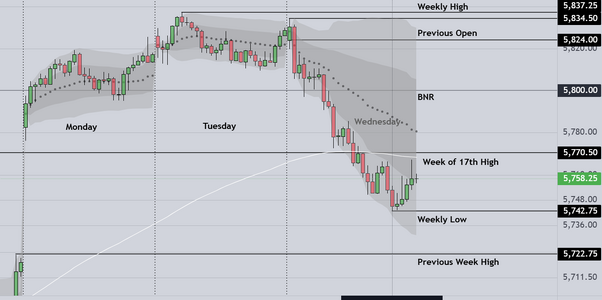
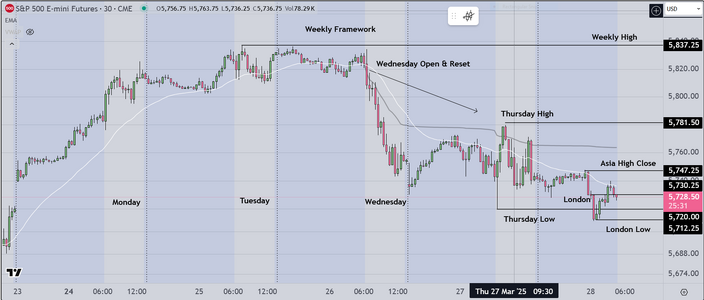
Here is the weekly template from which I operate
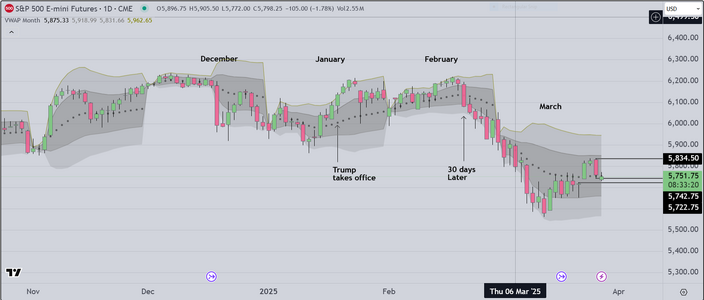
I will also post a daily chart chart for reference purposes
This shows how the US economy has done since the
presidential election.

A remarkable exhibition of poor judgement on the
part of the voting public.
 

Attachments

  • Weekly Template.PNG
    Weekly Template.PNG
    85.2 KB · Views: 7
  • Daily Chart.PNG
    Daily Chart.PNG
    152.3 KB · Views: 6
Last edited:
An interesting day

I was wrong about the early price action
As seen in the charts, institutions came in
to buy relatively early. I was on the wrong
side of several scalps and although I did
make the appropriate adjustments, I am
negative $56 at this point. When this happens
my rules suggest that I stop for a minimum
period of 15 minutes to collect my thoughts
and then if I am able to get on the right side
I "reset" and carry on.

And that's what I will be doing

Good luck
 

Attachments

  • Losing Day.PNG
    Losing Day.PNG
    149.6 KB · Views: 7
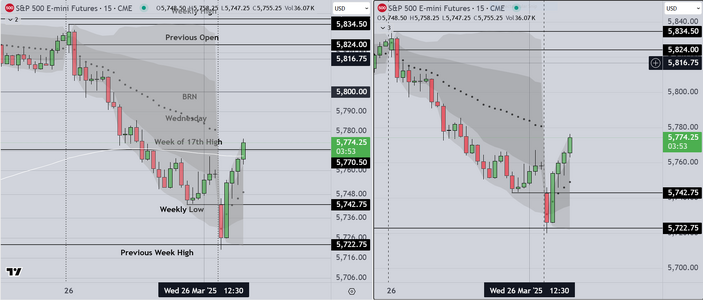
And here is my reversal entry to repair my P&L

This reversal started at about 1600 GMT which
corresponds to the Closing of Book of Business
that most Euro & London Traders execute during
that time period.
(Our weekend preparation includes review of the
timing of these reversals.)
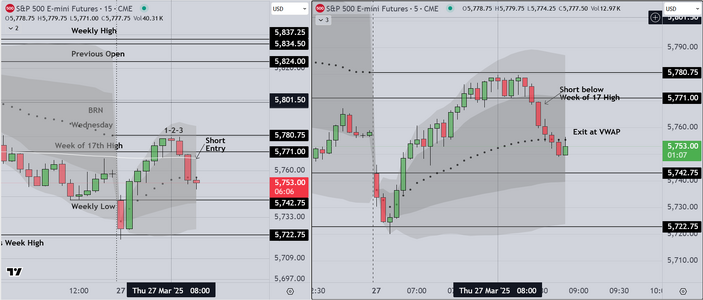
Also readers will note that the reversal entry takes
place as price "takes out" a previous high (week of 17th)
This is an important "confluence" of events that helps
us to make the decision to trade this short.

The attached chart shows the trade entry on both 15 min
and 5 min time frames.

Exit was at the VWAP with one (1) runner left in place

Good luck
 

Attachments

  • Late Morning Reversal.PNG
    Late Morning Reversal.PNG
    146.1 KB · Views: 8
Last edited:
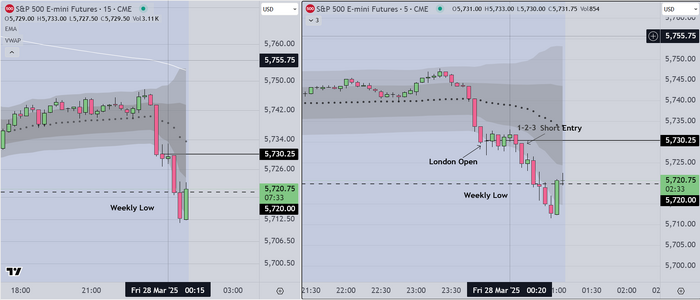
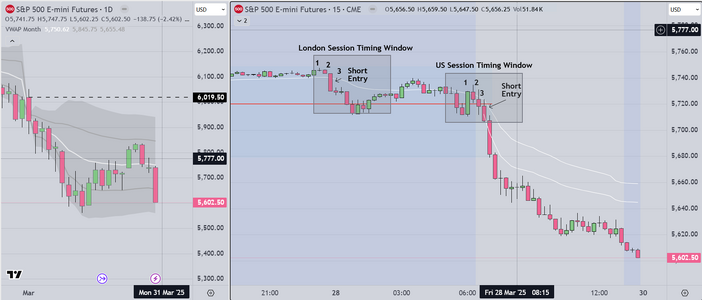
Hello UK Traders

This was an easy and fun open

The markup was simple

The entry was a "1-2-3"

And the 1st profit target was obvious
(Weekly Low)

and now I will get some sleep

Good luck
 

Attachments

  • London Open 28 Mar.PNG
    London Open 28 Mar.PNG
    111.5 KB · Views: 6
Could not sleep

It happens

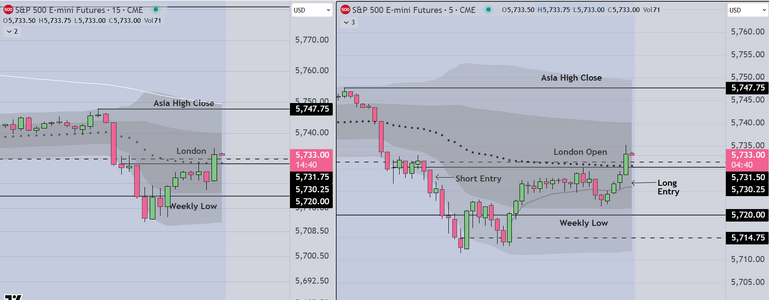
Monitored price action and documented
this long reversal at 11 London Time
Let me clear. I did not take this trade. Nothing
wrong with the setup, in fact it is "textbook"
however I was not paying attention at the time
and one of my most important rules is "NEVER
ENTER LATE"...I have learned by hard experience
that in the long run late entry will often result
in loss. If you miss a trade, move on to the next
opportunity

Interested readers might notice an "extra"
line on my chart. I have been testing several
trading tools meant especially for retail traders
to use. This one is promising and will become
part of my new curriculum

Good luck
 

Attachments

  • London Session 28 Mar.PNG
    London Session 28 Mar.PNG
    108.5 KB · Views: 5
Here is an example of the simplified chart
setup we will present to retail traders. In
testing, it seems to convey the information
needed to make good decisions while minimizing
complexity and clutter.
 

Attachments

  • Simplified Retail Chart Example.PNG
    Simplified Retail Chart Example.PNG
    130.9 KB · Views: 6
Last edited:
The attached chart shows the larger context (weekly) from which
retail traders can choose, whether to take quick scalps
or to hold positions for larger profits.

This is a simplified as we can provide. Once the student
learns the basic rules, and how to manage a position
skillfully, they should have the odds in their favor.

Right now I am scalping each session, while holding a longer
time frame position. My outlook for the longer time frame
is short (to the downside) while I look to take profits on scalp
trades long & short during each session. Every three (3) days
I review and either confirm or change my view depending on
the data. Using this approach a student can trade sim, or small
contract and learn how to become a professional. More experienced
traders can adapt this approach to any size account. It is setup
so that a trader can spend as little as an hour, or as long as they
wish during a session.

This simple design allows retail traders a way to determine
accurately, quickly, and objectively, whether buyers or sellers
are in control of a market

Good luck
 

Attachments

  • Weekly Framework Example.PNG
    Weekly Framework Example.PNG
    135.4 KB · Views: 6
Posting an example a "preferred" setup
known simply as "1-2-3". This simple
algo works amazingly well.

Requires recognition of proper
context of course
 

Attachments

  • 1-2-3 Setup Example.PNG
    1-2-3 Setup Example.PNG
    95.5 KB · Views: 7
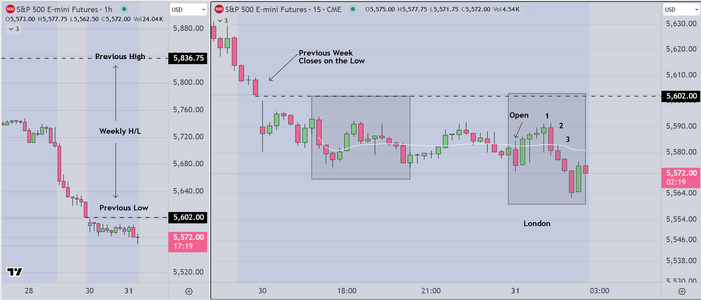
Posting my weekend Markup for the S&P Futures
using a simplified chart consisting of two displays
On the left, daily candles against a VWAP envelope
On the right 15 minute candles, with anchored VWAP lines
showing both the long time frame (beginning at Asia
and extending to end of session) and a shorter VWAP
anchored at the US session open. This allows me to
see at what time, the institutions are coming in with
volume, to move price in the desired direction.

This way of visualizing price action uses tools that aren't
in common use (by retail traders) and my sense is that
most amateurs will not know what to make of it. From my
point of view it is simple. Using this approach I have created
a sustainable business model.

Good luck
 

Attachments

  • Friday 28 March Markup.PNG
    Friday 28 March Markup.PNG
    129.7 KB · Views: 7
This was an easy open for London
and an obvious initial short, good for minimum +10
as traders get ready for the month to month handover

Institutions hope to close out the month with a profit
that "hits their targets", and so it is predictable that they
will take this easy first short before looking to move
price higher. The setup is a 1-2-3 with entry below the
white line (which is NOT a moving average by the way)

As mentioned to a previous reader, most indicators are
not helpful, but there are volume based tools that add value.
Institutions use this one for many purposes, including calculating
end of year bonuses for their employees. Surely someone should
be able to figure it out.

Good luck
 

Attachments

  • End of Month Example.PNG
    End of Month Example.PNG
    107.4 KB · Views: 6
Last edited:
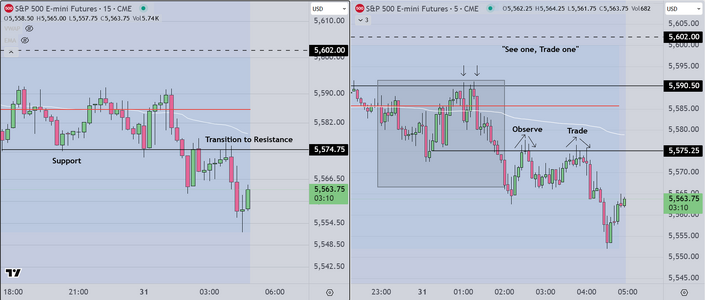
This principle ("see one/trade one") has served me well
over the years. Fewer losing trades with significant improvement
to my PNL every year. It applies in a number of scenarios
however on this chart it also shows how support transitions
to resistance once price breaks through a price level. This
of course works both ways.

Ultimately if one wants to create a sustainable business, it is
about making incremental improvements to all elements of
a systematic approach. Those who can make this work, are
willing to document what they do, stop making mistakes,
and eventually, as they learn discipline, they become profitable.
The challenge is to maintain consistent attention to detail.

Good luck
 

Attachments

  • See one Trade one.PNG
    See one Trade one.PNG
    112.1 KB · Views: 8
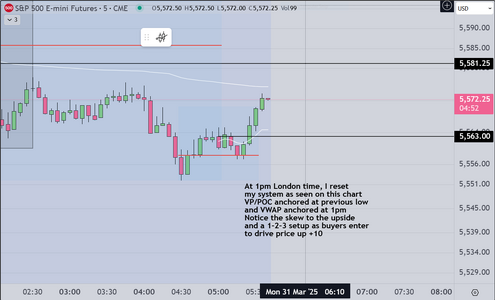
This chart shows what professionals call
the London/US "Handshake", which happens
at 1pm London time.

A high odds transition trade that professionals
learn to take (eventually) or not, and if "not" they
go back to making widgets, or selling office supplies

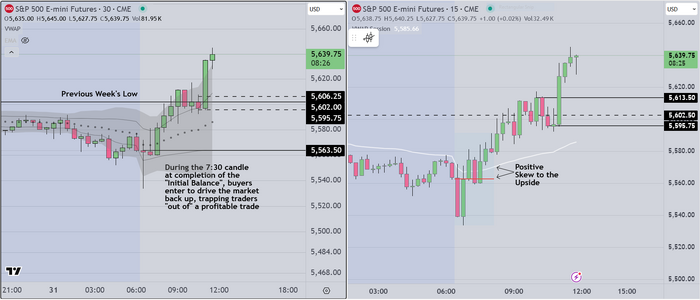
The dotted line is the previous week's low, which was
my profit target. My entry was right after the end of the
first hour (which is called the "initial balance").

This is known as a "set it and forget it" trade, meaning that
once you determine that your trading plan is correct, you enter
you place your stoploss and profit target orders and you simply
monitor the screen (as long as price continues as planned you
don't touch the mouse)

Good luck
 

Attachments

  • London to US handshake.PNG
    London to US handshake.PNG
    80.1 KB · Views: 8
Last edited:
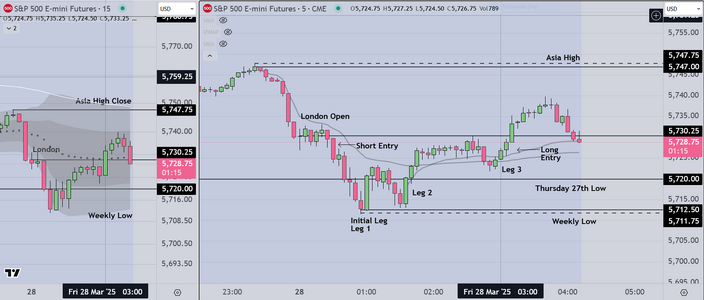
I am really starting to like the simplified chart version
created for students. It is easy to use.

This postscript is meant to better explain what went on
from the standpoint of experienced participants

Today opened very near to the previous week's low
There are two (2) reasonable ways to look at the session
as it unfolds.

1) Institutions can drive the market back toward the weekly high
or down to new lows

2) Generally they will choose to disguise their intentions by creating
an "Initial move" or "Leg 1" in one direction, then reverse, and the intention
is to "trap" traders out of trades, stranding them so that they have to chase
the market. This applies to all participants, who fail to figure it out and then
have to decide whether to enter later as the market continues to reverse on them

3) The scenario is called (classically) "Pump & Dump" or "Dump & Pump" and is
always the same. In future posts I may cover this scenario so that interested
traders can learn the game and (hopefully) don't get trapped out as often.

Good luck
 

Attachments

  • Another Easy Day.PNG
    Another Easy Day.PNG
    131 KB · Views: 9
Last edited:
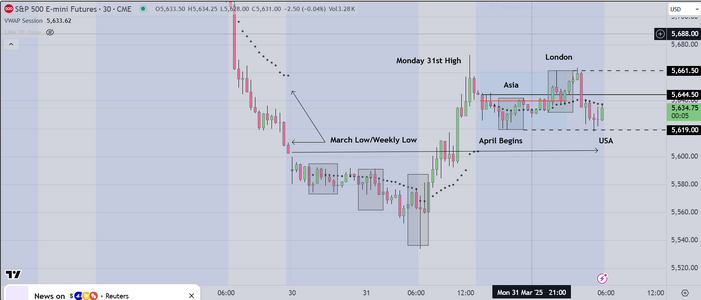
We are minutes away from the start of the US session S&P Futures
and so we post this Markup Chart showing the larger context

There are always three (3) obvious scenarios that can play out
Price can move higher, lower, or sideways. How that happens
is interesting for professionals and retail (amateurs) alike

We do not forecast, we have a larger context from which we operate
that calls for us to monitor as price moves from one "timing box or window"
to the next. During these times, our objectives are to identify, how the big institutions
move price, in order to trap traders (on the wrong side) and then move
the market in a trending fashion the opposite direction. Its a very old game
that continues to play out every day, in all markets and all time frames.

We teach a simplified system that looks for "pushes", and once we see them
in the context of a high or low, we look for a pattern that allows us to enter
long or short with low risk and significant profit opportunity. The rest is about
intelligent management, control of emotion, and learning to execute in a disciplined
fashion.

Good luck
 

Attachments

  • New Month.PNG
    New Month.PNG
    101.7 KB · Views: 5
Last edited:
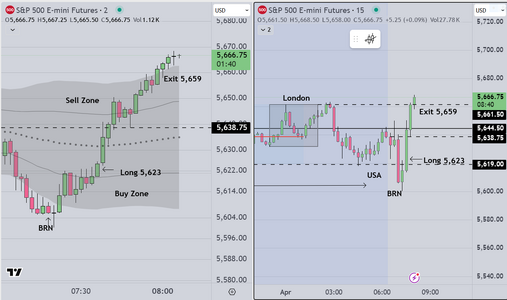
Here is a chart from today's US Session

There were two (2) trades today, the first was after the
"event candle" at 3pm London time. I would suggest
that retail traders watch this rather than trade and
lose money.

For the reversal, I mark the BRN (big round number) which
is where institutions and professionals take exit to take profit
(and they did that today)

Referring to the 2min candle chart on the left side, you can see
that after price hit the BRN, buyers came in, not only to buy back
shorts (take profit) but to trade the reversal back up to the highs
This (in my experience) is simple classic, trap traders on the short
side, reversal as performed by the big institutions. As price re-enters
the VWAP envelop, it creates what professionals call a "H2/L2" pattern
which is two unsuccessful reversal (back down) attempts. Once you see
this, you get long (in the "Buy Zone") above the most recent failed red
candle, you enter and you don't touch the mouse (because it's not coming
back). I have seen this many times.

Good luck
 

Attachments

  • Tues April 1st.PNG
    Tues April 1st.PNG
    101.8 KB · Views: 3
Back
Top