A Professional Approach to Trading Futures

I am done for the day and wanted to publish
this version of the Simple Retail Chart, that I
will be using in my next class

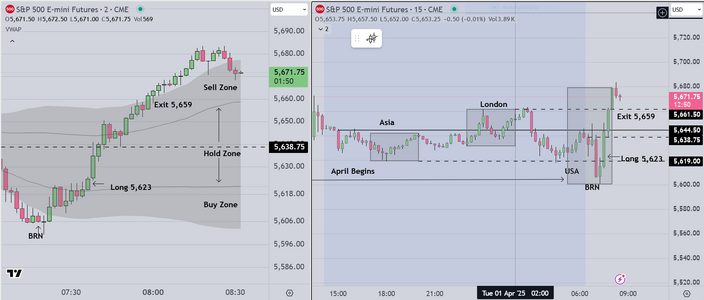
On the left, two (2) minute candles against a
stripped down VWAP Envelope (I have removed
the VWAP median). On this chart one can see the
Buy & Sell Zones, located between the 1st & 2nd
Standard Deviation Lines. Basic parametric statistics
tells us that most (about 2/3rds of prices will fall inside
these lines, AND when price action is "Trading Range"
it will tend to move from the outer bands to the midpoint
and when price trends it will often move from the one side
to the other.

On the right side, the "Big Picture" showing the "Timing Windows"
representing Asia, London and US Sessions. Each is three (3) hours long
and within each window is almost always a trading opportunity. We
suggest students trade within these windows to maximize opportunity
and minimize losses while they learn. Finally the relative position of
the Windows can be used to determine whether the market is trending
or in a trading range (just extend lines from the high/low).

We spend a lot of time showing traders the basic tools of the trade
including 1) VWAP, 2) Volume Profile, and 3) Statistical Skew.
What these three tools have in common is, they are all based on
volume. We have also used "Order Flow" in past and it works IF one wants
to put in the time, however the influence of HFT (high frequency trading)
has made it very difficult for retail traders to learn that style of trade. This
in our experience is much more accessible for amateurs.

Good luck
 

Attachments

  • Simplified Retail Chart Example.PNG
    Simplified Retail Chart Example.PNG
    125 KB · Views: 13
Last edited:
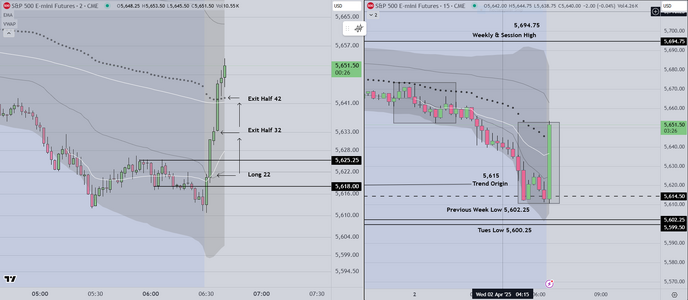
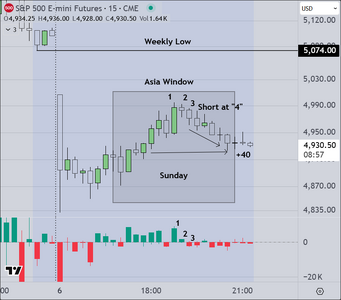
Today was an example of an "Event Day" and we start
by marking up the right side of our chart, to show the
weekly & current session highs & lows.

The value added after the basic markup is about experience
as follows

1) We know that institutions will move price from one extreme to
the other (highs to lows and reverse). This is "known" by experience
AND simply reviewing previous week and month price action

2) Given the tendency for price to "Dump & Pump", reversing at lows
we prepare for that by monitoring the overnight market. Notice the boxes
showing Asia/London moving price down to retest the lows.

3) Is it coincidence that price is at the low at the open of the US session of
S&P Futures.. Hardly. Asia and Euro drive the market down, and stage inventory
at the low, ready to profit from the reversal. It is called "Cooperative Signaling"
We have talked about it previously.

4) At the open, we monitor short time frame candles (we prefer 2 min candles)
As price moves up, we see that the first candle is "strong", so we enter and hold
for minimum +10, leaving a runner in place

With Trumps comments scheduled for later today, we will likely close our book of
business early (to better manage risk)
 

Attachments

  • Event Trade 4-2-2025.PNG
    Event Trade 4-2-2025.PNG
    120.5 KB · Views: 7
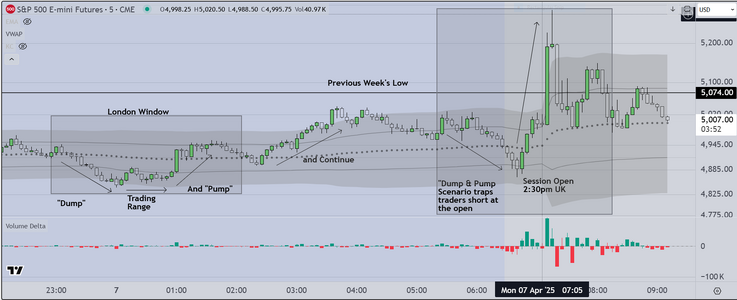
As mentioned we are done for this session and wanted to offer a
further observation

Notice in the post above (item 2) we mention that we start to monitor
what is for us, the overnight markets (Asia/London). Notice also that
during these sessions price trends lower. The reason is obvious

Finally notice that when price reverses, at the US session open, that it
moves ALL THE WAY BACK UP to the London Open. This is by design
We have mentioned the concept of "Cooperative Signaling". Market
participants, are working together to move markets in such a way as
to provide each other the opportunity to make money at both ends
(long & short). Look at the previous session. See how similar the patterns
are.
 
Final post today

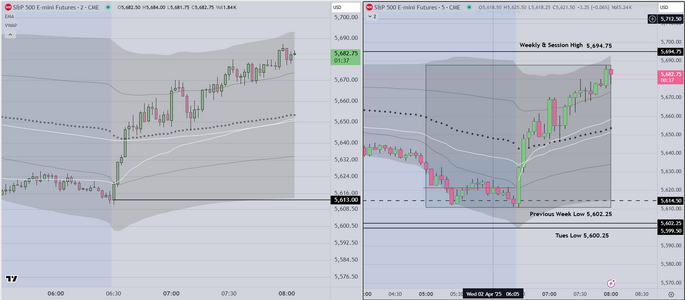
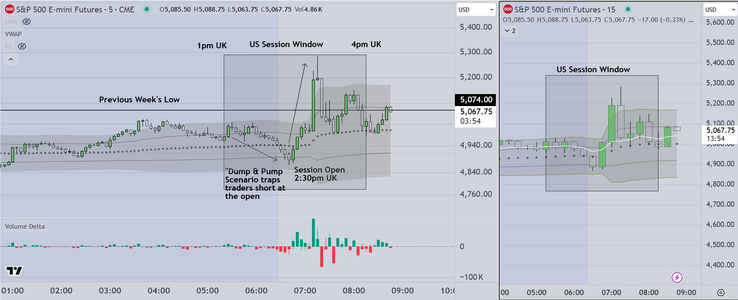
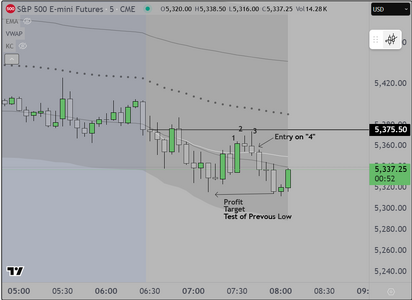
We show an adjustment that we incorporate to provide retail traders with
a few more high odds trading opportunities

On the right side of the screen we change from 15 min candles to 5 min
and we add anchored VWAP/FRVP combination. As was mentioned in response
to a question from a member, when used in a disciplined manner it provides a
significant edge.
 

Attachments

  • Trading Diplay at 8am.PNG
    Trading Diplay at 8am.PNG
    130 KB · Views: 8
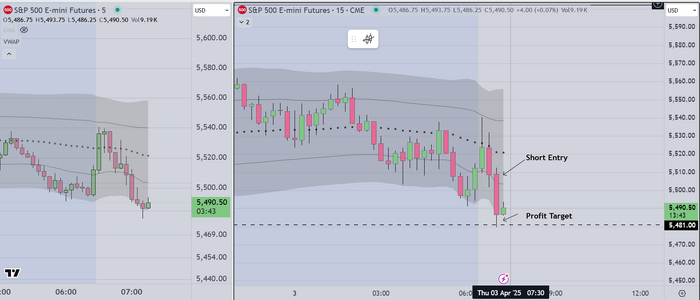
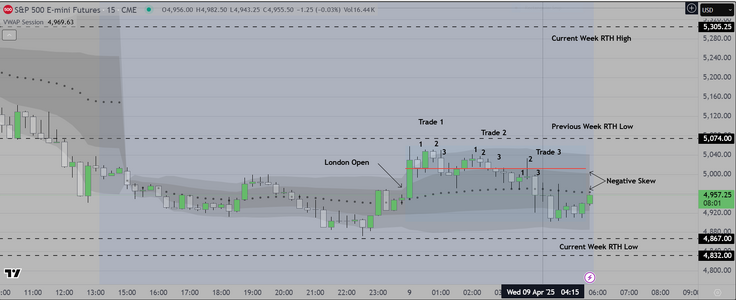
I used the 15 system today
and it continues to work well

I have a couple of previous students observing
and they recognized the setup and entry quickly

Easy day so far
 

Attachments

  • Trading with 15 Min Candles.PNG
    Trading with 15 Min Candles.PNG
    115.4 KB · Views: 5
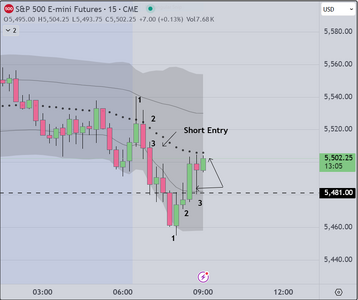
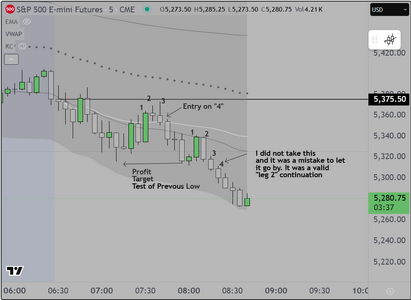
This followup chart shows traders taking profits
at the previous low (as expected)

+10 and +10 for the runner left in place

and finally, I suggested to those watching that this
is the time to walk away with money and not risk
losing it later in the day. This (if I may) is the way
that retail traders can learn to making a living
(a good living) by intelligently managing risk.

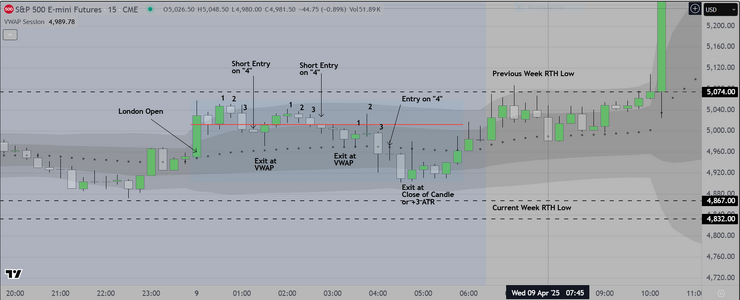
Postscript

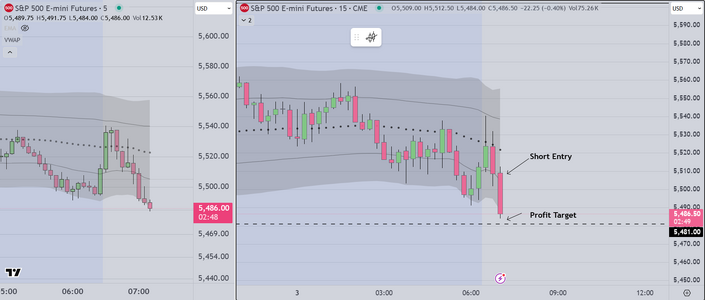
I removed the prior chart, replacing with one that better documents
the market "logic" as follows

The initial thinking is that the market is likely to "gap & run" on the open
because of concerns about the effect of tariffs on the American economy
This is simple, and obvious. The setup continues to be a 1-2-3 algo
and the 15 min chart shows the predominant price action clearly with institutions
making money on the downside initial move, then (I assure you) they will
reverse and take it back up trapping traders on the wrong side, while making
a lot of money on the impulse move up

Good luck
 

Attachments

  • Follow up Thurs 3 Mar.PNG
    Follow up Thurs 3 Mar.PNG
    116.7 KB · Views: 5
Last edited:
Here on the West Coast USA, it is 9am and I am
heading out to get breakfast

As the chart shows the anticipated reversal did in fact
trap traders on the wrong side and has already provided
+10

Professionals call this a "round trip"

Good luck
 

Attachments

  • Round Trip.PNG
    Round Trip.PNG
    53.9 KB · Views: 5
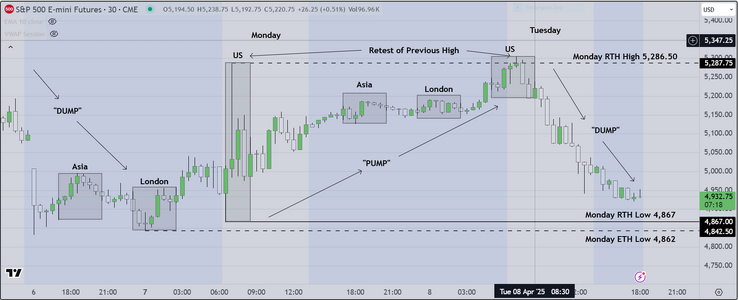
Have just returned from inspecting my new home
construction, and thought it would be instructive to
post this follow up

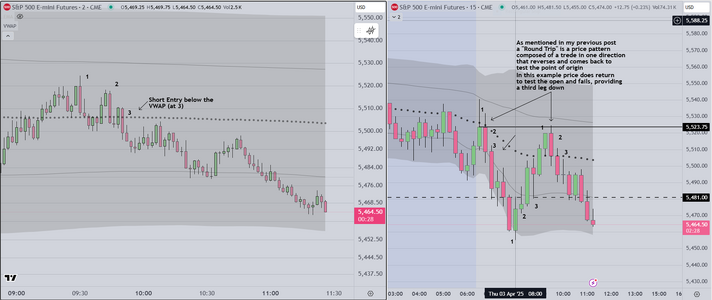
The "round trip" I referred to previously has completed
As the chart markup states, a "round trip" trade consists of
a move in one direction, followed by a reversal back to test
the point of origin. As seen in the chart attached, price returns
to test the US session open. This is programmed by institutions
and is the reason I am able to forecast it with some confidence.

After that sequence completes, we see a third leg and all three
could have been traded using my preferred 1-2-3 algorithm

The two minutes candles on the left side of that chart show a 1-2-3
setup with entry just below the VWAP. Again this is not coincidence
programs are constantly monitoring price action and activating orders
to "hunt stops" and to create signals that other institutions use so that
they know where to add or subtract from base positions. For those
who may not know. the top tier institutions trade using a method called
"always in", meaning that they maintain a baseline that is net long or
short, and they add or subtract as the day proceeds. Using one of several
tools, I am able to see where they add or subtract, then I simply "go with"
the flow.


Good luck
 

Attachments

  • Round Trip FollowUp.PNG
    Round Trip FollowUp.PNG
    120.2 KB · Views: 3
Back
Top