You are using an out of date browser. It may not display this or other websites correctly.
You should upgrade or use an alternative browser.
You should upgrade or use an alternative browser.
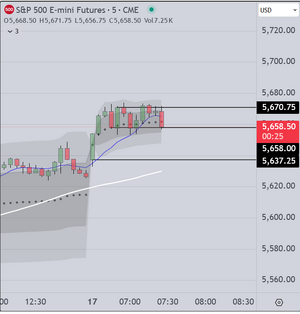
And as predicted, late session break to higher prices
with price entering back into the trading range.
This is a common scenario
This type of day is best left to professionals who
have knowledge necessary to trade with limit orders
and can BLSHS ("Buy Low Sell High Scalp"). Retail
traders trying to operate in this environment usually
lose money.
Good Luck
Attachments
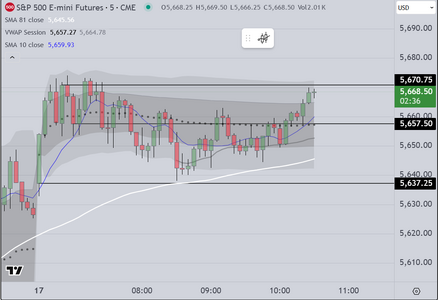
Its Tues 18 Mar
It is day 2 of the test protocol that I suggested to a
friend who is extremely risk averse, but wants to learn
how to trade intraday.
The rules are simple.
1) Observe only for the first 30 minutes of the session
2) Extend horizontal lines from the high & low closes of that time period
3) Wait for price to breakout/retest/then exceed the breakout bar (either direction)
4) Enter and after hearing "Order Filled", simply do not touch the mouse for two (2) minutes
5) If after two (2) minutes, the position shows profit, hold another two (2) minutes (repeat this process)
6) If price returns to test the entry, trader's choice to hold or exit within two (2) minutes
7) Mandatory exit at +9 pts
8) Mandatory exit at -3 pts
With my friend's permission, we show today's chart. Readers can see the result as price broke out, retested
and then continued higher.
My friend reported extreme anxiety as price retested the breakout, then bounced off that price higher followed
by a feeling of accomplishment as price continued higher. Also reported wanting to exit at each successive
pullback, assuming that the market would reverse, resulting in a loss (this is called "catastrophic projection").
We suggested that at every point in time, the trader remind themselves that they have a profit, and can only give
back a portion of that profit (no more than 3 pts). This allows the trader to feel that they control their destiny
and have the opportunity to decide (up to a point) where to exit.
Can anyone guess what the result was?
Attachments
Last edited:
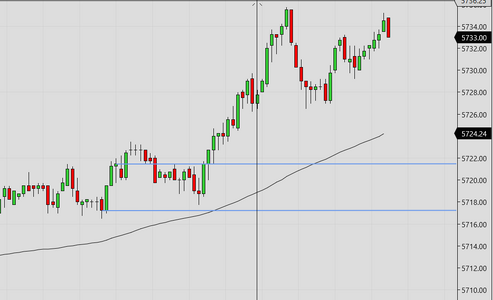
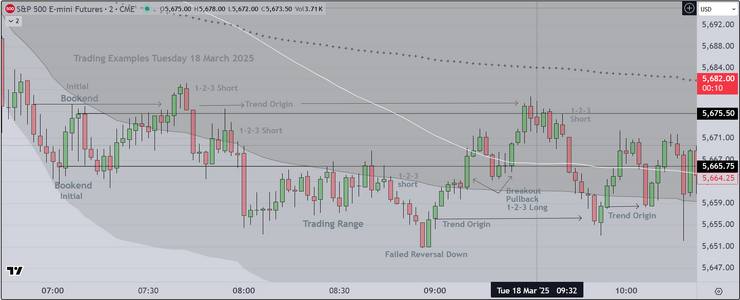
Attached is my Markup for Tues 18 Mar
On the left, I show the "initial bookends" which are the high
and low closes for a specific time period. The lines are extended
to create a framework that can be traded as price breaks out of
the framework in either direction.
There is a lot more there however I am out of time today and will
have to cover the additional features at another time
Good luck
Attachments
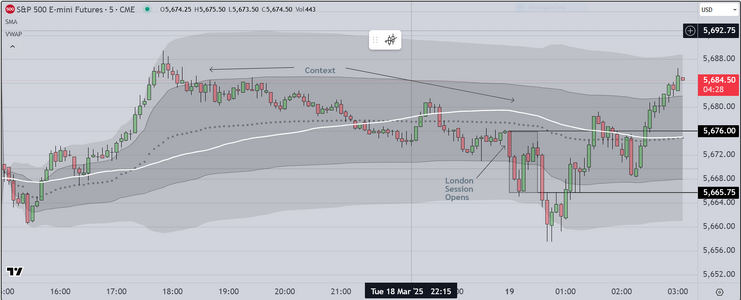
Here is my Markup for the "Overnight" market
(from my perspective in the US). The attached chart
shows the opening of Asia, then proceeding on to
London, and through to the present time
As my mentor taught me, " Context is everything"
I show the elements that I use to create a trading plan
1) Evaluation of previous price action including identification
of trend or trading range, price relative to 1st & 2nd SD bands
and "Leg Count". All of these are critical in making decisions
as to where (and when) to enter a transaction.
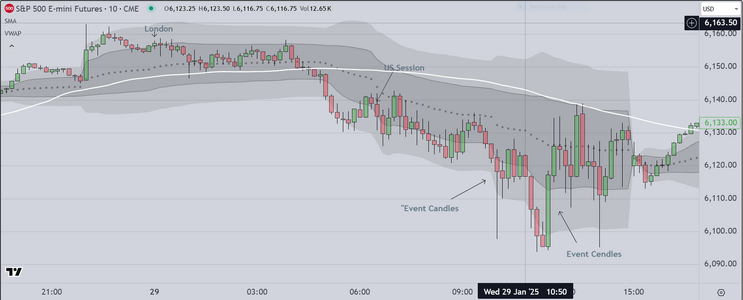
2) Because volatility has increased, I am trading prior to specific
economic news events (FOMC days). This allows me to obtain low
risk positions prior to the US session and to then "stand aside"
while the market stalls prior to the announcement. In other words
I am able to hit my profit targets early and then wait until after
the "Event Candles" form (during the US session) to trade again.
Posting London Open first
(from my perspective in the US). The attached chart
shows the opening of Asia, then proceeding on to
London, and through to the present time
As my mentor taught me, " Context is everything"
I show the elements that I use to create a trading plan
1) Evaluation of previous price action including identification
of trend or trading range, price relative to 1st & 2nd SD bands
and "Leg Count". All of these are critical in making decisions
as to where (and when) to enter a transaction.
2) Because volatility has increased, I am trading prior to specific
economic news events (FOMC days). This allows me to obtain low
risk positions prior to the US session and to then "stand aside"
while the market stalls prior to the announcement. In other words
I am able to hit my profit targets early and then wait until after
the "Event Candles" form (during the US session) to trade again.
Posting London Open first
Attachments
Today's Chart
We are done for the day
In this circumstance we see how the market reacts
to FED Chairman Powell deciding to keep rates
stable, but to confirm that two rate changes will be
needed in future. Because this removes uncertainty
it is a "risk on" day so longs were high probability.
We are done for the day
In this circumstance we see how the market reacts
to FED Chairman Powell deciding to keep rates
stable, but to confirm that two rate changes will be
needed in future. Because this removes uncertainty
it is a "risk on" day so longs were high probability.
Last edited:
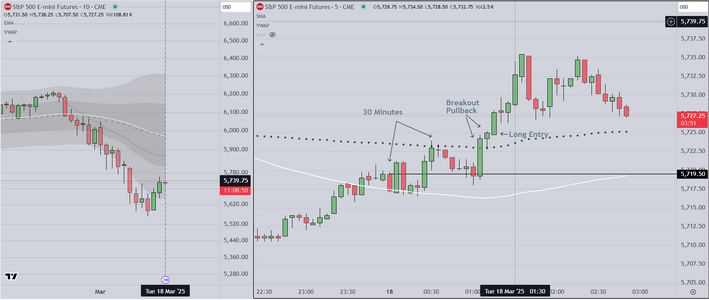
The day after FOMC is often an easy day to trade
because price action moves strongly
London Session was very simple to trade
as price broke out from the early range
As mentioned previously, I monitor the first
30 min, then wait for the B/O-P/B to occur
After than you evaluate based on the strength of the
bars and their position relative to the 1st & 2nd VWAP
bands. Institutional programs are doing the same and
simply adding to profitable positions as long as price
stays outside 1st SD
An interested person asked what theoretical system I teach
and I replied "Modified Auction Theory". I view the market
as being in one of two states, trading range or trend. When in
trading range I mark the "box" using the Bookends technique
then wait for the breakout to occur. Entry after the P/B is some
times complex but the market is very forgiving if you learn how
to identify when it is transitioning from range to trend (from limit
order to stop order).
Good luck
Attachments
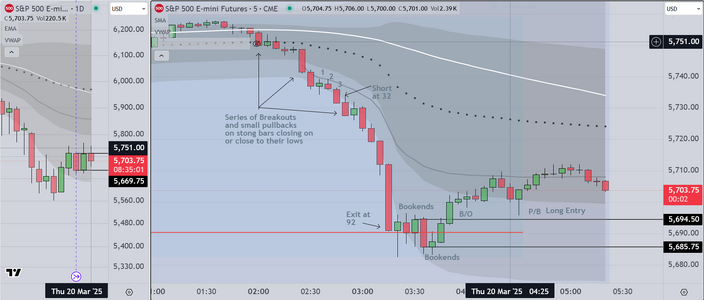
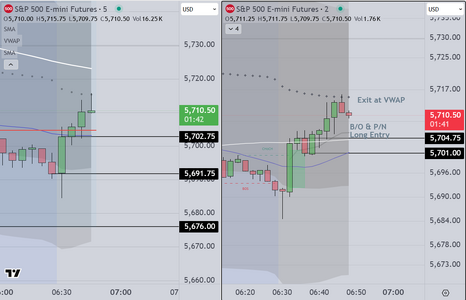
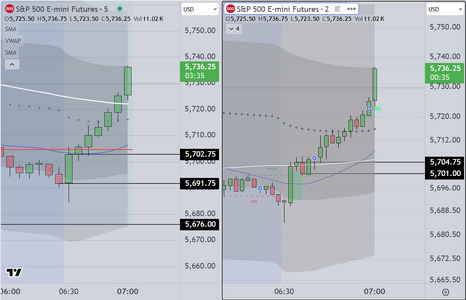
This followup to show how the trade would have
played out on both 5 min and 2 min charts
Also interested readers may remember my work
with a risk averse friend who wanted to learn how
to trade without so much anxiety
Today, I do not have their chart to display (they
use Ninjatrader, however on my charts, this initial
trade shows a nice profit, if one would only hold
for 2 minutes increments. I will post the week's results
on Friday after close of US session.
Good luck
Attachments
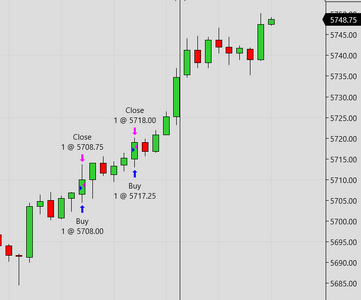
And here is my friend's chart capture
for the "2 min test" that I asked them to
document this week. We have one (1) more
day to go and then I analyze the result for
them, to see how they are doing
Today I was not present, so they were "on their
own" so to speak and if you look at the result
you can see just how risk averse they are. Without
being too critical, I can say simply that at this point
they are unable to hold a position for more than a
few seconds (sometimes less than 1 point), before
succumbing to the anxiety and closing the position.
As I have said, and I hope it helps others as well
you have to be able to recognize 1) when to enter, and
2) how long to hold. After all is said and done, these are
the crucial skills a trader needs, and finally of course
one has to learn to control one's emotions. Once you can
do that you have a chance to create a sustainable business
in this profession. Otherwise...
Attachments
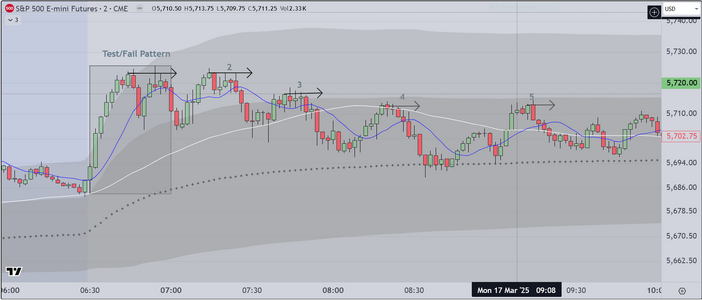
Weekly Review Part 1
This will be a review of the previous week's price action, starting with
Monday 17 March
The Markup shows the initial 30 minute time period in a box outline
I do not trade this time period, because in past I have lost money doing
so. Instead I watch and characterize the price action, hoping to learn from
it and find an edge trading the rest of the session
30 Minutes/Monitor & Characterize Only
In this initial time period we saw a trend move up, followed by a reversal,
a retest of the high, and a failure. Evaluating this, we look for repetition
and we find it (several times). Experience helps of course, but the general
rule is to look for repetition and to trade "what we see" mechanically, as
long as the setups present themselves.
Look to Trade Repetition
What we cannot show is the context, so we will simply state that the obvious.
Price tests & fails initially, and again a 2nd time. In this context we look for
confirmation from "the statistical skew" (which was negative) and for price
to move below the (blue) SMA, and using a simple "1-2-3" algo, we enter
short looking for scalp profits of 3-5 pts. Based on experience, we look for
this pattern to repeat 2-3 times. It is unusual for this (any) pattern to repeat 5 times.
We will continue this review tomorrow, same chart. One of the subjects we will
cover is the London to US Session Overlap, Which begins at 1pm GMT (same as
London Local Time). This Overlap often creates a period of high volatility which
can be seen on the charts and is then simple to trade.
Attachments
Last edited:
As often happens, life has become complicated as I
rebuild my home.
So I will scale back my scope here, posting only what
I am working on currently
The chart attached below shows an example of the curriculum
that I am completing for future students (if I am able to offer another
course)
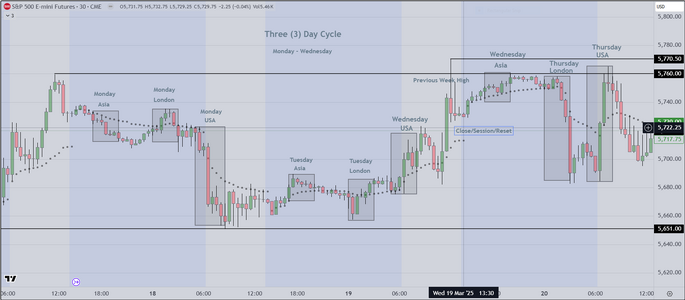
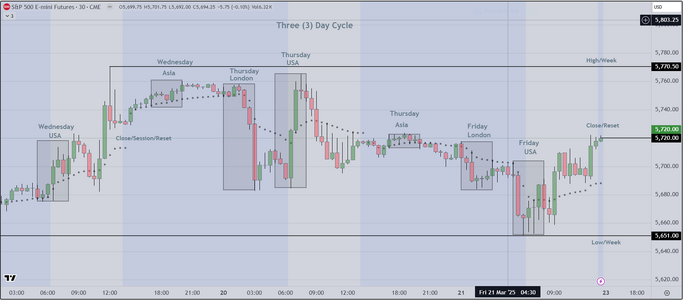
Three (3) Day Cycle
The Cycle begins on Monday extending to Wednesday. It "resets" at mid-day
on Wednesday and starts the next three day cycle. Readers will notice
that I have boxes outlining critical time frames for each market session
from Asia, to London to USA. Within these boxes I look for high probability
(repetitive) patterns. The general rule of thumb is to prefer entries at
Weekly & Session Highs/Lows because these entries often provide significant
positive "excursion" necessary to create a sustainable business model.
The attached charts shows price action on a 30 minute basis. Because of space
limitations, the weekly cycle is split into two (2) screens. The basic premise is
that we expect the market to create cyclical (tradeable) weekly highs/lows
The 30 minute candles work to convey the concept, however we use smaller
time frames for entry, trade management and exit.
rebuild my home.
So I will scale back my scope here, posting only what
I am working on currently
The chart attached below shows an example of the curriculum
that I am completing for future students (if I am able to offer another
course)
Three (3) Day Cycle
The Cycle begins on Monday extending to Wednesday. It "resets" at mid-day
on Wednesday and starts the next three day cycle. Readers will notice
that I have boxes outlining critical time frames for each market session
from Asia, to London to USA. Within these boxes I look for high probability
(repetitive) patterns. The general rule of thumb is to prefer entries at
Weekly & Session Highs/Lows because these entries often provide significant
positive "excursion" necessary to create a sustainable business model.
The attached charts shows price action on a 30 minute basis. Because of space
limitations, the weekly cycle is split into two (2) screens. The basic premise is
that we expect the market to create cyclical (tradeable) weekly highs/lows
The 30 minute candles work to convey the concept, however we use smaller
time frames for entry, trade management and exit.
Attachments
Last edited:
ImogenBeaumont
Junior member
- Messages
- 46
- Likes
- 6
That's really cool! Sounds like you’ve got a lot of experience. I’ve heard of tools like VWAP and Volume Profile, but I’m not sure how they work exactly. Do you think they’re super important for beginners to learn?Hello Everyone
I started another thread whose title is "Beyond Price Action"
as a trading journal.
I noticed that there were very few inquiries
I have been trading professionally for about 15 years
My background is diverse, with emphasis on Math (Statistics)
I have used the same tools for many years.
Volume Profile
VWAP
Analysis of Price Action
I hope struggling traders will take a look
and perhaps find something that they can
use to improve their results.
I did this to honor the memory of the gentleman
who trained me. I think he would be proud of my
work and my progress.
Good luck in the markets
Thanks for your important (and complex) question
I want to provide some perspective, that is to say, something that helps you
make good decisions as regards education.
If you are new to trading and just want to learn more, I like the work of Dr. Al
Brooks. He works with a simple setup using only price (candles) and a 20 period
moving average. I have seen him trade. He is highly skilled and honest. For me
skill and honesty are critical. He has written several books however they were (for
me) difficult to get through. I like his video course. I would begin by reviewing the
many free videos he has made available on YouTube, He offers a money back
option if you want to try his course.
I also like Trader Dale, and again he seems honest and skilled. He uses a variety of
methods including Volume Profile, which is (in my view) a good way to learn how
to read the market and can serve as the basis for a reasonable, profitable system.
There are many others, however I would maintain a skeptical approach. Eliminate those
who make outlandish claims (big profits right away).
Long ago I had the good luck to meet a nice gentleman who managed my family's estate
Like the others I mentioned, he was highly skilled, honest and (to me) kind. He knew that I
was skilled at math, and was willing to show me how he used a specific set of tools to trade
as follows
1) VWAP....Volume Weighted Average Price. This is used by top tier institutions, and by 2nd tier
commercial firms, both as a basis for automated (algorithmic or program) trading, and by human
traders as the basis for their work. Even if you have a strong math background it can take a while
to learn. On my charts it is represented as a line of Black Dots.
2) VWAP Envelope.....VWAP can be seen in my charts as a line of Black Dots. Above and below that
line, I also show a dark area called the 1st Standard Deviation, and then another area outside that
darkened zone called the 2nd Standard Deviation. Commercial traders use these boundaries (we call
them "bands", in several important ways. For example, if you watch how price acts, you may notice
that sometimes price will move away from the central VWAP Dots and trend along one of the lines
or stay in between the lines (bands). Alternatively price might move from the outer band toward
the VWAP Dots, and this is called "reversion to the mean". There are many ways to make money
using this tool. It is difficult however to obtain good training, because people who really know how
to use this system don't often make their knowledge public, OR they may be restricted by their
employers if they work for a commercial firm. Again I would go slow and maintain healthy skepticism
especially if a person representing themselves as an educator, does not proceed logically or wants
a lot of money to train others. For me these are red flags.
If you like reading, books by James Dalton ("Mind over Markets", is one example) offers a way to understand
how markets act using a version of volume profile. Books by Al Brooks are good, but are very tedious to understand
and Trader Dales offers some good downloads and books that may be of interest.
I hope some of this is helpful as you move along your path.
Good luck
Postscript
I occurs to me to say, that I intend to record trading sessions and then upload them to a YouTube Channel
so that persons interested in learning can watch me trade. I have been distracted recently because I have
been building a new house (mine was lost in a fire). When that happens I will announce it on my threads
and everyone is invited. Right now I am researching to learn how that is done. Updates to follow
Last edited:
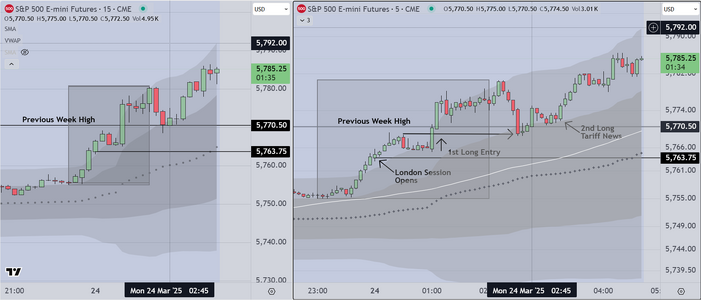
Now that the "News Trade" is over, I will post a
markup and comment as follows
Context
The market closed higher Friday, and in my opinion
it was in part due to institutions deciding that it was
safe to put money to work ("risk on") at least for the
next month or so.
Subsequently I learned (from a reliable source) that
President Trump MAY decide to reduce (some) tariffs
The opportunity to trade this is as follow
1) We do NOT care whether the rumor is true or false
Instead we simply watch the market's reaction.
2) A skilled observer can look at the placement of volume
both at the end of Friday's session, and at the beginning
of the Asia open. The net result is that we see institutions
staging big volume at the end of Friday's session and
a gap up open for Asia, that exhibited continuation. This
aligns with the information we obtained.
3) The chart is marked up to show the London Open and
the strong move up at the end of the first 60 minutes
This is an indication of algorithmic response to news AT A
SPECIFIC TIME (60 Min Breakout)
After that we look for evidence that the move "has legs"
The setups we use are specific to this event (We have posted
on this subject previously).
There were two (2) high odds entries both profitable.
Good luck
Attachments
Last edited:
By the way readers, in the premarket Tesla is up
Can you guess who is buying? Does his name begin
with MUSK?
The Big 10 institutions do not hire stupid people
They monitor the volume, and they can guess fairly
accurately who is really buying, Musk is buying back
his own stock at a discount. It is a smart strategy that
may be jumped on by the big participants this week
Lets see.
Last edited:
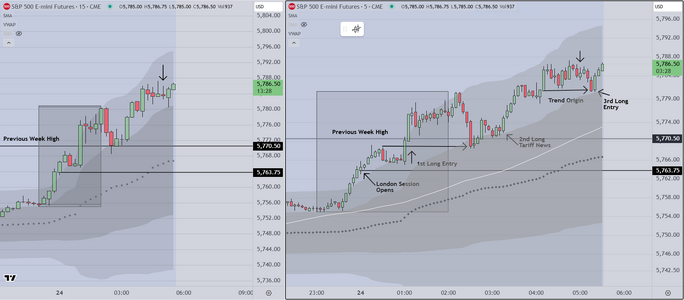
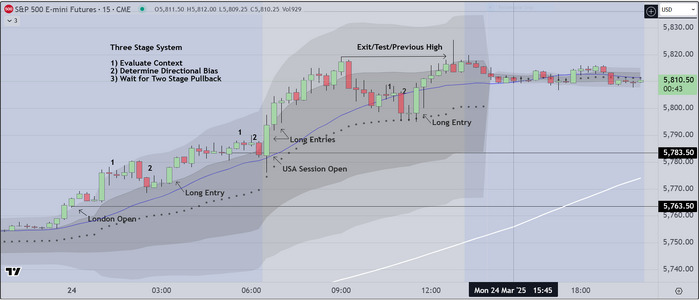
As readers may know, I have been working on a curriculum suitable for
retail traders. When I say "suitable" what I really mean is that I want to simplify
my approach so that it reduces the amount of time it takes for an amateur to learn
to make money. To accomplish that objective, I have been testing charts and setups
that use 15 minute candles and two (2) stage pullback/entries
Attached please find one of those charts showing today's entries. After an initial test period of
30 days, the persons to whom I have shown these markup charts, have indicated that there
are fewer false signals, and that the setups are easier to identify.
Good Luck
Attachments
Similar threads
- Replies
- 5
- Views
- 4K
- Replies
- 3
- Views
- 4K