A Professional Approach to Trading Futures

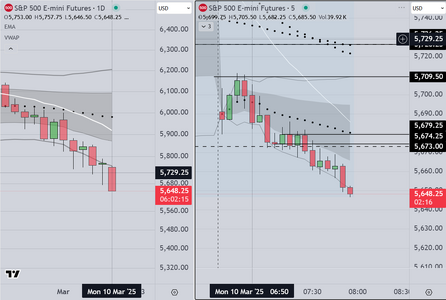
Since there have been no questions we will post
today's chart and leave it at that. Readers of previous
posts will notice that we forecast this downturn days ago

AND we believe that the odds favor continuation down to
5,500. The reason for this is that the misguided fiscal policies
put in place by convicted felon Trump are sure to cause an
eventual recession. Institutions know the odds of this are high
and so they will reduce CAPEX, and look to buy back shares of
the S&P 500 stocks, however that will not happen until they
obtain a sufficient discount (Wholesale prices). At that point
they will come in to buy and wait to mark the inventory up and
distribute later at a premium. This is a reliable way for the big
participants to create profit on a quarterly basis (when the next
earnings reports are scheduled.

As easy day so far.

Good luck
 

Attachments

  • Monday Mar 10.PNG
    Monday Mar 10.PNG
    112.9 KB · Views: 13
Here is an "End of Day" markup of the session

As seen on the chart, this was a "Gap (down) and run" day
most gaps fill, and this one may also, however the bulls have
a big task ahead as the Top Tier firms are now (clearly) preparing
for a recession.

Notice that the framework (VWAP and Standard Deviations above
and below), makes it possible for skilled traders to take a short soon
after the open and hold. WHY? because price stays between the 1st
and 2nd SD for 90 minutes! AND there is only one (1) test of the down
sloping VWAP. Skilled operators know that when the VWAP slopes,
the first tests usually fail. For those who have the requisite knowledge
of statistics, this was a relatively easy day, short after the first three (3)
candles and hold as long as price stays between the lines

Postscript

Thanks trader 333 as always for your "like". Haven't forgotten about you.
When I am further along with my housebuilding project, I will start a new class
and let you know of the start date.
 

Attachments

  • Monday Mar 10.PNG
    Monday Mar 10.PNG
    147.5 KB · Views: 7
Posting this Pre-US Session Chart

This is our starting point, in that it takes into
consideration, the London open

We were taught that "Context is Everything" and have found
much value incorporating that understanding into our system
as follows;

We start by looking at the comments of an institution (Goldman Sachs)
who recently revised their outlook. Interested readers can do the
research, however to summarize, the outlook is difficult due to the impact
of tariffs and the tolls that layoffs and destruction of government structures
is taking on the US economy. Currently we have seen a -9% move as a result.

On the plus side, when investors and speculators have come in to buy at -10%
they have usually made money. That (in our opinion) is why we may start to
see the big institutions create a bounce in this area, or certainly if the market
were to turn down and hit the psychologically important target 5,500. At that
point I would be looking to buy size.
 

Attachments

  • Wed Pre-US Open Screen.PNG
    Wed Pre-US Open Screen.PNG
    120.6 KB · Views: 6
Posting an example of a 30 min line chart
used to evaluate market structure over a
Weekly time frame. We look for instances
where institutions come in to obtain liquidity
(create positions) prior to distribution
The model is known in the industry as simply
"Buy Low, Sell High"

In a trending condition, price will bounce off of
the VWAP median. In a trading range market
it will cross back and forth and can be traded
by buying and selling at the 1st or 2nd SD, then
holding until price retests of the central tendency
target, represented by the VWAP median. In a trading
range scenario, there is no statistical tendency at the
VWAP, and at that price the market is considered to be
symmetrical.
 

Attachments

  • Line Chart Example.PNG
    Line Chart Example.PNG
    154.6 KB · Views: 7
Interested readers should take a look at the previous charts
showing the "Buy" and "Sell" Zones on my charts

Then look at where prices went after the release of economic news
Notice in particular where the institutional participants (and other
professionals) took profit (just above 5,670). Is this coincidence?
Hardly.

Prior to this, I forwarded a chart showing my entries to one of the
moderators.

This will be my last post for a while as I have other obligations to attend
to here at home.

Good luck
 

Attachments

  • Post News Chart Example.PNG
    Post News Chart Example.PNG
    137.1 KB · Views: 8
Busy day, and I am done early
Several small changes to my display
Detail oriented readers will see them
Questions are welcome

When I teach, I use these markups as the basis
for learning how to 1) employ context and framing
to obtain high odds entries. After that the next hurdle
is learning how to 2) manage & exit trades

Exceptional day, not many go this way

Good luck
 

Attachments

  • Thursday 13 March.PNG
    Thursday 13 March.PNG
    158.7 KB · Views: 7
Sorry for the late reply

Context

Context includes everything that impacts price, so it's complex
The "big 10" institutions employ analysts who spend all their time
evaluating context, and from those evaluations, create scenarios.
I do the same things.

The starting point for me is pending high impact economic news.
Every weekend I focus on the scheduled high impact reports. I create
scenarios based on projected (consensus) outcomes. Than I go back
through my charts to learn what happened during the previous report
dates. On the next report date, I monitor and if the result is similar I
know that the pattern may be similar THIS TIME. The scenarios serve as
a point of departure, and I adjust as necessary as the market unfolds.

The bottom line is that after you do this a number of times, you start to
get a "feel" for how markets react.

One step further

On the day that a high impact report is scheduled, I already know what the
consensus is, I have a pretty good idea of how the "event candle" will look.
Depending on the report, I also have a good idea of how persistent the reaction
to the news will be (the duration of the positive or negative effect) on the market
Basically its a study of market history.

Framing

I use the VWAP envelope to frame every market. I use it because institutions use it
(for a variety of reasons). I could talk about this at length. Using the VWAP envelope
I know 1) how long to hold positions, how to 2) locate entries that have highest odds
of success, and 3) when to "pass" on a trade that looks good initially, but when you
get filled, "traps" you in a losing transaction. All of this (of course) depends on the skill
level of the user.

I also teach retail traders a technique I developed called "bookends". Simply put, when
I see trading range behavior, I suggest that retail traders do not trade it. Why? Because
they always lose money in trading ranges. I suggest instead that they mark successive
high & low closes, then wait patiently for price to break out of those ranges, entering long
or short using two (2) setups. One is a simple breakout/retest/entry, the other an algo that
I call "1-2-3". I have posted these entries many times.

Thanks for your question. It is an important one (especially for retail traders) to discuss.
 
Last edited:
Thanks for your response and a good one.

I also believe in a 'feel' for the markets but it is hard to explain (even to myself)

Hope you keep going with the thread
 
Thanks for your interest. I used to ask myself why my mentor was willing to help me (so much)
At first I thought it was because our family paid him (his firm and he was paid bonuses every year)
and then as we talked in later years, he confided that he found it gratifying that something that he
taught me still worked and was effective. For him it was a challenge to see if he could help me to
become profitable. I get that it was transactional on one level, that's just life, but he was also a very
good man, and I miss him.
 
Good Afternoon UK traders

Here is the markup for those of you who may be interested in
trading the S&P futures. This approach also works for DAX and Footsie
As my mentor used to say "Markets are Fractal".

So the chart presents a number of lessons, the first is that after markets
try to move in one direction two (2) or three (3) times, unsuccessfully, they
will often go the other way. As seen in the charts, at the open, the market
attempted to move down, but institutional orders came in to "lift the bid"
Professionals see this and it is a "Tell", meaning that it foretells of prices moving
higher, as institutions see this price level as an area to start to accumulate
inventory. As I have said before, they will also continue to buy lower at 5,500
The German and British indices will exhibit the same behavior at similar levels.

I did NOT trade this (sleeping) however I would have taken these trades, as they
are known in the industry as "layups" (easy to take and hold)

Notice that the initial tests occur at the lower 1st SD band of the VWAP, then as
price moves above the VWAP median, volume comes in. This is because the automated
programs kick in with orders to buy. On the bottom pane of my chart, I am using CVD
(Cumulative Volume Delta) to confirm volume entering at these levels. Notice also
that there is continuation (successive followup trades). This indicates that ALL the
institutions know what is happening and are "signaling" that this is a "go with" market.

I hope this helps those interested in improving their results.

Good luck
 

Attachments

  • Friday 14 Mar.PNG
    Friday 14 Mar.PNG
    120.6 KB · Views: 2
Last edited:
I realize this is supposed to be a forum for futures however
I want to illustrate that my system rules work for stocks as well
In this case I show an example using Nasdaq stocks

The time frame does not matter (markets are fractal) so here on a
higher time frame we show the market attempting to move higher
three (3) times and failing. I took small short positions on both and have
held, but will soon take profit. The context is simple and obvious. The
misguided fiscal policies of the US president are impacting the financial
markets. Investors are pulling back and will stay in cash until they have
visibility.
 

Attachments

  • Nasdaq Stock Example.PNG
    Nasdaq Stock Example.PNG
    126.3 KB · Views: 3
Last edited:
Received this from a person who would like to join
one of my classes, but is "risk averse" in the extreme

In response to inquiries I always ask if persons are in
fact risk averse. It is difficult for these persons to learn
this profession, because for them the stress of watching
price bounce up and down triggers unpleasant emotions
The result is that they almost always cut off winning trades
too early. That means that they never make enough to offset
the inevitable losers that we all have to deal with.

In this instance, I asked this person to start a "sim account"
and to trade one (1) contract of the MES (mini contract).
I showed them how to setup a simplified chart as shown
with just two (2) SMA averages (78 period and 10 period)
I also provided them with simple rules, and asked them to
trade only long entries. Finally I asked them to do ONE thing
and ONE thing only, and that was

1) Once you are filled (they will hear a voice say "order filled")
DO NOT EXIT for TWO (2) minutes. Quickly set a kitchen timer
and then do not touch the mouse.

Ha, they could not resist. After a minor profit, they closed out
the trade.

OK, no problem I asked them to take a screen shot so we could
discuss and I pointed out that price continued significantly higher
AND if they had confidence in the systematic rules I provided they
would have stayed with the trade. So point one is learn to have
confidence by repeating this process (and documenting the results)
each day for the next week.

I realize that other issues will come up for persons who are very risk
averse, and I am prepared to offer additional suggestions that will,
If they follow along, provide the result they need.

Updates to follow

Good luck
 

Attachments

  • Sim Account Trade Example.PNG
    Sim Account Trade Example.PNG
    34.1 KB · Views: 1
Just received this follow up
(with apologies for not following my
instructions). As seen in the chart the
trade worked out well (if the trader stayed
with the position to its logical endpoint).
Again I can talk about it further if anyone
is interested in this issue.

My response was "don't worry, I have
seen this before, and we will get you
in a better place, IF you will have faith
in yourself and follow the directions
next week".

I asked (and received) permission to share the results
of this next weeks "test" of this process

Updates to follow

Postscript

By the way, a trader staying with the original entry
would now be up more than $1800 USD/contract.

Good luck
 

Attachments

  • Sim Account Example 2.PNG
    Sim Account Example 2.PNG
    35.9 KB · Views: 1
Last edited:
Back
Top