A Professional Approach to Trading Futures

Good Morning from the West Coast USA

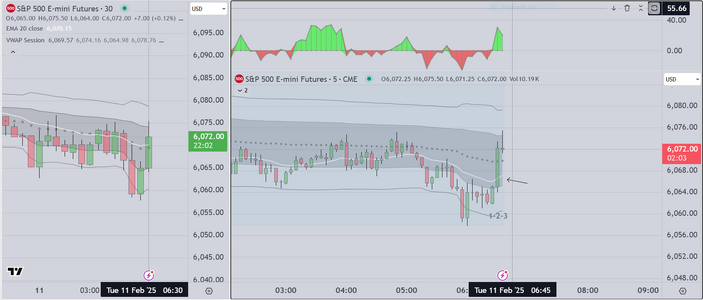
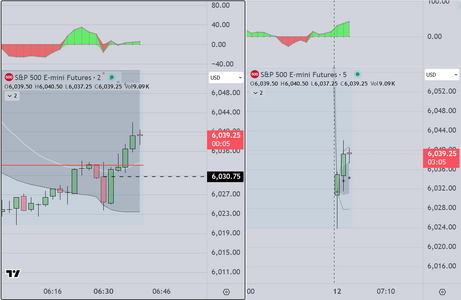
This is our first trade on a day when Fed Chairman
Powell is scheduled to speak. As mentioned previously
this is a "layup", that is to say, it is anticipated by professionals
who have seen this before (back in July). Amateurs should
start to get the message. There is money to be made if ONLY
you will take the time to prepare by reviewing charts and having
a system in place to take advantage of the opportunities

Good luck
 

Attachments

  • 1st trade Powell Day.PNG
    1st trade Powell Day.PNG
    140.9 KB · Views: 47
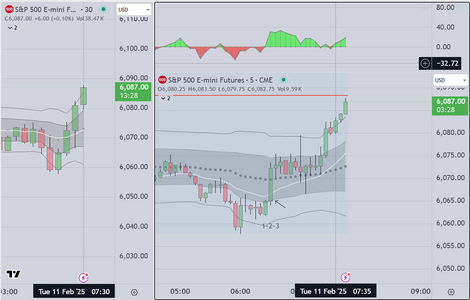
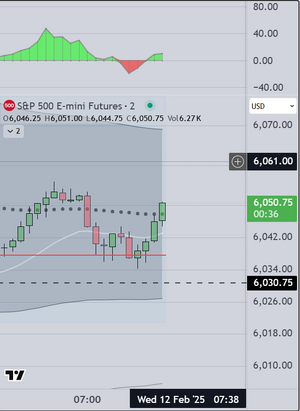
For those interested in improving their performance


Compare this to the last time Fed Chair Powell spoke
on July 10, 2024

We do this daily, because it provides the edge we need
to make money (and it works)

Good luck
 

Attachments

  • Compare July 10.PNG
    Compare July 10.PNG
    114.1 KB · Views: 33
Last edited:
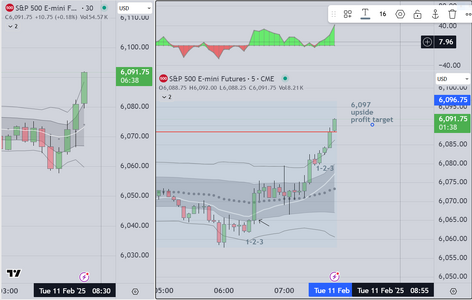
This will be our final chart for today

The upside profit target is 6,097
 

Attachments

  • Final Tues 11 Feb.PNG
    Final Tues 11 Feb.PNG
    121 KB · Views: 22
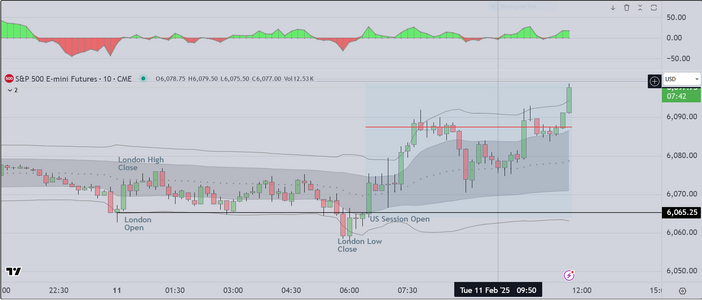
In the absence of a class we have
time to post this additional
update

Done for the day

Profit target hit
 

Attachments

  • Midday.PNG
    Midday.PNG
    116.7 KB · Views: 27
Last edited:
Good Morning

The attached chart shows a technique that professionals
call "chipping" (borrowed from golf). It refers to a way of
obtaining a 10 point move on the open based on

1) Context
2) Setup
3) Supporting volume based data including skew

Today was a successful example, and again it was an easy +10/contract

Good Luck
 

Attachments

  • Chipping Example.PNG
    Chipping Example.PNG
    97.6 KB · Views: 22
Good Morning

Taking a different approach to this session
I am showing the chart without markup text

In this chart we show profit taking, followed
by a retest of the open and (again) the institutions
anticipate favorable news, and this represents
an opportunity to buy "inventory" at a discount,
mark it up (by moving prices higher) then selling
it at "retail"(for a profit obviously)

The basic premise (Wholesale/Retail Model) is what these
institutions rely on to produce significant profit year after
year (because it works)

Because of the timing of economic events today, we have a
limited amount of time to discuss via message or post

Good luck
 

Attachments

  • 2nd Trade Example.PNG
    2nd Trade Example.PNG
    51.6 KB · Views: 28
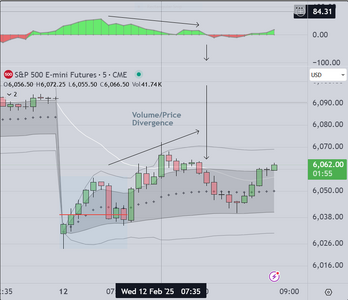
This chart highlights a typical
divergence between price & volume

As seen in the marked up chart
price stages a move higher while
volume slopes downward. In our
experience, volume always leads
 

Attachments

  • Price Volume Divergence.PNG
    Price Volume Divergence.PNG
    85.4 KB · Views: 29
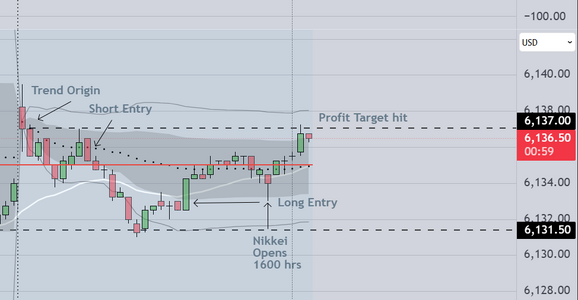
Periodically I trade Asia. Typically I take advantage of
a Holiday (US "President's Day, which used to be called
Washington's Birthday). American Markets will be closed
on Monday and so the opportunities exist and I will usually
scalp (which for me is +5 pts)

As can be seen in the chart attached below, Asia opened and
the skew was symmetrical. Our process doesn't change, we
took the short entry because price acted weak and a setup
developed at a "sell zone". This (as we have pointed out previously)
is simple.
 

Attachments

  • Trading Asia Open.PNG
    Trading Asia Open.PNG
    46.1 KB · Views: 24
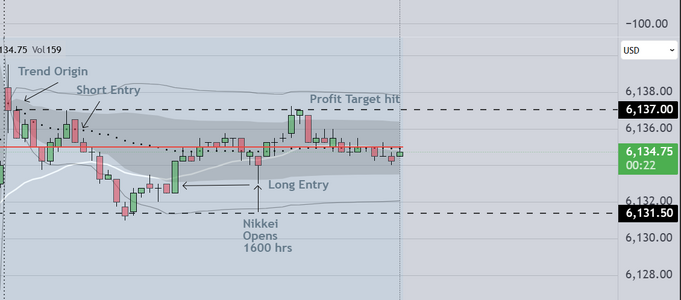
And here is the Long Entry based on the Nikkei
open and Japan's modestly favorable economic news
This one was easy and (seems to us) relatively obvious
The markets responded quickly to hit our profit target.
Nikkei is now transitioning from even to up and will
probably continue

For us, this is pretty much recreational.

Good luck
 

Attachments

  • Long Based on Japan.PNG
    Long Based on Japan.PNG
    55.3 KB · Views: 19
We have an early dinner appt this afternoon
( it is almost 5pm US time) and we are going
to stop until the London Open at Midnight (US
time). We will trade London and get some sleep
at about 3am local time.

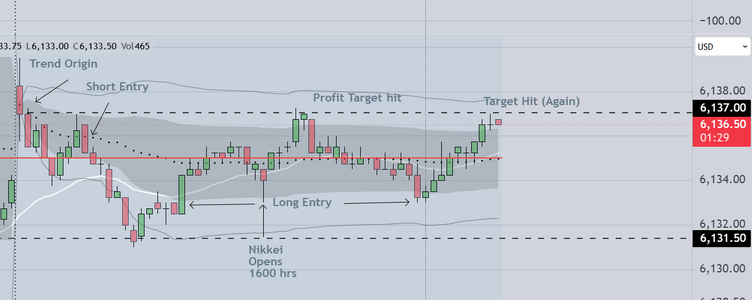
The Price Action so far is "TR' (Trading Range) and that
means that price is expected to oscillate between the
Standard Deviation Bands as seen on the charts.
We use a volume based tool to confirm entries
and we assume exits at the opposite band. These
trades are known in the profession as "Round Trips".


Good luck
 

Attachments

  • Asia Session Trading Range.PNG
    Asia Session Trading Range.PNG
    58.6 KB · Views: 22
Last Chart

This chart uses 2min candles, session VWAP envelope, Skew and
price action logic. The rest is based on experience and knowledge
of what is likely (trading range behavior) on a Holiday Weekend (in the US)

Notice the entries and exits at the edges of the VWAP bands.
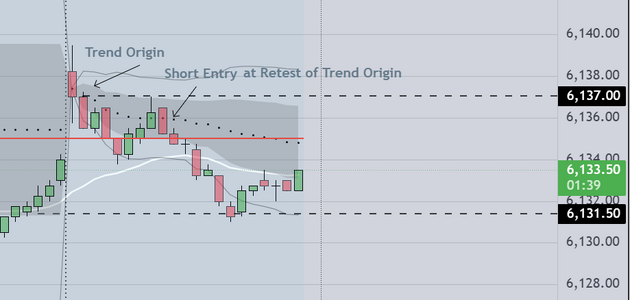
We also use our experience to identify what is known (by commercial
traders) as a "trend origin". These are the tools of the trade. How
a trader uses those tools is a matter of training, talent, and discipline.


Good luck
 

Attachments

  • Trading Range President's day.PNG
    Trading Range President's day.PNG
    70.3 KB · Views: 29
Last edited:
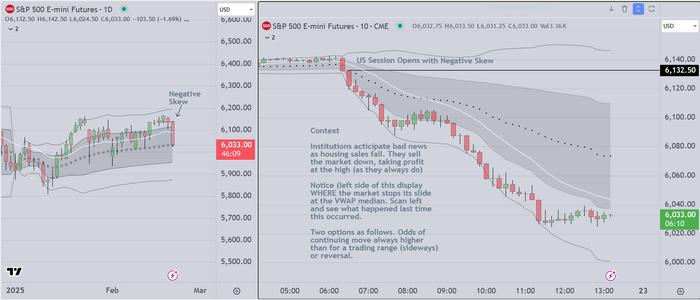
This was a predictable move as institutions
took profits, anticipating bad economic news
(housing). I will limit my comments to the basics

Using my tool set as follows

Context = poor
Skew = negative
Previous markets = Thurs opened weak
then institutions tried to prop
it back up
Today's open = Weak as institutions start selling
with a strong down candle. From there
notice the tails below candles, each one
represents a failed reversal attempt
Also notice each candle closing at or near
the 2nd SD (standard deviation) band. The
algos that control volume are "activated" to
"go with" and they start to sell it down the
obvious target (Again refer the left side of this chart)
 

Attachments

  • Friday Selloff Feb 21 2025.PNG
    Friday Selloff Feb 21 2025.PNG
    175.2 KB · Views: 23
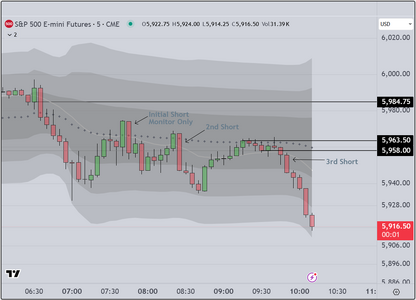
Attached please find our markup chart for today 3rd March

Several impactful economic news items released today and
they were "mixed". Our process requires that we pull up the
charts for the previous release dates, and they provided a
bias to the downside. That is the bias we started with

Notice that price trended down from the open, then transitioned
into a trading range, and finally (later in today's session) price
dropped on comments from Fed officials.

The process is straightforward. We monitor the first move. It sets
the tone for the rest of the day, testing the 20ema, and the VWAP
and failing. From that point forward we wait, for the market to retest
those same key references. When that happens we use a simple algo
to get short. An easy day to trade if one were prepared and able
to apply discipline (waiting for the market to show its hand).

Good luck
 

Attachments

  • Mar 3 Short Entries.PNG
    Mar 3 Short Entries.PNG
    74 KB · Views: 15
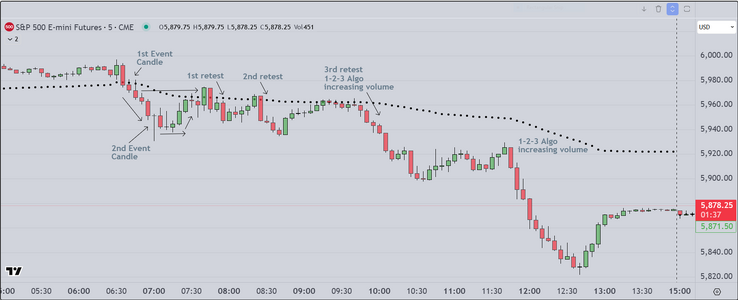
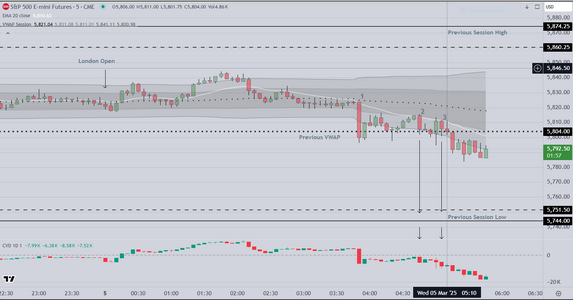
Here is a followup to the previous post

We simplified the chart, showing only price
and VWAP median.

We also show the timing of the 1st and 2nd "high
impact" economic reports, which occurred at approximately
2:45pm and 3pm London time. The candles that occurred at these
times are "Event Candles". Professionals look only at how the market
reacts at these times, because they are considered "Tells" meaning that
they usually influence the rest of the session. After the 1st candle, price
trended lower. After the 2nd, buyers came in, and price attempted to move
higher, but failed at a retest of the 1st event candle. This is what professionals
call "Initial confirmation". From this point forward, aggressive professionals will
prefer the short side (unless price action changes). Today, at each successive "test"
of the VWAP median, price failed. After the second test, institutions sold the market
down on increasing volume.

Retail traders usually do not have the skill to put this all together quickly enough to make
accurate decisions. You can learn how to do this by finding a skilled mentor, OR if you
prefer, working it out by trial & error (if you don't mind taking the extra time to do it).

Good luck
 

Attachments

  • Context Example Mar 3.PNG
    Context Example Mar 3.PNG
    74.9 KB · Views: 13
Last edited:
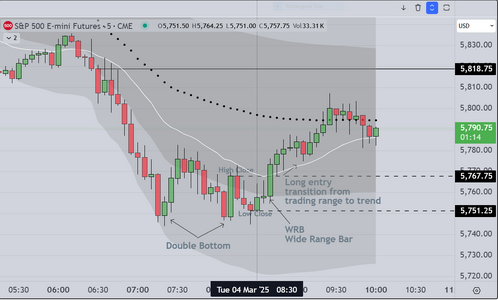
Busy day

Here is a chart markup of the transition from
trend at the bottom of a move down (from the open)

The move down was anticipated, as institutions respond
to the silly, stupid, misguided economic policies brought
in by Trump. The initial move down was easy to trade

In contrast, reversals at the bottom of a move are always
challenging, because you have two sides (bulls/bears obviously)
trying to decide whether to take profits, or continue lower.

We prefer to wait for the following "Breakout" pattern

Double bottom, followed by a reversal pattern consisting of a
Wide Range Bar (WRB) that breaks out above/below a "Key Reference"
(20 ema, or VWAP band for example), followed by a retest of the Breakout point
Entry can be anywhere above/below the retest. Profit target is min +10 and
Stoploss is -5

Please note that if the conditions are not met, we pass on the trade and move on
to the next setup. This discipline (in our opinion) is what allows us to maintain a
viable business model.

Good luck
 

Attachments

  • Tues Mar 4.PNG
    Tues Mar 4.PNG
    91.9 KB · Views: 17
Last edited:
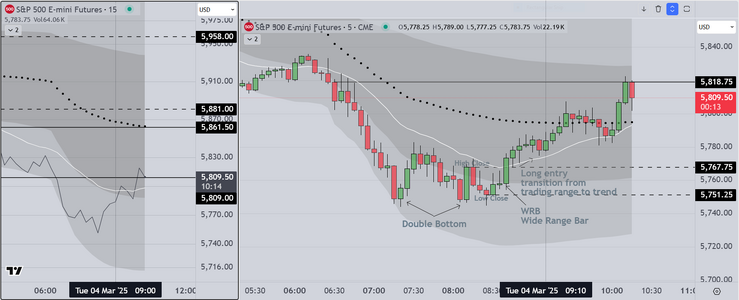
Finally, we want to show a larger screen shot of my full display

Notice that on the left side, I use a line chart. I doubt that many
will be familiar with this type of chart. It is used by institutions to
show market structure. The reason they use it is that it provides
a quick snapshot showing transitions from trading range to trend

From a business standpoint we will prefer to trade only the short
periods of time when markets are likely to trend. Skilled users learn
to identify the transitions, then wait for the patterns (as mentioned
above), so that the odds are in their favor when they decide to trade.
This is the real difference between amateurs and professionals. It comes
down to patience, discipline and the willingness to do the periodic
review of each week's charts, to insure that the patterns remain stable
and productive.

Good luck
 

Attachments

  • Tues Mar 4.PNG
    Tues Mar 4.PNG
    142.8 KB · Views: 14
This post marks a departure from my previous work trading Futures.

Based on the Presidential address this previous evening, I will be
looking to "Capitalize" on what I believe may be significant volatility
in the financial markets in the coming months and perhaps throughout
this year. This really depends on how enduringly stupid the US Republican
party is (we will know soon).

Quoting an article by Paul La Monica at Barrons

----------------------------------

“Investors need to be selective,” Jackson Garton, chief investment officer at Makena Capital Management, said in an interview. “But look underneath the surface and I believe there are some opportunities hiding in plain sight.”

Among those opportunities, Garton likes high quality industrial stocks, particularly in the aerospace sector, as well as in biotech and other healthcare companies. Midsize software companies should benefit from the increased use of AI technology.

He also highlights small-caps and mid-caps with a domestic focus: They should hold up better than multinationals if the trade war lingers on. U.S.-focused companies should also benefit from nearshoring efforts, bringing supply chains closer to home.

Wall Street might also be betting that Trump does still care about the stock market, to an extent. He might not want it to fall too sharply.


“If tariffs (or threats of tariffs) lead to very steep market declines, the administration can simply reverse course,” said Tom Essaye, founder and president of The Sevens Report, in a newsletter Tuesday. “Put more plainly, President Trump can simply back off tariff threats and reduce the policy-driven anxiety.”

Essaye says a 10% decline for the S&P 500 could convince Trump to rethink his stance on tariffs. Similar drops during Trump’s first administration often led to “truces” between Trump and Chinese President Xi Jinping, he notes. The S&P 500 is currently hovering just under 5,800, about 5% below its all-time high from last month. It would need to fall just below 5,500 to be in correction territory.

Another sign that the market might be nearing a bottom? The Cboe Volatility Index, or VIX, has shot up nearly 40% this year to about 24. Some think Wall Street’s so-called fear gauge is getting close to a level that might indicate capitulation is soon near.

“Markets are clearly worried about the effect of tariffs, but also the combined effect of all the other new policy measures. We are still looking for the VIX to hit 27 before any sort of tradable low is on the table,” said Jessica Rabe, co-founder of DataTrek Research, in a report Tuesday.

Fear may be the dominant emotion on Wall Street for now. But it may not be long before greed rules the day again.

In fact, Trump has the chance to soothe markets when he addresses Congress Tuesday night. Reassuring comments about the economy could help the market rebound. Doubling down on protectionist trade talk, on the other hand, could further motivate the bears.

Write to Paul R. La Monica at [email protected]

------------------------------------------

For those who had the stomach to listen to Trump
speak for almost two hours, I congratulate you. For the rest of us
be advised that soon, we will all be affected by this con artist and those
around him and one of the ways to prepare is to learn how to take
advantage of the obvious problems he is creating in the financial
markets. I can assure readers that the big 10 institutions have already
created a plan to handle what is coming. Notice if you will the line
"Fear may be the dominant emotion on Wall Street for now, but it may
not be long before greed rules the day again" Believe me when I say
that they will find a way to make money no matter which way it shakes
out (and so will I).

I will assume that the "Retail/Wholesale" model used by professional traders
for decades will continue to work. That is why I continue to use the VWAP
envelope, to tell me when we are in the "buy zone" (able to buy at wholesale)
or in the "sell zone" (able to sell retail premium) back to the public.

In the short term, I will be changing my focus, creating a new thread
where I provide a Weekly List of "Stocks in Play". From that list I will show
how professionals monitor, and then based on a well established "Playbook"
buy or sell ALONG with the institutions. Essentially I will be doing this
in real time either here (if that is possible) or on YouTube so that traders
can see in real time how it is done.

Good luck
 
Last edited:
Posting this Markup of the ADP news "Event Candle" trade

For those new to this approach, we do NOT trade the event candle,
the options we have are to trade PRIOR to the event candle or
AFTER.

In this case we chose to trade (to enter a trade) prior to the event
using an algo that has worked very well for us, simply put we look
for three consecutive touches (tests) of a "Key Reference". We observe
the first test and its result, then we trade the 2nd and if we are willing
to accept additional risk, we also trade the 3rd test.

In this instance the result is as planned and as talked about previously
in the posts above.

PostScript

We took a moment to add additional color to the chart, showing the
cumulative delta, which is a volume tool that helps to confirm our decision
Notice that prior to the 2nd Test, the CVD is relatively quiet, then as price
tests the 2nd time, you can see volume enter the market. The 3rd test
is a more risky trade however, from experience we know that it is reasonable
to assume that the market will exhibit continuation. When it works, it is usually
the more profitable than the previous test. The reasoning behind this is
known in professional circles as "Cooperative Signaling", a subject which we
cover in great detail when we train commercial traders.
 

Attachments

  • ADP News Event Trade.PNG
    ADP News Event Trade.PNG
    85.2 KB · Views: 14
Last edited:
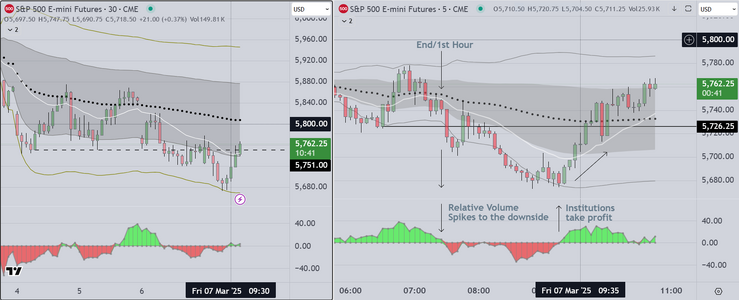
After a short hiatus, we post this Markup for Friday Mar 7
for the S&P Futures US session which starts at 2:30pm London Time

Today we had a former student visiting. This person is doing well,
is visiting friends, and asked to observe.

My charts are displayed and as usual my preparation is completed prior
to the open. As readers of my posts will note, I am very open about my
bias. I do not like the policies implemented by the US president. I believe
they will (eventually) cause a recession if he continues on this path (excessive
tariffs, indiscriminate job cuts, and other incredibly stupid actions). The economy
is responding to this by reducing CAPEX, and hiring until they know just how bad
this will be. The result is as seen as the market continues to test lower. Readers can
refer to my prior posts where I cover this

At the open, "Best Practice" suggests that we observe only for the first 30 to 60 minutes
We do this because in our experience, Friday's can be choppy at the open. Our bias is
to the downside, however we are never too proud to acknowledge when we are wrong
and adjust. The open was anticipated, with a strong move up to test the upper 1st SD
Also readers can scan to the left and see the longer time frame where price tested the
previous low boundary (dashed line). This is a 2nd failed attempt in two days to reverse
and it creates what professionals call a "Low 2" which is an automatic (strong odds favor
a short) and that is what happened.

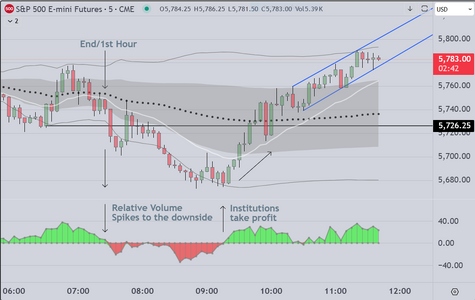
I assume the chart markup tells the rest of the story. If readers are interested I can elaborate
further. This was predictable and reasonably easy to trade. The most challenging element was
the late day reversal. We are testing a volume based indicator to provide confirmation, then
knowing that on a Friday, institutions are going to take profits we entered long on a breakout
above the 20ema. Our profit targets are (always) the VWAP, then the opposite 1st SD band above
the VWAP.

Good luck
 

Attachments

  • Mar 7 Friday.PNG
    Mar 7 Friday.PNG
    169.2 KB · Views: 14
Professionals call this "the closeout" because it is often
a high volume bar that is directional as traders and programs
close books

It is the 7:50 bar on a 5 min chart

If it sets up, I will be short

Postscript

Three (3) minutes into this bar, we see that institutions have "front run"
the setup. For those unfamiliar with the term, it means that they come in
early to take profits. The preceding bars show 16k, 18K and 18K contracts
which to me suggests that the trade is already over. Done for the day here.
 

Attachments

  • Closeout Example.PNG
    Closeout Example.PNG
    99.7 KB · Views: 13
Last edited:
Back
Top