A Professional Approach to Trading Futures

First, Thanks Trader 333 for your kind note

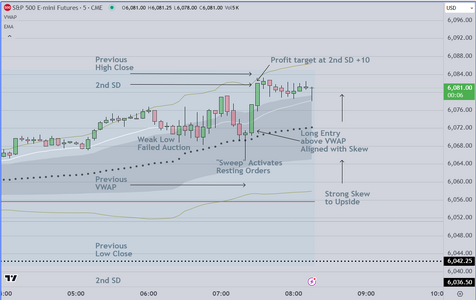
And here is an example of what CAN happen once a trader learns
to recognize opportunity in the market.

Most amateur traders do not know what a "failed auction" (also called
a "weak high or low") is. They are usually unfamiliar with the term "Sweep"
which means that the institutions probe above or below a "Key Reference"
(in this case the VWAP median) to activate resting orders. In the popular
literature it is sometimes referred to as a "stop hunt". Skilled professionals
recognize it as it develops, and once the spike candle completes they jump
on as the train leaves the station for a +10 ride.

I have an appointment this morning so I am done for the day +10 pts

Final Note

If I had the time, I would be monitoring and waiting for the end of day
reversal which sometimes occurs at about 10am PST (US time) which is
about 6pm London time


Good luck
 

Attachments

  • First Hour Winner.PNG
    First Hour Winner.PNG
    86.6 KB · Views: 19
Last edited:
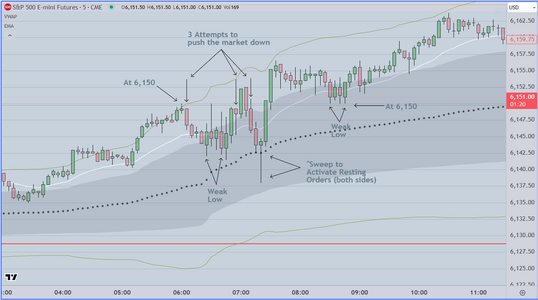
Hope this will be sufficient for amateurs to see how important
it is to learn how to think about the importance of both price AND time

Look at the chart below and you can see how sell orders came in (several times) at 6,150
This is common behavior and it is why in my classes I take the time (on weekends) to
go back through the charts and show traders how often this happens, and how to
react. Its mostly about watching carefully, and waiting to see whether buyers or sellers
are winning. Once you see who has the upper hand, you enter (typically on a breakout setup).

Today, I got in and out early and had to leave, however looking at the chart you can
see that later in the session, there were multiple opportunities for skilled persons
to get "on board" as the train left the station

Finally, for those who are serious, you should understand that this was predictable
because of the pending news coming later this week. Again serious students should
review the charts starting on Nov 4 (the previous report date) and see how each session
trends higher. Am I predicting that this will happen again. NO, but the odds favor a
similar pattern and now we will see what happens.
 

Attachments

  • Importance of Price at Time.PNG
    Importance of Price at Time.PNG
    98.8 KB · Views: 9
By the way, I planned to stop posting a while back, then I received a request from a person
asking me to list the tools that I use.

I am a detail oriented person and just like in the old Al Pacino movie I got "pulled back in"
to post again because of the additional issues critical to understanding what is going on.
As I said previously I am doing this to fulfill an obligation to my mentor. I probably will not
continue much longer. I will try to respond to messages (comments) as long as possible.

Final Note

Here's the bottom line

1) To be consistently successful, traders have to learn how to a) gather and evaluate data
and to b) create a plan that anticipates likely market behavior, c) adjusting quickly when wrong.

2) As data develops, traders need to recognize patterns leading to tradeable setups
again time is of the essence. The sooner you recognize the setup, the better the entry.

3) Once you enter and get filled, its all about skilled management of the trade, and
finding the best exit.

For struggling traders looking for education, you should evaluate by asking the provider
exactly how they plan to help you move towards these goals. If you don't get good
answers, suggest you move on.

Good Luck
 
Last edited:
Today is FOMC Decision Announcement day
and the data is already known to the institutions
(This will be the last rate cut of the year)
So long only and hold
A friend asked to watch and was unable to
comprehend the logic. They are trading a sim
account and got in early, but took multiple losses
because they were unwilling to hold their position
at the weak low. I am sympathetic to this because it
reminds me of my own problems early on in my career
The first (and perhaps the most important) is understanding
the "logic" or context. This is problematic because it requires
experience and that can't be bought. Either you learn it from
an experienced trader or mentor or you commit to slowly learning
it by observation.

The final pieces of the puzzle are the technical issues (1) creating a system
that has an edge, 2) executing, and 3) holding your position long enough so
that you can overcome the inevitable losses.

At this point, it is (for me) just another trade, and so I am simply executing
the entries based on the quality of the setups. After that you win or lose,
document the result and evaluate after each reporting period, which for me
is weekly, and monthly. At the end of each week & month, I total my results,
analyze each winning and losing trade, and report the results to my accountant.

Like most commercial traders I segment the day into early (first hour), then late
morning (2 hours) followed by a late day trade. Based on my long term analysis
I don't trade after this "late day" time period. I do not trade the last hour.

Good luck
 

Attachments

  • FOMC Decision Day.PNG
    FOMC Decision Day.PNG
    71.2 KB · Views: 9
Good Evening

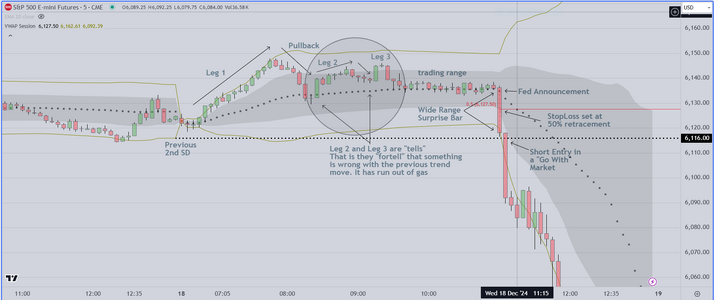
Because of the surprise ending to yesterday's FOMC session, we thought it might be
interesting for traders who struggle to to deal with this kind of price action.

Readers should start by reviewing the preceding posts where I outline the strategy
I use for FOMC days. As mentioned, I look for early (1st hour) entry aligned with what I
understand to be the most likely price action path (higher prices). Today my strategy
worked. I took early profit then left to do other things.

Had I continued to trade, the focus would have been on 1) evaluation of price action
Ordinarily we would expect price to trend higher, due to the impact of the expected rate
cut. Today however, comments made by FOMC caused the institutions to take profits
This created a "surprise bar" (a wide range bar in the opposite direction). The attached
chart is marked up to show how a skilled trader would evaluate that price action, and
how to react (and adjust) to the appearance of a "surprise bar"

Trading a "Surprise" Bar

The basic premise is simple. Using the FIB retracement tool, we locate the midpoint of
the "surprise bar". That becomes the stoploss. At the close of the bar, we evaluate.
If the bar is "strong" (closing on or near its extreme) we enter in that direction. If the
bar exhibits little or no strength (long or prominent tail, or reverses) we stand aside
and wait for the next opportunity.

Good Luck
 

Attachments

  • FOMC Surprise.PNG
    FOMC Surprise.PNG
    127.3 KB · Views: 7
Last edited:
Hello Traders

Once again I am done early

This type of day is very challenging for struggling traders
The day type is characterized as "News Dependent" and that means
that price is likely to be choppy, because participants are reacting
to multiple economic news events

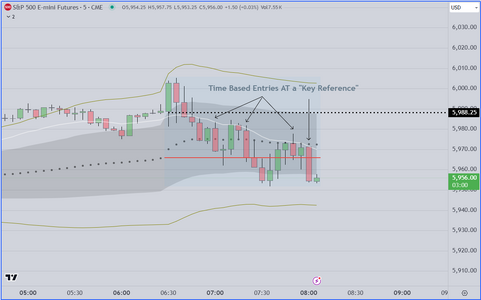
The strategy we employ is to wait for the early price action to display
a pattern. The pattern we look for is initiated by the test of a "Key Reference"
That Key Reference could be one of several including

1) 20 EMA
2) VWAP median, or 1st SD
3) A specific price point

Once we see the first test, we evaluate context and enter at the next test, aligned
with the previous trend and/or the Skew

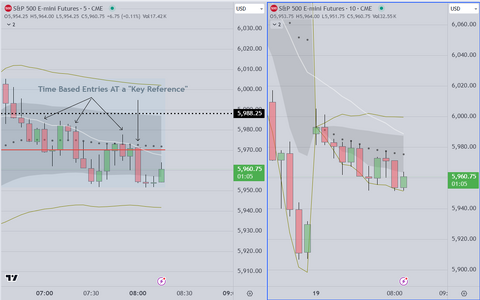
On today's chart you can see multiple tests at the 20 EMA. These tests tend to be
time dependent, that is to say they occur at predictable times (at or near 7am PST/USA)
for example. Some of this is based on many hours of screen time.

Final Note

On the right we post a chart with 10 min candles. Notice how price tests the VWAP median
repeatedly (and fails). This is all dependent on the individual trader's ability to 1) recognize
the pattern, to 2) make the adjustment, elect to 3) enter after the first test and then 4) manage
each trade.

Good luck
 

Attachments

  • Entries Based on Time.PNG
    Entries Based on Time.PNG
    61.8 KB · Views: 4
  • 10 Min Candles.PNG
    10 Min Candles.PNG
    88.9 KB · Views: 4
Last edited:
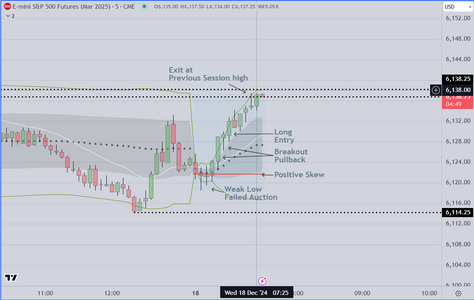
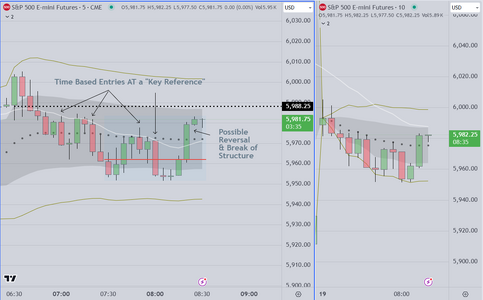
As we wrote the previous post, price action created what
we call a reversal candle w/break of structure (BOS)
We would NOT trade this, waiting instead for the completion
of the next (follow through) candle. IF this is a legitimate
"BOS" then we would be entering longs using a breakout
pullback entry model. The two scenarios are 1) significant
reversal up, or sideways and trading range

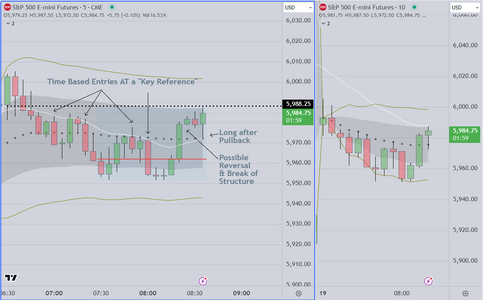
We also attach a 2nd chart showing our long entry just now
Notice that the long entry occurs at the SAME PLACE (at the VWAP)
as the short entries previously. Typical, and it shows that this is automated
behavior (institutional orders coming in). Now we manage the trade

This will likely be our last post today

Good luck
 

Attachments

  • Reversal & BOS Candle.PNG
    Reversal & BOS Candle.PNG
    87.6 KB · Views: 4
  • Reversal & Long at VWAP.PNG
    Reversal & Long at VWAP.PNG
    91.5 KB · Views: 4
Last edited:
Keeping an eye on my position, I have a couple of things to say that
might help struggling traders

If you see that you are taking a beating by entering early, do the analysis
and come to the obvious solution. Do not trade the first 30 minutes (at least).
Wait until the patterns unfold and you can recognize what is going on. I realize
that this takes patience, but unless you are in an environment where you have
a mentor or are participating along with a group of like minded traders, the
result is going to be poor. Also, if you ARE struggling for God's sake do not
trade real currency, get a sim account (I always recommend Ninjatrader)

For the current trade (a long entry AT the VWAP) I was filled at 74. I tried to take
partial profit at 85 but did not get filled until 84. I left one (1) unit in place and
will monitor until I see either a continued breakout up or sideways to down price
action, which will be my signal to exit.
 
I am out of the trade with a 1 pt loss on the last unit. This is why I hesitate to trade
AND post. Try though I may I simply don't have the bandwidth to do both well,
and what seems to suffer is my trade. So a summary of the trade is as follows

Filled long at 74
Partial profit exit at 84 (+10)
Exit to close at 73 (-1)
Total +9 less commissions
 
In the process of doing my Weekend Prep

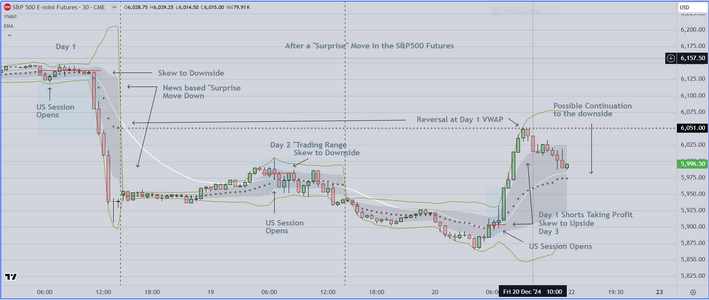
Step 1 is analysis of the previous price action

The attached chart shows three (3) days.
Day 1 on the left side, shows what I call a "surprise move"
that happened after the FOMC announcement and comments
Readers who have followed my previous posts, will see that
the Skew is to the downside, so this is NOT the surprise. What WAS
surprising was the magnitude of the move. Skilled traders know
that there are concepts that are important to understand
1) The markets are continuously trying to trap traders into bad trades
so that they have to capitulate, AND trying to trap traders OUT OF
trades so that they have to CHASE thus fueling the continuation of
the move
2) Institutions know that a very strong move (either direction) will almost
always generate a sideways to down second leg
3) Finally, at some point traders who profited from the "surprise move"
will want to take profits. THAT is what caused the reversal on day 3

So what next? Well I live in a world where the odds favor sideways to down
continuation. For now, my trading plan will start with that premise, and
may be subject to revision, as Asia and London Markets open tomorrow

My process calls for review of the higher time frame chart, review of the
last year's chart, and integration of pending economic news, and I consider
the seasonal aspects. Finally I identify price targets overhead and below
(so that if I am wrong I can quickly adjust).

Good luck
 

Attachments

  • After a Surprise Move.PNG
    After a Surprise Move.PNG
    148.3 KB · Views: 3
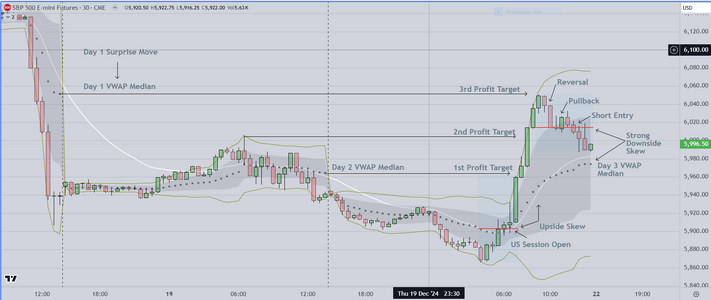
And here is the markup of the last trade on Day 3 (after the surprise move
on Day 1).

I wonder if anyone will notice how I have changed my charts to trade in this
environment? We'll see

Final Note

Retail traders may (or may not) be aware that institutions use the VWAP (Median)
to calculate trader efficiency and to determine whether the automated
programs they run are hitting profit targets (reported on a quarterly basis). This
is why I use those "key references" as profit targets.
 

Attachments

  • Final Trade Day 3.PNG
    Final Trade Day 3.PNG
    142.4 KB · Views: 3
Last edited:
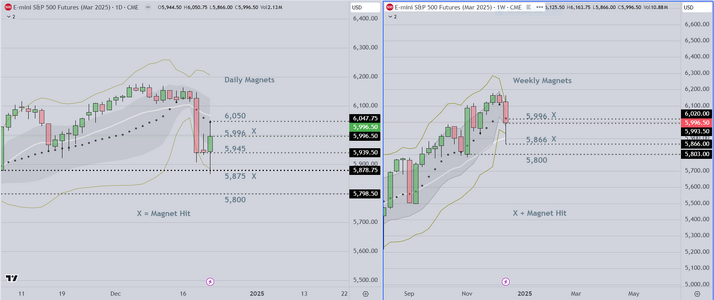
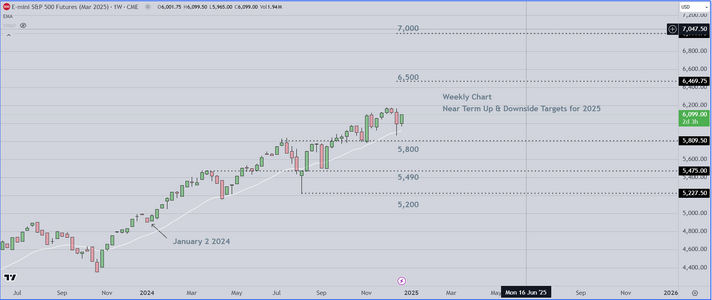
These are our Daily & Weekly Magnets

This serves in two (2) ways. We can identify likely
Market Direction, and we can hold a "runner"
knowing that on a trend day (or a surprise day)
we have the possibility of a significant win or
a "Windfall" (Defined as >40 pts), in which case
our rules require that we exit to close full stop.
 

Attachments

  • Daily Weekly Magnets.PNG
    Daily Weekly Magnets.PNG
    113.6 KB · Views: 4
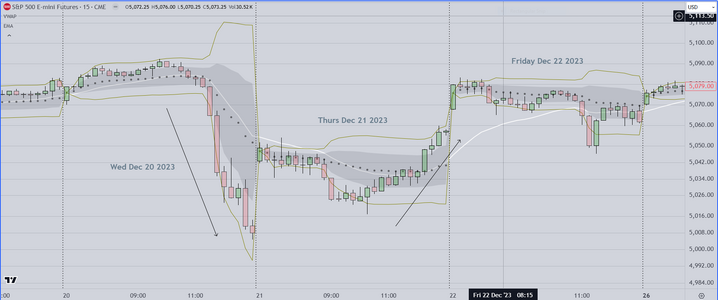
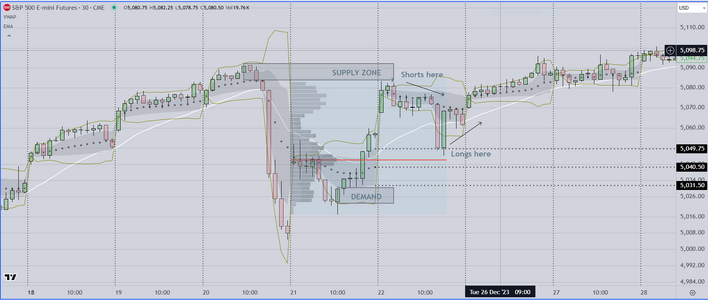
Today we will finish our Pre-Market Preparation

One of the things we do regularly is to use our charting
system to go back in time to a period that may be similar
to the present. The attached chart shows the price pattern
one (1) year ago just prior to Christmas. I assume readers
will notice the similarities. I find it useful in that it helps me
to create a reasonable scenario going forward.

Good luck
 

Attachments

  • Christmas Price Pattern 2023.PNG
    Christmas Price Pattern 2023.PNG
    125.4 KB · Views: 4
Referring to the previous post, we markup the chart
attached above and in this post. As you can see
it is possible to make money buying AND selling.
This should be common sense. if it were not possible
to buy & sell profitably, no one would participate in
the market.

As can be plainly seen, we mark both supply & demand
zones. Also the red line (VWAP median) can be seen
and it shows a positive skew that lasting several days.

As mentioned, we review these charts because of the
striking similarities between how price acted a year ago
and what happened last week (and what may happen
next week).

To answer the question "Why". The answer should be
obvious. It gives us an edge. It allows us to use the same
tools to trade tomorrow (Monday) and moving forward.

Given what you can see in the attachment below (a year ago)
and what we document in the post above (last week), you can
see how similar. This is NOT a coincidence.

What we teach students to do is prepare for this possible price
action again tomorrow. We also show them how to look for
entry at specific prices (using daily & weekly charts) AND showing
prices where automated orders have been activated, resulting in
a trend move.

Good luck
 

Attachments

  • Marked up Previous Year.PNG
    Marked up Previous Year.PNG
    141.7 KB · Views: 4
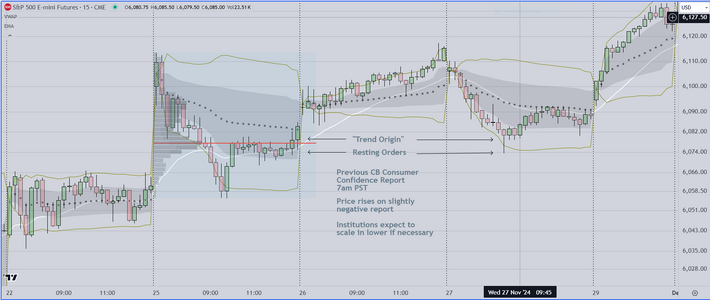
and this is the final task before the US market (S&P500 Futures) open tomorrow

This is a markup of the price action on the previous release of the CB Consumer
Confidence Report (Nov 26th). This is a CRITICAL element of a professional's
preparation to trade. The previous report was slightly negative, very close to consensus
and because markets are forward looking, it was considered a buying opportunity.
Scan Left on the chart and you will see what price action traders call a "trading range".
At the end of that session, you can see two (2) green bars. The 2nd bar is known as the
"Trend Origin" and it was the beginning of an overnight move up.

Based on recent analysis, we will watch tomorrow as the CB Consumer Confidence Report
is released (30 minutes after the US market opens). We will evaluate and monitor the reaction.
We estimate odds of a similar price pattern at about 60-70%.
 

Attachments

  • Previous Econ Report Markup.PNG
    Previous Econ Report Markup.PNG
    151.4 KB · Views: 4
Last edited:
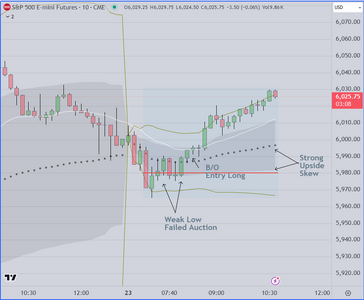
Here is today's chart Markup to show the session
up to the overlap period (where Euro traders close out
their positions). Of course automated programs continue
until end of session

As can be seen, this was an easy session to trade. The early
move was as expected, then the market created a weak low
and failed auction. At that point we waited for the breakout
to the upside, and when it occurred we accepted that risk,
entered and added as the position produced favorable excursion
to the upside. This for us is end of day. We are flat

Having hit our marks for the year, we will probably stop until
after Jan 1st

Good luck
 

Attachments

  • update.PNG
    update.PNG
    68.2 KB · Views: 5
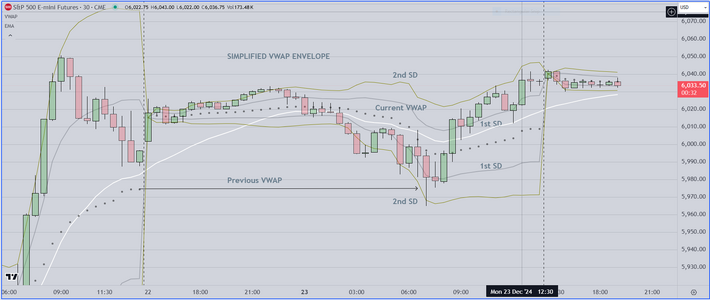
I've stopped trading for the year however I thought it would be
educational for struggling traders to see this simplified version
of the VWAP envelope.

"VWAP" (the concept) is in common use primarily by 1st tier institutions
(banks/investment firms) and by 2nd tier commercial firms (various
funds, including Options firms). The VWAP envelope allows the trader to
quickly see whether the price of an instrument is trading at a discount
or premium to fair value. In addition, a skilled operator can decide
based on where price is trading relative to the VWAP, the 1st or 2nd SD,
whether the risk of an entry (long or short) is "worth it" (or not).
A trader who uses this tool in a skillful way, has a very significant edge
over participants who don't use this, or some similar method.

Traders considering learning this type of system should understand that in
the professional world, traders evaluate price AND time as one (1) entity
They look to buy at a discount and to sell at a premium to what is thought
to be "Fair Value". In our class we (try to) teach struggling traders how to
arrive at an accurate estimate of what constitutes "Fair Value", AND when
to enter so that the risk is worth the reward. If a reader were to look at
this and other charts carefully, they would notice that the best entries are
often found within the first 30 to 45 minutes, AND occur at the extremes
of the distribution.
 

Attachments

  • Simplified VWAP Envelope.PNG
    Simplified VWAP Envelope.PNG
    138.2 KB · Views: 6
Last edited:
As mentioned previously I am NOT trading today however
I always monitor the market. Why? For me, its what I enjoy
doing AND I feel that it helps me feel connected to the
rhythms of price movement.

I continue to mark up my charts as always, and because
several friends like to trade this day, I provided my opinion
and "let the chips fall where they may".

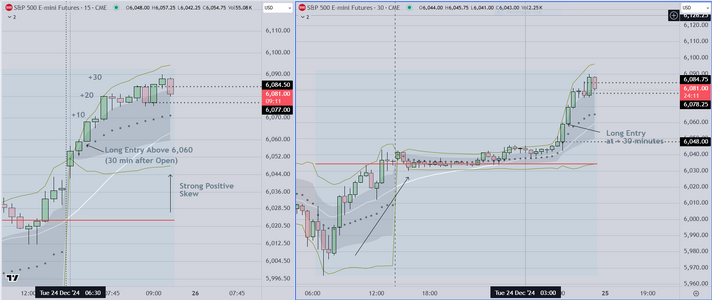
Christmas season often includes a "Santa Clause Rally",
and today was typical. I have already talked about
the importance of reviewing previous data.

Prior to the open I suggested to my friends that on days
like today, there is really only one way to trade, and that
is to look for early strength and "go with" it. As mentioned,
skilled traders view early strength as a "tell". They know that
if they hesitate, they can be "trapped out", and find themselves
watching instead of participating. Also an advantage of early
entry (at or shortly after the first 30 minutes) means that when
you are wrong, you know quickly and can manage (minimize)
the loss and move on to the next opportunity.

Good luck

Good luck
 

Attachments

  • Christmas Eve Pattern.PNG
    Christmas Eve Pattern.PNG
    135.2 KB · Views: 3
Top