Forexmospherian
Legendary member
- Messages
- 39,928
- Likes
- 3,306
Price structure - LR's Mid & Long - PA - Change of Direction
This is for Sun and all other followers
I have chosen the EA as the example - to clarify the Lrs - and also the clues you look for etc etc
I will post the charts first and then explain each one in detail later
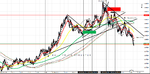
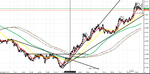
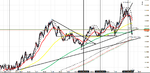
This first chart is up to the London Open at 8 00 am
Its shows a clear bull price structure over the Asian session and early Am
Notice the Lrs - long one under price and the proper traffic light sequence on the red yellow green

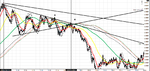
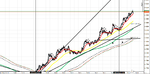
The second chart shows the start of the change after LO
Time is major in intraday trading as well as S & R levels

We are still in a bullish price structure above the Trendlines and the long dotted Lrs
But notice the change in PA and the mid red / yellow / green LR positioning
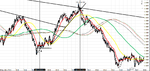
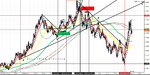
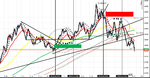
Next last chart and I have shown the 2 critical S & R levels marked as green and red

Price as dropped over 80 pips from its high and over 65 pips from after LO
Notice the new LR structure now as well
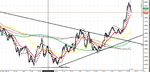
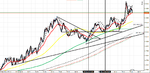
I will post another chart later as well
This is for Sun and all other followers
I have chosen the EA as the example - to clarify the Lrs - and also the clues you look for etc etc
I will post the charts first and then explain each one in detail later
This first chart is up to the London Open at 8 00 am
Its shows a clear bull price structure over the Asian session and early Am
Notice the Lrs - long one under price and the proper traffic light sequence on the red yellow green
The second chart shows the start of the change after LO
Time is major in intraday trading as well as S & R levels
We are still in a bullish price structure above the Trendlines and the long dotted Lrs
But notice the change in PA and the mid red / yellow / green LR positioning
Next last chart and I have shown the 2 critical S & R levels marked as green and red
Price as dropped over 80 pips from its high and over 65 pips from after LO
Notice the new LR structure now as well
I will post another chart later as well
Attachments
Last edited: