You are using an out of date browser. It may not display this or other websites correctly.
You should upgrade or use an alternative browser.
You should upgrade or use an alternative browser.
A Master Class in FX Intraday Trading by F & Co
- Thread starter Forexmospherian
- Start date
- Watchers 38
- Status
- Not open for further replies.
Forexmospherian
Legendary member
- Messages
- 39,928
- Likes
- 3,306
Got it..no will not try it.
I like simple thing..😉
but in general sense...do you think daily ATR is effective on intraday trading?
Like every clue or clue in trading - nothing is 100%
ATR maybe 60 -80% of the time work - GU normally moves from say 80 to 120 pips a day - but we can have 70 pip days and 160 pip days etc- and even 250 pip days every now and again
All the standard stats traders use - i tend to ignore - because the market makers know all the traits of traders - so I dont want to be with the masses etc - and end up getting caught out
I agree keeping thing simple in any walk of life is best route
In trading though - to get the results we want - ie 20 -50% gains a month on retail accounts - you have to think outside the box and tackle complex variables - to get the "edge"
👍
Forexmospherian
Legendary member
- Messages
- 39,928
- Likes
- 3,306
have a look
What size is this set up ?
What size is this set up ?
every candle represent 5 pips and for opposite scenario 15 pips.
if the Previous candle was green then the current candle will be close above 5 pips from the high of the previous candle and opposite scenario it will be close under neath the previous candle low and will make -15 pips.
Forexmospherian
Legendary member
- Messages
- 39,928
- Likes
- 3,306
GU
Above 60 on pullbacks - still another buy with high so far 87
Above 60 on pullbacks - still another buy with high so far 87
Like every clue or clue in trading - nothing is 100%
ATR maybe 60 -80% of the time work - GU normally moves from say 80 to 120 pips a day - but we can have 70 pip days and 160 pip days etc- and even 250 pip days every now and again
All the standard stats traders use - i tend to ignore - because the market makers know all the traits of traders - so I dont want to be with the masses etc - and end up getting caught out
I agree keeping thing simple in any walk of life is best route
In trading though - to get the results we want - ie 20 -50% gains a month on retail accounts - you have to think outside the box and tackle complex variables - to get the "edge"
👍
Truly agree. In fact my goal is to make 100 Fold on my small account. Which is impossible though...But If gain a proper mind set & successfully achieve 500 pips per month for at least 6 months. Then perhaps it can happen...or at least 10 fold can happen..I guess.
GU reached 4485 zone. I have sell trade from 81. Closed at 4 pips profit.
Forexmospherian
Legendary member
- Messages
- 39,928
- Likes
- 3,306
Back after Midday next
See you in a bit
See you in a bit
Plz have a Look...
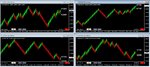
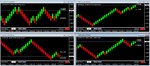
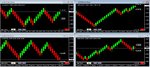
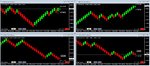
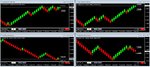
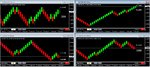
These Charts are purely based on Price Action with only pips movement with no time frame involve...
best for support & resistance...
best for trending...
1st chart = 2.5 Pips. = if previous candle closed in Green/Red the next candle will follow up with same colour and will make 2.5 Pips Profit. in opposite scenario it will close against the colour of Previous candle and will make 7.5 Pips Loss.
2nd chart = 5 Pips. = if previous candle closed in Green/Red the next candle will follow up with same colour and will make 5 Pips Profit. in opposite scenario it will close against the colour of Previous candle and will make 15 Pips Loss.
3rd chart = 7.5 Pips. = if previous candle closed in Green/Red the next candle will follow up with same colour and will make 7.5 Pips Profit. in opposite scenario it will close against the colour of Previous candle and will make 22.5 Pips Loss.
4th chart = 10 Pips. = if previous candle closed in Green/Red the next candle will follow up with same colour and will make 10 Pips Profit. in opposite scenario it will close against the colour of Previous candle and will make 30 Pips Loss.
5th chart = 20 Pips. = if previous candle closed in Green/Red the next candle will follow up with same colour and will make 20 Pips Profit. in opposite scenario it will close against the colour of Previous candle and will make 60 Pips Loss.
Profit/Loss mean the candle will be close in Pips
hope it will make sense...
Regards
Raja
Attachments
Last edited:
Forexmospherian
Legendary member
- Messages
- 39,928
- Likes
- 3,306
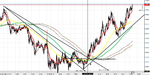
GU
Above 60 on pullbacks - still another buy with high so far 87
Over 50 mins later from above comment
Stalling around a big number - 4500 ish

Now

Attachments
Forexmospherian
Legendary member
- Messages
- 39,928
- Likes
- 3,306
Midday Updates
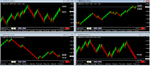
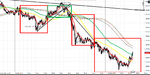
EA - still cannot make under supports at 5430 - although still in bear sell bias
EJ
Update chart again from yesterday and this morning
Had to use a 2 min as could not go back far enough on a 1 min

Now

EA - still cannot make under supports at 5430 - although still in bear sell bias
EJ
Update chart again from yesterday and this morning
Had to use a 2 min as could not go back far enough on a 1 min
Now
Attachments
Forexmospherian
Legendary member
- Messages
- 39,928
- Likes
- 3,306
every candle represent 5 pips and for opposite scenario 15 pips.
if the Previous candle was green then the current candle will be close above 5 pips from the high of the previous candle and opposite scenario it will be close under neath the previous candle low and will make -15 pips.
Which size candle do you prefer - or is most profitable most days ??
Which size candle do you prefer - or is most profitable most days ??
for short term 10 = mean some around 1 hr to 5 hr
for long term 20 = mean 1 day - 5 days
Forexmospherian
Legendary member
- Messages
- 39,928
- Likes
- 3,306
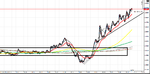
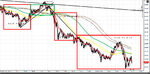
I dont normally trade the AU every day - prefer Euro crosses and GU
This morning though with EA being bearish - by rights AU should maybe be bullish
And it as been from 6 00 am
Missed a lot of that action though - but a perfect one for SUN
Would be good to see your new AU chart with 450 Lr highlighted on AU Sun
Here's mine

AU
Midday update
Nearly 4 hrs later than chart above
Update -

Attachments
Forexmospherian
Legendary member
- Messages
- 39,928
- Likes
- 3,306
for short term 10 = mean some around 1 hr to 5 hr
for long term 20 = mean 1 day - 5 days
Would 5 be like a scalping set up for say 30mins to 2 hrs ?
Also would you have to use 25 + pip stops on 10 and at least 50 pips on 20 setting ??
This is maybe the weakness - I try to work off stops of 3 -7 pips for every trade - ie from 7 pips to 700 pip moves etc
Results - better RR's and therefore higher returns etc
Forexmospherian
Legendary member
- Messages
- 39,928
- Likes
- 3,306
Back before red news at 1 15 pm and then 3 00 pm & 3 30pm - all US Dollar related
Forexmospherian
Legendary member
- Messages
- 39,928
- Likes
- 3,306
GU almost about to make 30 minutes around the 4500 zone. Below 4500 will plan to sell. Otherwise above 4510 more buy.
Hi Sun
1 08 pm
I have it at 4511/12 and above 4500 on pullbacks still a buy again
News in 7 mins - yes 1 15 pm
Regards
Hi Sun
1 08 pm
I have it at 4511/12 and above 4500 on pullbacks still a buy again
News in 7 mins - yes 1 15 pm
Regards
I missed it for but it didn't moved much higher. Now falling..news coming up.
Lets see where it goes.
Forexmospherian
Legendary member
- Messages
- 39,928
- Likes
- 3,306
GU almost about to make 30 minutes around the 4500 zone. Below 4500 will plan to sell. Otherwise above 4510 more buy.
Sorry Sun - I have read what you have said and would have to disagree
I had first high at 4504 and 11 48
That held but was breached after 12 31/2 pm - just over 30 mins but was equalled in between at exactly Midday
Then after 12 28 pm still a scalp buy at 4492 and made over 4504 and kept going
So time rule was met and it still carried on rising
The devil is in the detail
MT4 cannot supply enough detail on time and price - thats my problem I have with it
It does not matter for 90% of methods - but for accuracy - we need really accurate time and price - ideally off a tick chart with time shown every 30 secs
High now testing over 4518
I just hope you did not sell - as you read it wrong - but no problem
- Status
- Not open for further replies.
Similar threads
- Replies
- 1K
- Views
- 163K
- Replies
- 67
- Views
- 23K
- Replies
- 11
- Views
- 3K
- Replies
- 10
- Views
- 8K