You are using an out of date browser. It may not display this or other websites correctly.
You should upgrade or use an alternative browser.
You should upgrade or use an alternative browser.
Articles
In this article the author explains the basics about Neural Networks and looks at the myths that have formed around them.
In this age of previously unheard of technological progress many technology-related things either come unnoticed as they appear or, vice versa, are vastly extolled and turned into totems that inevitably attract a following of ardent worshippers. If such a popular technology-related phenomenon can make a difference to your business, it is, sometimes, vital to learn about this phenomenon as much as possible before you start with it so that you know what to expect from the selected technology and what to beware of while using it. For a modern trader, one of such potentially important phenomena is neural nets.
So what...
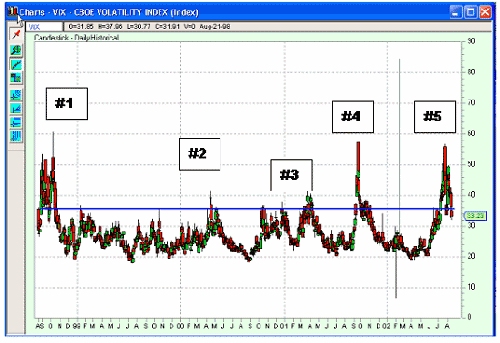
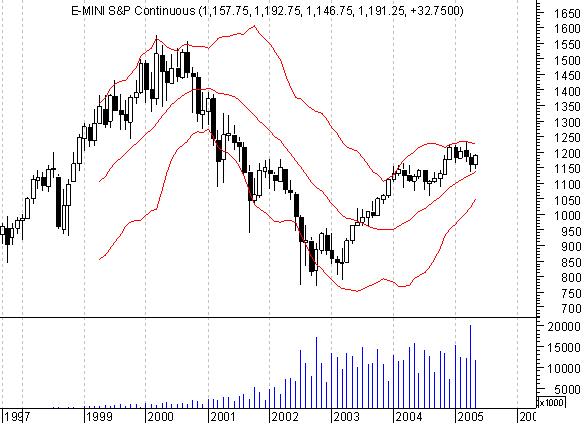
The author looks at the Vix indicator and its use in predicting the market turn of 2002.
In the last 2 weeks, I have seen the "VIX" on both CNBC and Bloomberg TV talked about as if it was something new. Well, for all you OTA Grads, you know we have been using it for years. For the rest, let's review and see how this "new" indicator can help us.
Let's look back at the turn in the markets in 2002.
The VIX is provided by the Chicago Board of Options Exchange (CBOE) and, basically, measures the volatility in the options markets, which of course, are directly related to the underlying security in the stock market. VIX (generally, you can see this with the VIX symbol, but your platform may require a prefix or suffix such as $vix, /vix...
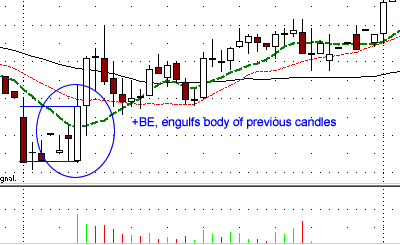
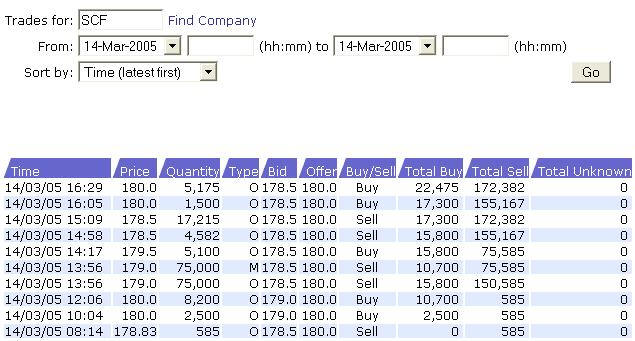
This brief video clip is one of a growing library of over-the-shoulder videos I have made to help people learn tape reading by seeing examples for themselves. They are not structured teaching videos as such, more commentary.
As they were created live at the time I was able to point out some of the features as different participants including market makers and ECNs moved in and out of the bid and ask sides and other factors as well, such as the trades printing off on Time and Sales and so on. Because they are live it simply isn't possible to mention every single factor influencing the moves in the time frame of the action, so they are worth watching several times to spot all the influences.
In this particular video you will see my...
What are the significant factors that need to be considered when looking to create a trading system. In this article we look at how to start creating your own system.
Its long been understood by most and proven by experience that trading is a hard trade to ply, and those who decide to tread on this path have to take their bearings on a variegated sea of information, diverse and, oftentimes, controversial. A tyro trader is flabbergasted by the panoply of approaches, trading means, and celebrated personalities as soon as he opens his first trading magazine. Poised for choice, he kicks off browsing Internet forums, turns for dubious advice to his slightly more versed acquaintances or joins one of the guru-lead sects that dispense...
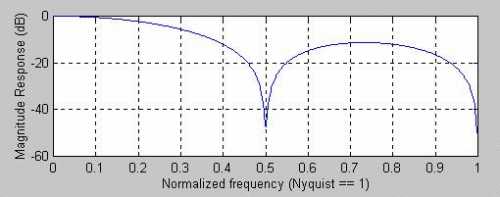
Simple Moving Averages are a subset of FIR Filters. Exponential Moving Averages are a subset of IIR filters. Traders are not necessarily limited to the selection of one or the other. This article describes how you can make hybrid filters and realized the best characteristics of both.
Many traders have come to me, asking me to make their indicators act just one day sooner. They are convinced that this is just the edge they need to make a zillion dollars. While their profit expectation may not be realized, it is true that lag is the downfall of many trading systems. If you want to shorten the lag of your indicators, or if you want to get more smoothing from your filters, the techniques in this article may be just what you have been...
There is more to smoothing an RSI than just taking a moving average after the RSI is computed. By applying some advanced filters in the process of computing the RSI you can not only get better smoothing but also enhance the turning points of this proven indicator.
Smoothing indicators usually means making a tradeoff between the amount of smoothing you desire and the amount of lag you can stand. It turns out that the RSI can be smoothed and enhanced with minimum lag penalty. The thesis of this article is to show you how this is done.
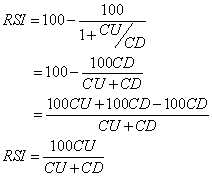
Welles Wilder defined the RSI as
RS is shorthand for Relative Strength. That is, CU is the sum of the difference in closing prices over the observation period where that difference is positive...
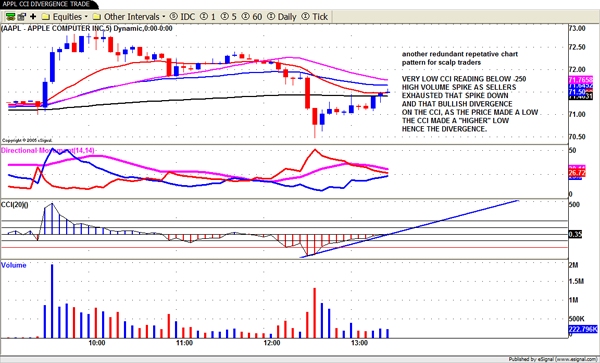
Jerry gives us another of his humourous, educated article on chart patterns using the CCI.
We as traders have been looking for the "Holy Grail" for a lifetime. I doubt there is one folks. But all thru my 65 years on this planet I certainly have tried every known indicator, oscillator, etc to get to that Holy Grail. Well I can tell you all I think I found the Holy part of that statement in the momentum indicator the Commodity Channel Index, CCI for short.
Many traders swear by the Macd, Stoch, Rsi, Obv and on and on. The CCI with a 20 moving average (20) is the best leading momentum indicator I have ever used in my trading life. I will include a series of charts depicting the way I use CCI in the exciting world of daytrading which I do...
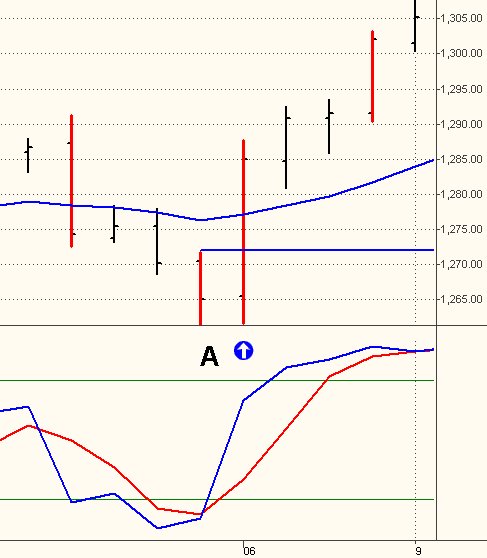
The pattern provides traders with a tool to identify short-term reversal points and assess their potential. It is based on the Market Facilitation Index (MFI), which is the ratio range/volume. This indicator allows you to determine the efficiency with which prices change and the market's ability to move prices. Bill Williams presented the indicator in his book Trading Chaos. The indicator is built comparing changes of the previous bar's value of this index to changes in volume. Using this indicator, it is possible to determine the interest that the market has in the current price trend. You can assess the public involvement in the price action and its influence on price movement.
To assess potential reversal points, the most...
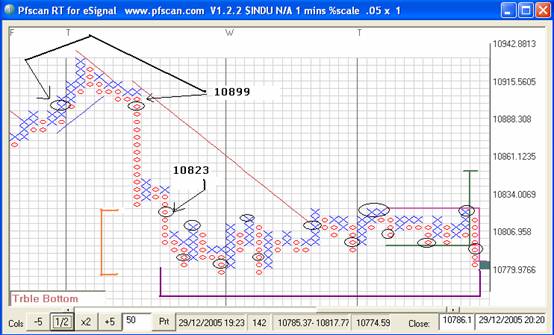
[Editor's note: This article was originally written on the 30th Dec, 2005]
Okay, so make your own title up!
In Part 1 I set out the basic ideas of P&F charting. For anyone who would like to read more on the subject there’s an absolute plethora of material out there – one book I’d thoroughly recommend is ‘Point & Figure Charting - The Complete Guide’ by Dr Carroll D Aby Jr. This book doesn’t waffle, which many do, and it’s the only one I’ve found that highlights variations in the methodology – depending on who you read and where you’ll find some target calculations can be performed several different ways for example.... I consider it a mark of thoroughness that this book considers some alternatives to the ‘tools’ of P&F. I’d add this...
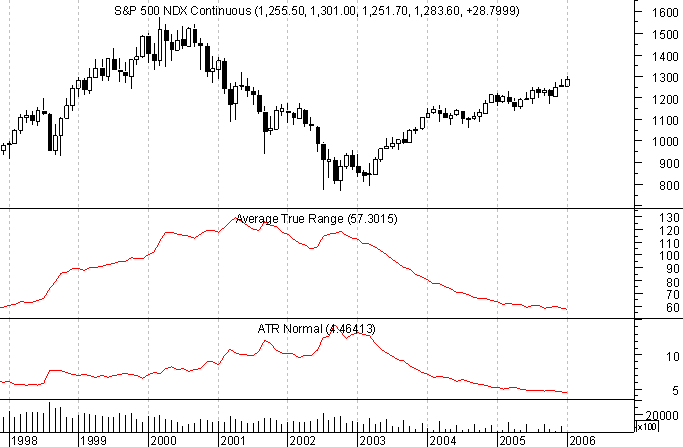
The Average True Range (ATR) indicator is one which falls in the general category of volatility-based technical analysis tools. It is so because like Bollinger Bands, another volatility-based study, it does not focus on direction in any way, but rather how much raw movement there is in price. To understand this a little better, it is worth taking a look at how the indicator is calculated.
ATR Calculation
The ATR calculation starts with determining the True Range (TR). The TR for a given period is defined as being the largest of:
Current Period High minus Current Period Low
Current Period High minus Previous Period Close
Previous Period Close minus Current Period Low
ATR is the average of the True Range (TR) over the past n...
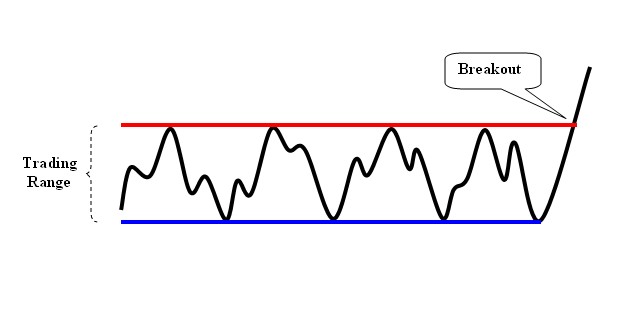
Breakouts out of trading ranges are of the most respected price movements by technical analysts. Trend followers adore them and short term swing traders who base their decisions upon overbought-oversold situations get anxious at their appearance. Technical analysis textbooks have a special section devoted to range breakouts and almost all trading methodologies incorporate a strategy for them.
In this article I will briefly review the classic breakout strategy and discuss the Habit Force which is hidden behind the false breakouts. In the sequence I will discuss the CWTW and CounterAttack tactics.
Trading Ranges - Review and Classic Tactics
In figure 1 you may see how a classic trading range looks. As its name implies, a trading range...
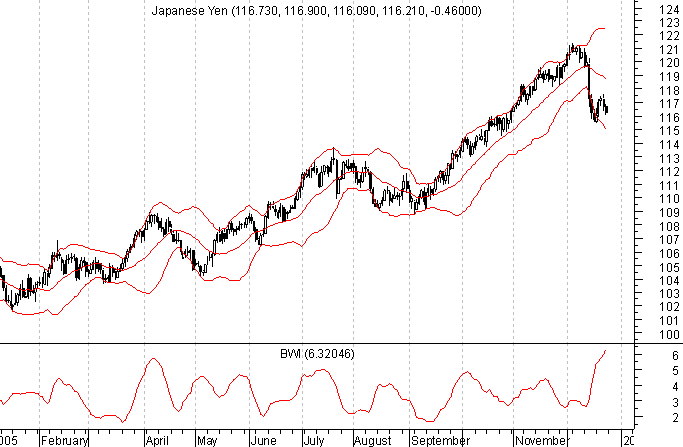
Bollinger Bands are among the most commonly found technical indicators these days. Even the most basic of charting applications include them among the available offerings. There are many ways the Bands can be incorporated in to one's market analysis and trading methods (see Bollinger Bands - The Basic Rules for a discussion). This article focuses on how they can be used to find markets in the early stages of significant directional moves.
The process of trend identification using Bollinger Bands starts with evaluating the width of the Bands. This is done using the Band Width Indicator (BWI), which is calculated as follows:
BWI = ( UB - LB ) / MB
Where UB is the Upper Band, LB is the Lower Band, and MB is the Middle Band.
Using...
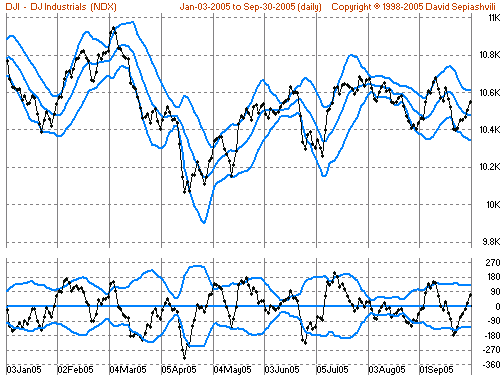
Limitations in usefulness of conventional standard deviation bands as overbought/oversold benchmarks
One of the popular ways of detecting a trend in financial market time series corrupted by random fluctuations (noise) is moving average smoothing. Actual prices fluctuate around the moving average. To measure an average distance of price values from the moving average the standard deviation (SD) can be used. The so-called in statistics "range rule of thumb" determines the range of price variability around the moving average as approximately 4SD, providing confidence limit of about 95.5 %. According to the rule, the upper boundary of the range will be about 2SD above the moving average and the lower boundary of the range will be about...
Looking at all of the glossy ads promoting analysis software, educational courses, seminars, workshops, newsletters, past gurus, new gurus, astrologers etc. you could be forgiven for thinking that taking profits out of markets is simply about something called 'forecasting'...
All you need to do, apparently, is pay your money and you too can forecast with such amazing accuracy that you'll be able to trade on the hoof for just an hour a day as you travel from beach resort to, er...beach resort. Yes, it's really you on the lounger by the pool in that promo!
Strangely enough, trading is not like that. Professional traders have nothing but disdain for the hype and misinformation peddled largely by those catering to the masses of private...
Candlestick Charting
Candlestick charting originates from Japan, where it was used from the 17th century to examine patterns in the price of rice. Candlestick charting has come a long way since then and is now part of the mainstream technical analysis toolkit. Reading candlesticks is an attempt to understand the collective emotions that drive the financial markets every day.
Candlesticks are formed using the open, high, low and close of a stock or other security. If the close is above the open, then a hollow candlestick (an up day) is drawn. If the close is below the open, then a filled candlestick (a down day) is drawn.
The hollow or filled portion of the candlestick is called the body (also referred to as the "real body"). The...
There are a large number of traders who look at Point & Figure charts, with "look" being the operative word. That is, for most traders, once the market data gets represented as a P&F chart, they are at the end game. If the last x entered is in one box higher than x's in other columns, you've got a "buy signal".
Why is that so? Because someone eons ago said so. What's the proof? There is none; that's just the way it is. Now, don't go thinking that I am going to trash P&F. Au contraire. I'm going to show you why it's a great tool, how to test its efficacy and use it more effectively.
Before I really get started, let me explain that not everyone considers P&F charts as something only to look at. One extremely respected investment...
The Percent Range (%R) technical indicator was developed by renowned futures author and trader Larry Williams. This system attempts to measure overbought and oversold market conditions. The %R always falls between a value of 100 and 0. There are two horizontal lines in the study that represent the 20% and 80% overbought and oversold levels.
In his original work, Williams' method focused on 10 trading days to determine a market's trading range. Once the 10-day trading range was determined, he calculated where the current day's closing price fell within that range.
The %R study is similar to the Stochastic indicator, except that the Stochastic has internal smoothing and that the %R is plotted on an upside-down scale, with 0 at the top...
Moving averages and their crossovers or crossovers with indicators are widely used in trading and
technical analysis. Shorter averages above longer averages or closing prices above them suggest an uptrend. An indicator below its moving average is a sign of a downtrend. It would be beneficial for a
trader to develop a technique to predict the closing price which will generate a crossover of averages as described above. This article introduces such an anticipation technique, based on moving averages, to determine the future closing price for which a
trend change is possible.
Let's look at figure 1 representing the German
DAX index. Subchart 1 contains two simple moving averages: 5- and 10-day, SMA5 and SMA10. It is well-known among...
The Proof is in the Trading
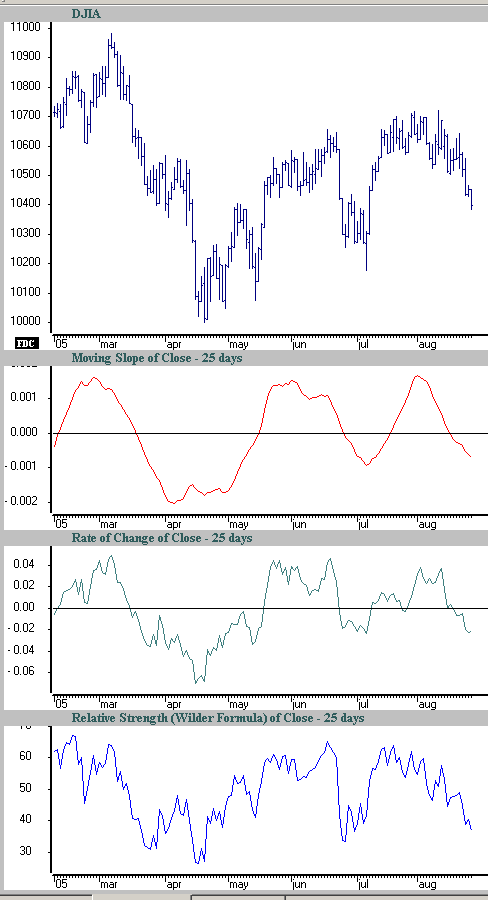
In my recent TASC article, "The Hunt for Superior Signals - Two Moving Function Hybrids" (September 2005), I recommended that the Moving Slope Rate of Change ("MSROC") be a part of every trader and researcher's toolbox. A quick look at this indicator demonstrates its value:
As you can see, the moving slope rate of change is remarkably smooth. Instead of using just a change in price to calculate slope (as with rate of change or "ROC"), we use the slope of a least-squares line to calculate MSROC. [Instructions for MSROC calculation are at the end of the article.] Least-squares lines are notoriously smooth. This smoothness is a major asset, as it minimizes the need for further qualification or...
I use chart patterns in my trading because they give me tips on how a stock will perform. Sometimes the tip turns out to be a lie, but that's okay. I use stops to limit losses (don't you?). When the tips are accurate, I clean up. This article discusses two such tips: partial declines and partial rises. They forecast the breakout direction from a chart pattern.
When I wrote this in January 2003, we were still in a bear market, and so I concentrated on partial declines -- they predict upward breakouts. What does a partial decline look like? Consider Figure 1, a chart of a broadening bottom. That's my term for what's usually called a broadening top, but I found performance differences between tops and bottoms. For the latest statistical...
Just a mere decade ago, most investors had to depend heavily on the Wall Street "professionals". Research and technical investment information was difficult to access other than through the brokerage firms. Fortunately, the advent of internet investing has completely altered the limitations that most investors had to overcome; getting information to do their own analysis.
The past decade has witnessed tremendous advances in the utilization of computer generated technical analysis. The average investor now has the capability to create any investment trading program that they can imagine. The abilities of computers have been able to greatly enhance the performance of successful investment methods. The candlestick trading method has been...
Support and resistance levels on bar charts are a major component in the study of technical analysis. Many traders, including myself, use support and resistance levels to identify entry and exit points when trading markets. When determining support and resistance levels on charts, one should not overlook the key Fibonacci percentage "retracement" levels. I will detail specific Fibonacci percentages in this feature, but first I think it's important to examine how those numbers were derived, and by whom.
Leonardo Fibonacci da Pisa was a famous 13th century mathematician. He helped introduce European countries to the decimal system, including the positioning of zero as the first digit in the number scale. Fibonacci also discovered a...
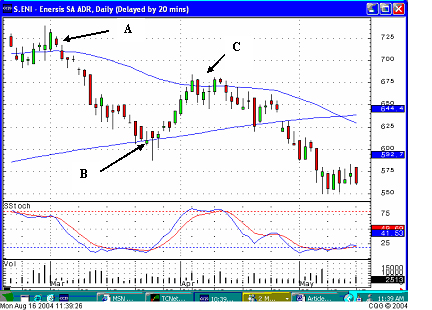
Systematic or discretionary? It's an important question on the way to trading success. Most traders eventually end up belonging to either one or the other philosophical camp. In this article, Harald Weygand introduces an approach that most likely will interest the discretionary traders among our readers.
Traders and chartists can be categorised in various ways. Among the possibilities are system traders and intuitive chart readers. System traders develop a comprehensive set of rules, weighing statistics, utilising vast arrays of indicators and weaving intermarket correlations. Finally they combine several systems after extensive back testing. The computer, not the person, screens the market applying the system. System traders with...
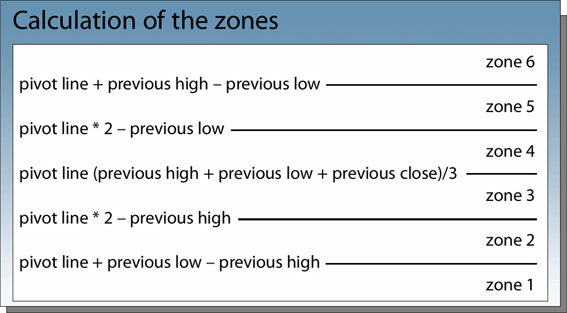
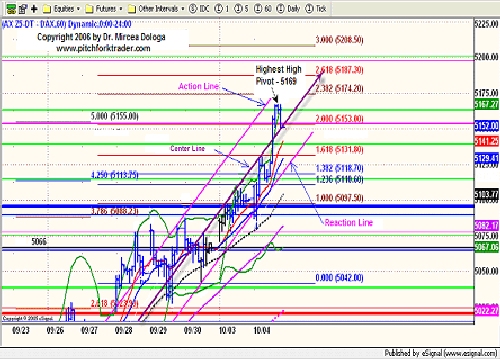
Pivot zones can be very revealing to traders. J.T. Jackson has conducted extensive statistical research on a variety of US markets. His research has shown that traders can use daily market action to determine specific probabilities for price to trade within a certain area, and also to highlight support and resistance areas for the following day. These statistics can help enhance the quality of trading signals and (increase the "hit rate" - or number of winning trades). Additionally, these statistics offer insight into the current trend of the market and can signal the underlying strength of the trend. In the following article, this concept is applied to the Dax future, using end-of-day data for the period from 1998 to 2003.
The concept...
Trend analysis is a complex process that goes beyond trend lines, channel lines and retracements. An important aspect of this type of analysis is the identification of patterns that reinforce trends and of formations that signal the reversal of trends.
Chart formations that show the extension of trends are called continuation patterns. They consist of pauses within trends and they are generated by traders who realize some or all of their profit typically ahead of significant releases of economic data or strong technical level. These behavioral patterns translate into chart formations and tend to look like neutral moves. However, they can either slope against the original trend or, more rarely, slope in the direction of the trend...
One of the great joys of having invented an analytical technique such as Bollinger Bands (see desc. below) is seeing what other people do with it. While there are many ways to use Bollinger Bands, following are a few rules that serve as a good beginning point.
Bollinger Bands provide a relative definition of high and low.
</span />That relative definition can be used to compare price action and indicator action to arrive at rigorous buy and sell decisions.
Appropriate indicators can be derived from momentum, volume, sentiment, open interest, inter-market data, etc.
Volatility and trend have already been deployed in the construction of Bollinger Bands, so their use for confirmation of price action is not recommended.
The indicators...
Understanding the way volume affects the market is key to successful trading, as price signals won’t always tell the whole story. Professional traders have one advantage over the private trader: they can read volume. Not only that but they can – and will – hide volume from you to give themselves an advantage. Large banks and brokerage houses claim that to make a market, they need an edge over the rest of the crowd. Large orders that are processed do not appear on the tape, as they would show up on the radar of other professional traders who would then change their bid/offers or pull orders.
The professional trader uses price and volume, and usually no other indicator, to read the true balance of supply and demand, as Richard Wyckoff...
There has long been debate about price data and what kind of data are most appropriate for market analysis and reference. Much of that discussion revolves around traded price vs. indicative price. The former is the actual price at which a transaction is executed, while the latter uses the bid/offer as the basis for price series.
In the stock market, and most exchange-based markets, much of what is presented to the public is the last traded price. When one looks at the stock tables in the paper, or at the quotes presented on many screens, that is what they see. In many cases, this presents a fair representation of the market. The widely known and understood exception is thinly traded markets where the instrument in question (stock...
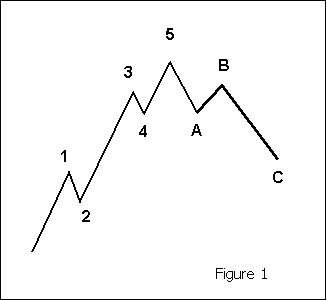
Elliot Wave theory was initiated in the 1930s by Ralph Nelson Elliot. His basic theory was that crowd behaviour, the basis for market activity, tends to operate in recognisable phases, and as such, price movements can be anticipated to some degree.
During his early studies, using Stock Market data for his analysis, Elliot isolated thirteen examples of patterns - or waves - that are repetitive in their form only, and that the time and amplitude of the waves need not necessarily be repetitive. To demonstrate what he learned, Elliot named, defined and illustrated each pattern, showing how several small patterns could be brought together to create one larger example of the same form, which would in turn merge into another, larger version...