You are using an out of date browser. It may not display this or other websites correctly.
You should upgrade or use an alternative browser.
You should upgrade or use an alternative browser.
Articles
Pivot Points have been used by floor traders at the major equities and futures exchanges for a long time. Traders found that the price tended to hover near the pivot level and trade in between the pivot and support and resistance levels generated by a simple calculation based on the previous day's high low and close. One advantage of using Pivots is they are a predictive indicator as opposed to lagging.
Predictive Vs Lagging Indicators
The majority of technical indicators most traders use such as moving averages and RSI are lagging. Meaning they are telling us what has already happened, or at best, what is happening in real time. Few indicators are predictive; one type of predictive indicator is Pivot Point study. Pivot Points use old...
Market Profile is a powerful statistical analysis tool developed by J. Peter Steidlmayer and the CBOT during the 1980s. This article introduces traders to the Market profile tool and goes over the basic uses and functions.
Introduction:
Market profile is a technical analysis tool developed by J. Peter Steidlmayer in conjunction with the Chicago Board of Trade in the mid 1980s. Market Profile is a statistical analysis of time and price to create a graphical representation of a trading session or multiple trading sessions. Price is plotted on the vertical axis, and time is plotted on the horizontal axis. Market Profile essentially puts a daily bar or candle under a microscope. By looking at a bar with the naked eye, all we know is where...
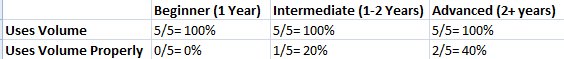
A few weeks ago I talked to 15 different traders: 5 of them have been trading for less than a year, 5 of them have been trading for 1-2 years, and 5 of them have been trading for over 2 years. I asked each of them if they use volume in their trading, and because they know how important I think volume and price action are, they all responded "yes".
Having established that all 15 of these traders are using volume, I wanted to know exactly how they are using it and whether or not they are using it correctly. I remember as a newer trader I always would say that I was using volume but I really didn't know how to properly utilize volume. So I spend just a minute or so showing each of these traders a chart and asked them to analyze exactly...
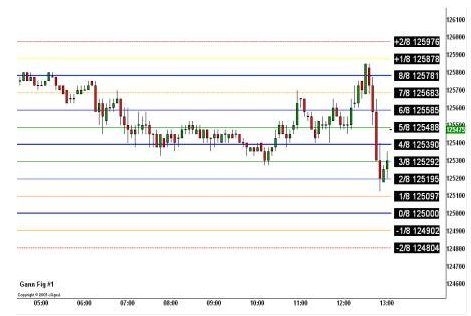
W D Gann had a number of approaches to predict market action. His techniques have been regarded as complex and difficult to implement & understand due to the lack of clean information he left. His 'Harmonic Rule of 1/8's is not to be confused with his more widely recognized 'Square of 9s' method.
Gann's Rule of 1/8's is based on specific arithmetic geometry, more specifically 'fractal arithmetic geometry'. When that 'geometry' is constructed properly, (Gann referred to them as 'Octaves, Squares or Boxes), we can apply a set of rules that has predictive capabilities in any market that can be plotted. Does the predictive outcome, using the rules, work all the time? NO. Losing is part of trading. As traders, we attempt to eliminate...
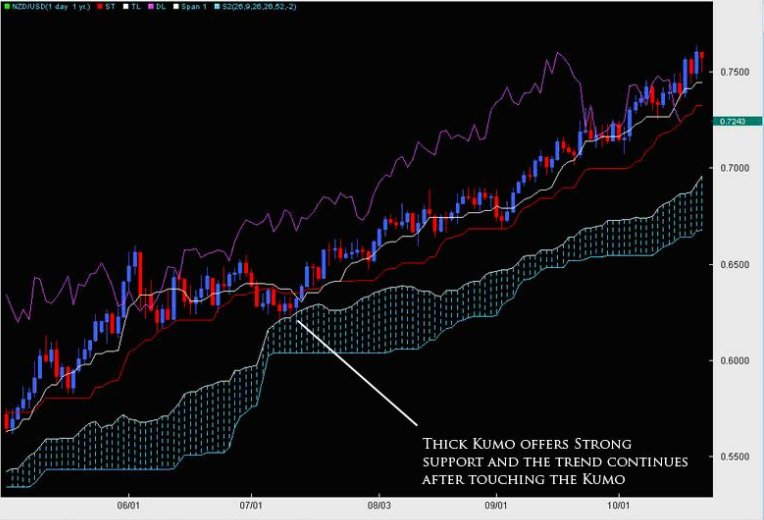
Still growing amongst the Western and European traders, the Ichimoku Cloud (or Ichimoku Kinko Hyo = One Glance Balance Cloud Chart) was originally developed pre-WWII by a man named Goichi Hosada. Because of the war, his research was halted and then later finished in 1968 whereby he published a 1,000 page, four volume body of work releasing the Ichimoku Cloud to the world under the pen name Ichimoku Sanjin.
Originally built for the Japanese stock markets, the indicator has made its way out of the land of the Eastern sun and into the trading world at large, being applied and used widely in the Commodities, Futures, Options and FOREX markets. Part of its success is its ability to find trends and reversals well before they begin.
The...
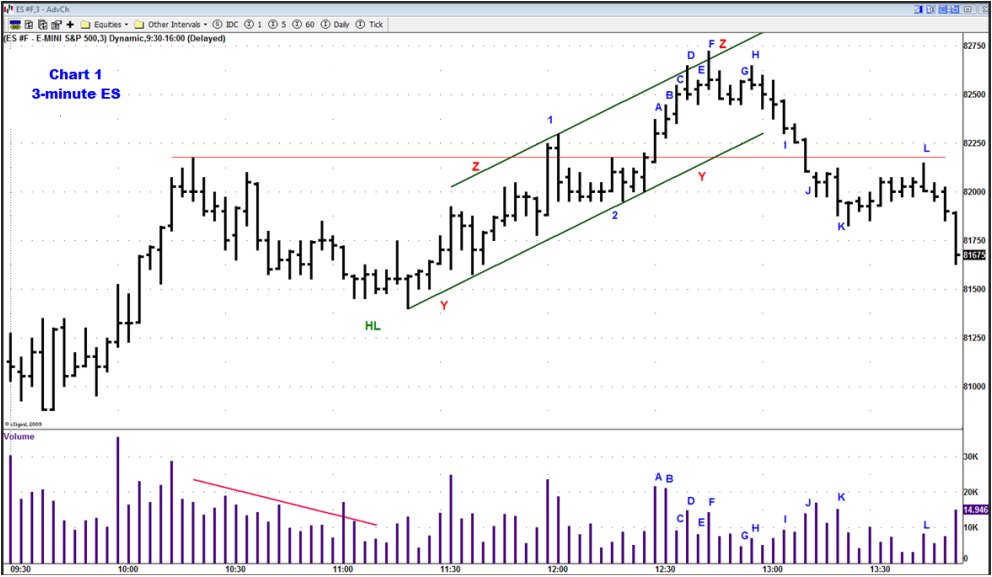
Here is an example of using the Bar-by-Bar method to read the market based on its own actions via Wyckoff Method of Market Analysis. This example shows how to integrate background conditions or market structure, trend lines, multiple time frames, and the individual bars as it unfolds on the chart. This is from the S&P e-mini market on 3 and 15-minute time frames. The method is applicable in any market on any time frame.
Chart 1
Background - Price rallied after the open, and then spent an hour reacting in a slow drift down. Volume was less on the reaction than the volume on the rally off the AM lows (seen by the red line). Spreads were also generally narrower on the reaction, and as the reaction progressed, volume receded. A...
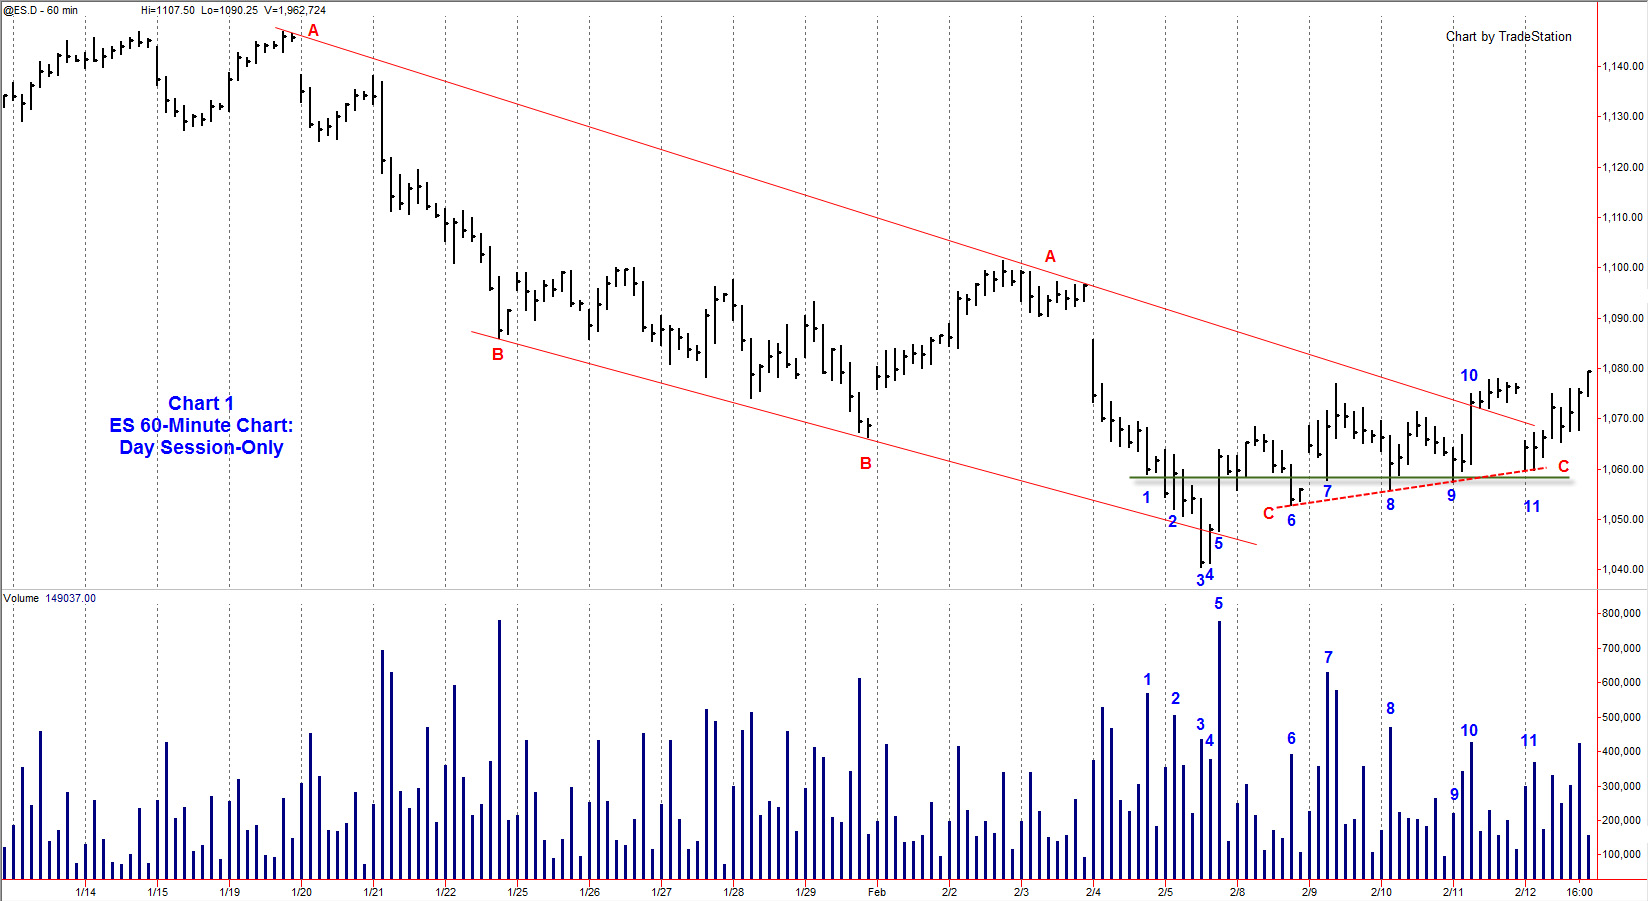
Many traders do not use volume in their market analysis and trading. They rely on price bar patterns and technical indicators. Price alone can be misleading and technical indicators frequently signal miss-fires. Understanding the interaction of price and volume can help put the trader on the right side of the market regardless of the trading method used. Here is a recent example of how the S&P e-mini market unfolded. Reading the interaction of price and volume led to both intraday and swing trades.
Background: 60-Minute Chart
The S&P e-mini market had reacted into early February from its highs in January 2010. The reaction was well-defined on the hourly chart (Chart 1) by the trend lines AA and BB, which together formed a channel. Line...
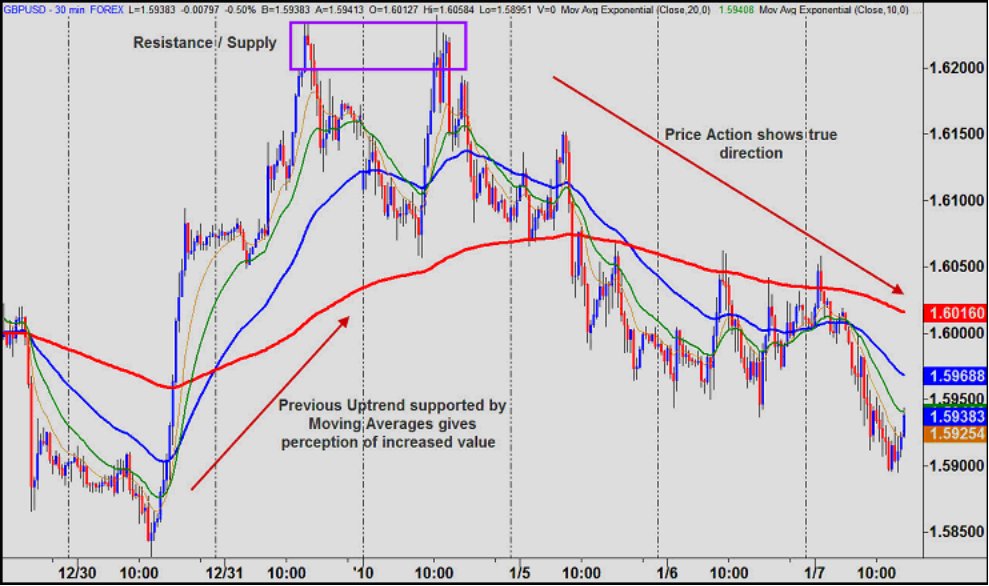
Time and time again, I have said that all humans were never designed to become consistently profitable traders. There are many reasons why the majority of individuals fail to make regular profits from Forex trading, but in the end, it all stems from the simple fact that most people are completely unaware of the difference between perception and reality.
Ever since people began to speculate in the money markets, there has been this common belief that only the top guys in Wall Street have the experience and knowledge to do it successfully. The average Joe has always been advised to stay well away from making their own trading and investing decisions and instead hand over their hard-earned cash to the experts in the institutions to make...
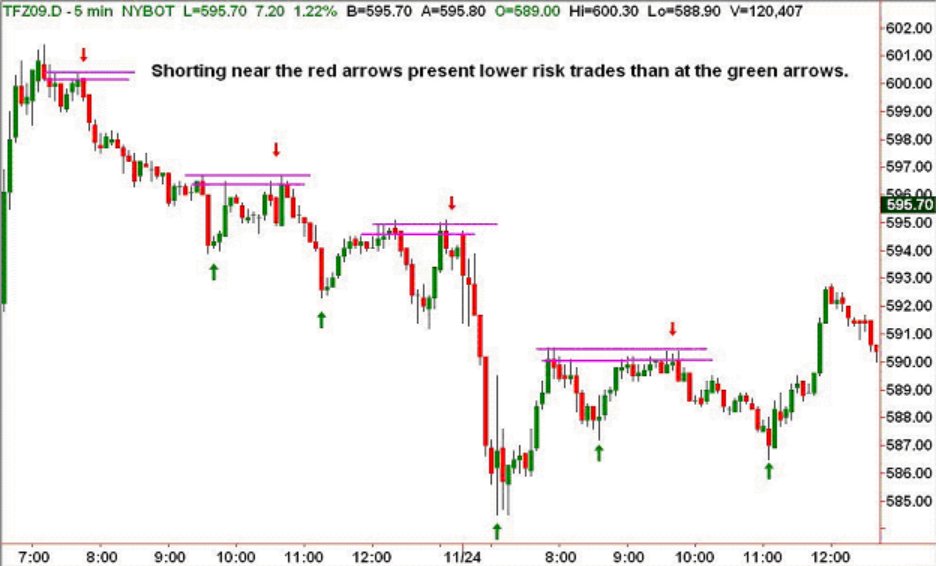
I have previously discussed the fractal nature of markets and specifically the fact that there are always smaller tendencies contained within the larger more dominating trends. Also the old Wall Street maxim "buy low, sell dear," adding that though this concept is seemingly easy to understand, the reality of putting it into practice is a bit more challenging.
In this article, I'm going to elaborate on the notion of buying when prices are moving lower, and selling, or shorting, when prices are heading higher, all within the context of a trend. This concept is sometimes hard for new traders to understand, as it seems to run contradictory to trading in the direction of the line of least resistance.
I often get a bewildered look from...
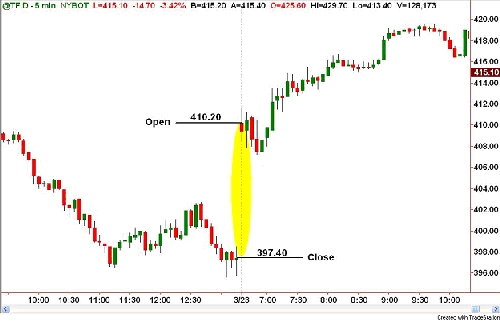
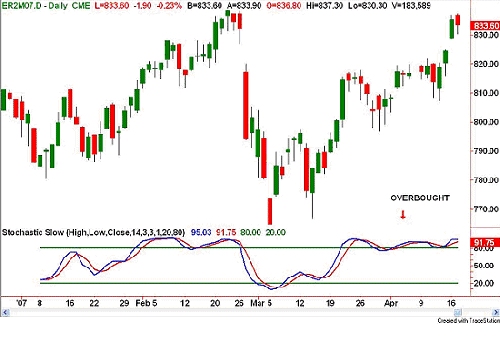
One of the most regular and largely misunderstood phenomena of trading, particularly for newer traders, is the gap. What precisely is a gap? What causes one to happen? And most importantly, how should one trade a gap when it occurs?
In this article, I'll answer these questions, and delve into identifying higher probability assessments for trading gaps.
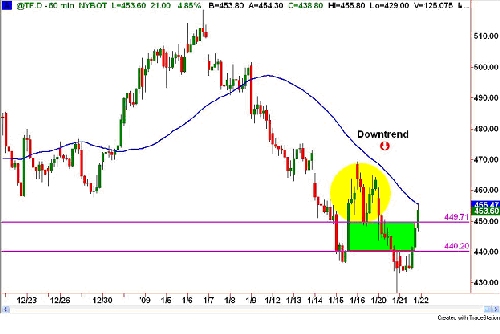
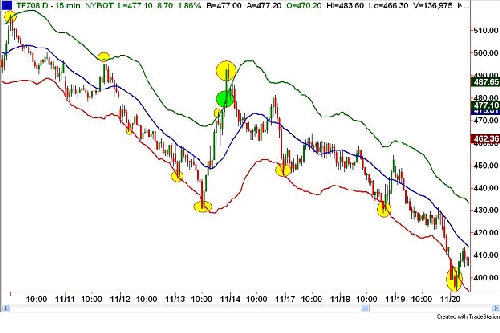
First, a gap is the discrepancy between one day's opening price and the prior day's closing price. The chart below clearly illustrates a large gap in the E-mini Russell 2000 (TF) which occurred on Monday, March 23. Note that the Russell closed at 397.40 on Friday the 20th, and opened at a price of 410.20 the following Monday, forming a 12.80 point up gap.
By any standard, this would...
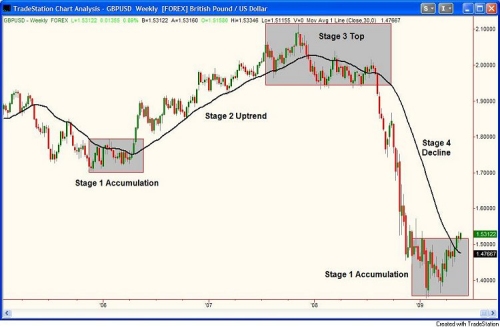
For many of you, your trading and investing career is just beginning, and for others like me, it has been going on for a long time. My career began during the greatest bull market of all time, from 1990 - 2001. That market taught me a very important lesson that I want to share with you. It will help you understand trending markets, range bound markets, and above all, help you to control your emotions.
If you have been watching the stock market at all since late 2007, you have seen a period of high prices followed by a severe sell-off during 2008 and 2009. Hopefully, you did not buy or hold any stocks during this time, but if you did, you should have learned a valuable lesson. This lesson is no different than the first time you touched...
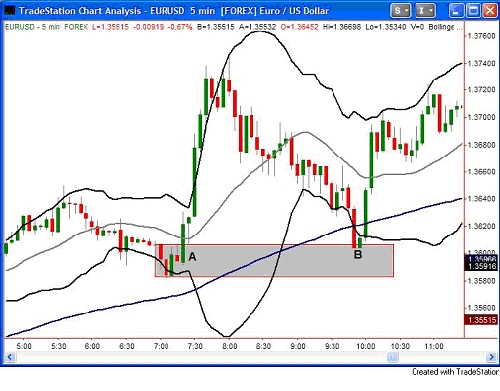
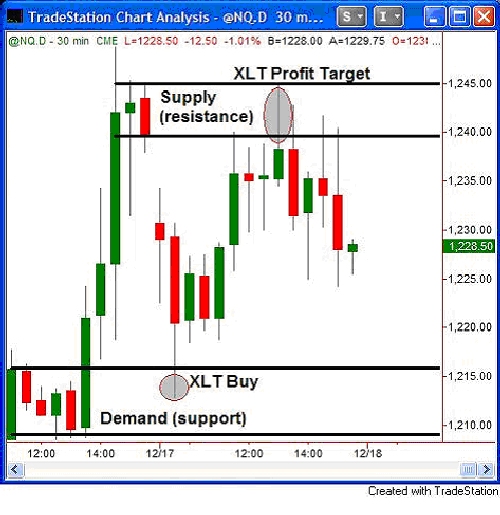
It's the first week of the month in Extended Learning Track (XLT) class. This is always a good week because new traders get exposed to the lessons that will shape their trading strategy for years to come. While they don't know it yet, I know that what they learn in week one is the key ingredient for their success. Using price action alone, we cover exactly how to quantify demand (support) and supply (resistance), the "odds enhancers" that give us our objective probability score on each trading opportunity, and a set of rules for entry and exit during week one. The information we cover is applicable in any time frame which allows us to keep things very simple and rule-based.
I really don't use any indicators or oscillators myself and...
From birth, we are conditioned to trade incorrectly. We naturally run from things we are fearful of and are drawn to things that make us feel good. If you take this action in trading, you are headed for trouble which in the trading world means losses. For example, if your invitation to buy into a market comes only after an uptrend is well underway, all the indicators are pointed up, and the news is good on that market, where do you think price is in that market? Yep, it's likely very high. To buy here completely goes against how you make money buying and selling anything and is very high risk. Never forget, when you buy, many people have to buy after you and at higher prices or there is no chance you will profit in your trade. To obtain...
Markets quite often exhibit tendencies that, for the astute trader, may translate into profits. One such tendency is what I refer to as the "rubber band effect." Markets tend to overshoot, similar to a rubber band that's stretched to its extreme and snapped back to its normal tension; so, too, do the markets. In mathematics, it's known as reversion to the mean. This theory is based on a phenomenon stating that when the price of any market deviates substantially away from its medium price, the odds are enhanced that it will revert or move back towards the average. This pattern is repeated quite often in the markets and is extremely worthwhile in identifying, as it may uncover some very attractive risk/reward opportunities.
The...
In a previous article I mentioned that my analysis involves monitoring price action, in order to gain an insight into the short term sentiment of the market. Determining who is in control at that time - the bulls or the bears. And assessing how they're likely to respond to changes in the market.
I thought today I'd prepare a quick article to give an overview of how I analyze price. Those of you who know me know that I'm a great fan of candlestick charting. However, price analysis is much more than just watching for your favorite candlestick patterns. Too many people just teach the candlestick patterns, which are fine, but in my opinion there's some essential analysis missing that an astute trade needs to consider BEFORE they look at...
Recently, I wrote an article about trading and gambling. Specifically, how trading is the one form of speculation on the planet that allows you to stack the odds in your favor before putting any of your hard earned money at risk. That discussion was fine but now I want to look at how we qualify the difference between some higher probability opportunities and lower ones as knowing the difference is a key to success.
In the Extended Learning Track (XLT) - Futures Trading and Forex Trading programs, a market situation we are often faced with is a gap. We use a simple checklist based on objective information to determine exactly what action to take (or not to take). The checklist helps us determine the probabilities, risk, and reward. Here...
Did you know that there is a whole 'other world' of technical analysis that most novice traders are either totally ignorant of, or fear to go due to the fact that it might actually require some work?
Well, there is! And I'd suggest that if most novices fear to go there, then perhaps it might be worth some investigation.
What is technical analysis? For most novice traders it seems to be one of, or a combination of, the two following approaches:
The art of defining recent price action through classical charting techniques such as the Dow Theory definitions of an uptrend and downtrend, and recognition of patterns such as channels, triangles, head and shoulders, cup and handles, and on and on, or
The art of representing price action...
Despite all the hype from the internet marketers who try to sell you the latest trading 'secrets', the fact is there are NO secrets.
Identify setups which provide the potential for lower risk and/or higher probability trades.
Enter and manage those trades in a consistent and disciplined manner.
Minimize risk.
Manage your money.
Manage your emotions.
Journal your results, and review them to identify what's working and what's not working.
Keep doing what is working, and
Improve what is not working.
If you're not trading successfully, it's because you're not doing one (or perhaps all) of these things.
There are no secrets!
So, it's time to stop searching for this holy-grail solution and get down to some good old-fashioned work...
The new high/new low ratio (NH-NL) ratio has been around for many years but different investors use this indicator in different ways. Some investors plot the ratio on a chart using the number zero as a neutral designation with positive numbers equaling more new highs than new lows and a negative number equaling more new lows than new highs based on a specified period of time. I have developed and used the NH-NL ratio in a completely different way from some of the more popular methods. I started to follow stocks making new highs while reading the paper Investor's Business Daily many years ago. I didn't use the news highs as an indicator but I only studied stocks to buy from the list. As I became a more experienced investor, I...
I love Thursdays in our Professional Trader class. That is the day we discuss Fibonacci numbers and how to use them. It still amazes me when I realize how well these Fibonacci numbers work. You can use them to measure price retracements and projections for new impulses. These levels will give you possible support and resistance levels at which traders can enter trades and/or take profits. The first part of using the Fibs as they are known is to identify the cycle or impulse in the stock, Forex pair, E-Mini or whatever you are trading. The cycle or impulse is the predominant direction and thrust of the security. We commonly call it the trend. In our classes we also teach how to identify the impulsive and corrective environments and what...
Within technical analysis, the examination of volume should always be hand in hand with examination of the trend and other technical patterns. Many traders ignore volume at their peril, and strangely enough there are very few volume based indicators compared to the many hundreds of price based signals available on current trading software. Although volume has great relevance to trading signals, price action is though always the ultimate determinant of buying or selling decisions.
On-balance volume
The most popular indicator until very recently, and the one featured on most software, is called 'On Balance Volume', which is simply a running total of volume. This simple indicator aims to highlight if volume is flowing into or out of a...
We all know emotion can be the devil in your trading career. Often, it is emotion based decisions that keep people from even having a trading career longer than a few months. While emotion often has you buying signals way after a move higher in price which is likely near resistance which almost ensures a losing trade, there is another culprit that leads to the same losing behavior in trading. It is the misuse of indicators and oscillators.
Understand that the movement in price in any and all free markets is a function of the pure laws and principles of supply and demand. Opportunity exists when this simple and straight forward relationship is out of balance, period. What most people don't understand is that when you ignore a governing...
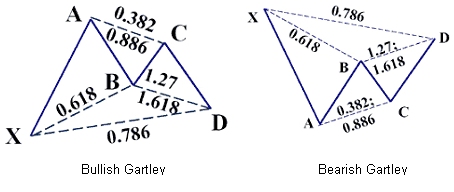
Once in a while a pattern comes along discovered by little known trader that stood the test of time can be a useful tool to trade even in this modern-day markets. It only goes to show the validity of the pattern's profitability factor.
This is a complex pattern that beginners may have a hard time finding them in their charts. Identifying double-top, double-bottom, triangles are easy. Then head-and-shoulders come in many shapes and sizes, these take more time to spot them. But the Gartleys are more complex in a sense that Fibonacci measurements must be taken into account unlike the traditional patterns. This pattern is also known as the Gartley Butterfly because of the movements of the prices and the drawn lines that connect to other...
Recently I sent out to my free newsletter subscribers a lesson I had written a couple years ago dealing with what I call the PAUSE formation. The reason for this was that a market that I had been sharing future cycle turn dates on had formed the early warning sign for a PAUSE formation and may present an opportunity for a trade. At the very least, it should help those looking to learn more about cycle turns, swings, pivots and other associated phenomena to cycles. The more you understand a tool or indicator the better you can exploit it.
The PAUSE formation is very simple to identify. But what I want to discuss first is what to look for in order to determine a POTENTIAL PAUSE formation. Unless you have some advanced warning, who cares...
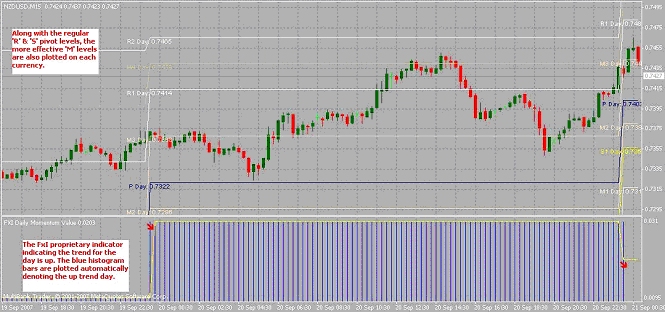
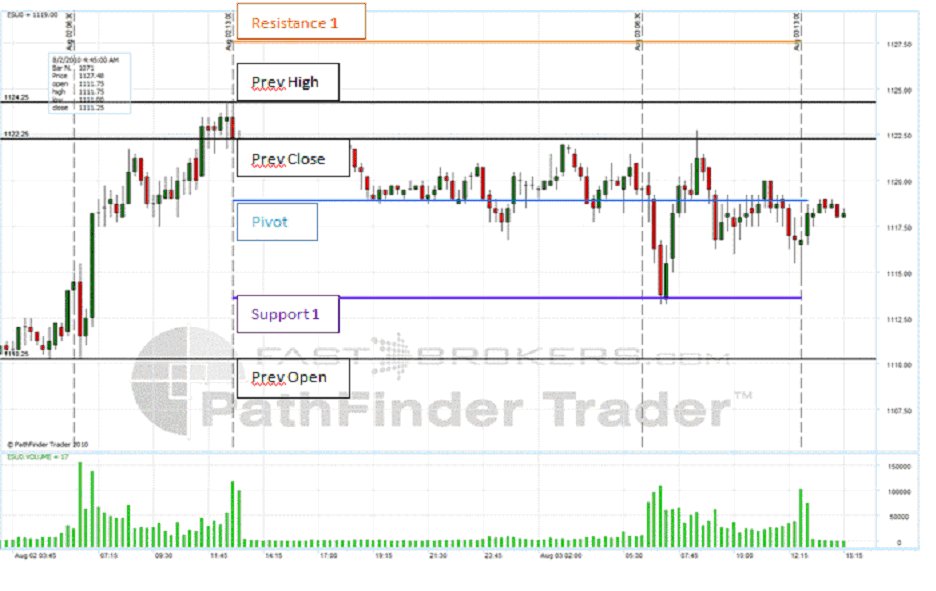
The Pivot point system is a technique developed by floor traders, to help ascertain where the price is relative to previous market action. It can be classified as a technical indicator derived by calculating the numerical average of the high, low and closing prices, of any currency / index / stock etc.
A look at market movement tells us that price always fluctuates between a level of support and a level of resistance. Properly identifying key support and resistance levels can improve the ability to enter, exit, and manage your trades.
The pivot point is a level at which the sentiment of the market changes. It can tell us where the sentiment of traders and investors changes, from bull to bear or vice versa.
The main advantage of this...
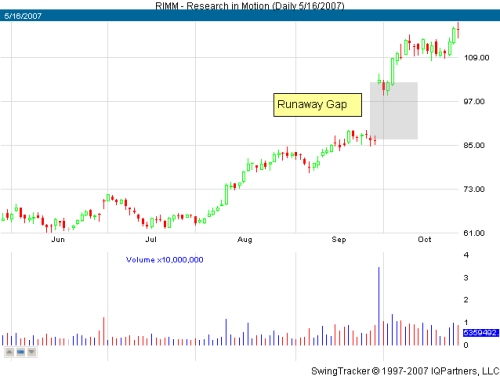
Gaps are a common occurrence in the markets. Everyday there is always at least one stock that has gapped up or down when the market opens. Why? As long there is some event happening somewhere between the market close of the previous day to the opening of today, there will be gaps. Even if the markets eventually move little by little toward the inevitable 24-hour format, there will always be gaps. After all, somewhere around the world, there is some event happening during the weekends as well. Plus, there is always an excited group of investors who making a big deal out of something or even for no reason unknown to the rest of us. So, gaps are a fact of life and there is no avoiding them. The best thing to do is take it in your stride...
If there is one thing that a trader would want to know for certain, it would be to catch the bottom or top of a trend.
But simple as it sounds, it is easier said than done.
Knowing that a certain price wave is completed, or is just a retracement in the larger trend, becomes more of an art than a science.
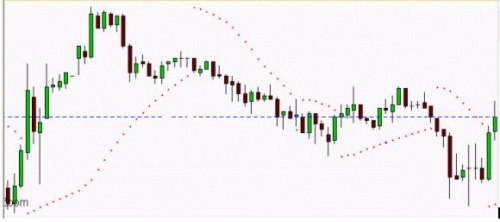
In such situations, using multiple sources of confirmation helps to avoid the potential false signals, and preserve our capital for only those situations that provide us with the most favorable risk to reward scenarios. Keeping that in mind, we will use two very different indicators - the ADX (Average Directional Movement Index) and the PSAR (Parabolic Stop & Reverse) - to form a system which should help us to trade as close to the...
After last Wednesday's brief pullback, the market resumed its upward trajectory, this in defiance of those skeptics who continue to espouse their bearish views. I'm sure at some point the market will experience a considerable correction or even go into a full- blown Bear market (we haven't had one of those in over 4 years). For now at least, every piece of news is being spun positive. The inflation data, the housing data, good news is good news and bad news is good news. The glass is half full. This is emblematic of a market in a bull phase.
As traders, my view is that we should take our directive only from the market itself; not the media nor the pundits nor anyone else for that matter. I believe a trader's job is to get good at...
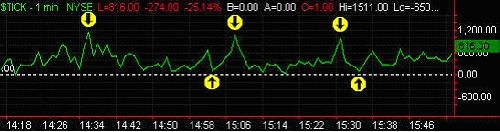
What is a TICK?
A TICK is the number of NYSE upticking stocks vs downticking stocks. If 1000 stocks are upticking and 600 stocks are downticking you will get a TICK reading of + 400.
The TICK is a useful market internal tool to gauge market sentiment, design trading strategies, to prevent one from chasing, etc...
Traders use the TICK in various ways: some choose to fade TICK extremes, others use it to confirm market direction, and others incorporate the TICK into their trading setups.
In this article, I want to go over some of the TICK strategies and methods I personally use in my trading.
TICK HOOK
Let's begin with a TICK hook. The difference between a candlestick TICK chart and a line on close TICK chart is the visual TICK hook. A...