You are using an out of date browser. It may not display this or other websites correctly.
You should upgrade or use an alternative browser.
You should upgrade or use an alternative browser.
Articles
Fundamental and Technical Analysis
Pairs traders employ either fundamental or technical analysis, or a combination of the two, to make decisions regarding which instruments to pair, and when to get in and out of trades. Many pairs traders apply technical analysis techniques and then confirm the findings using fundamentals. This extra “layer” of analysis can be used simply to ensure that the trade “makes sense”. For instance, if all technical analysis points to taking a long position in stock ABC and a short in XYZ, but the fundamentals show that stock ABC will have a weak earnings report, the position may need to be reconsidered.
Fundamental factors
Fundamental analysis examines related economic, financial and other qualitative and...
Introduction
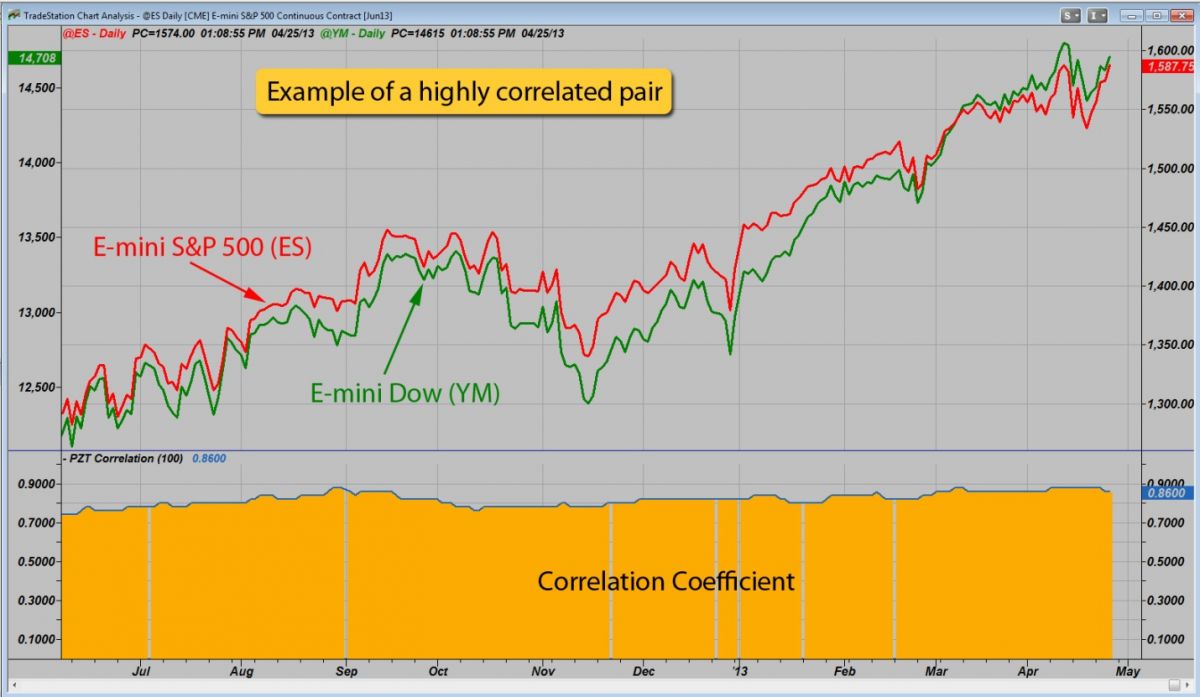
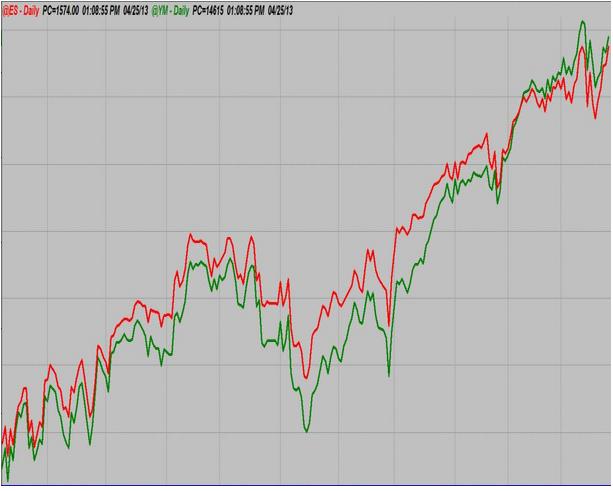
Pairs trading is a market-neutral trading strategy that matches a long position with a short position in a pair of highly correlated instruments such as two stocks, exchange-traded funds (ETFs), currencies, commodities or options. Pairs traders wait for weakness in the correlation, and then go long on the under-performer while simultaneously going short on the over-performer, closing the positions as the relationship returns to its statistical norm. The strategy’s profit is derived from the difference in price change between the two instruments, rather than from the direction in which each moves. Therefore, a profit can be realized if the long position goes up more than the short, or the short position goes down more than...
If you have been involved in the markets for more than a short while, you have probably heard the expression “The Trend is Your Friend.” In fact, it is so common that it almost seems trite. Maybe it is, but that doesn’t mean it’s not true. Simply put, over the years many traders have concluded that it is generally a higher probability strategy to trade with the current flow of money, rather than paddle upstream.
Let’s say, then, that you too decide to swim with the current. Is there a strategy that lets you dive in but decreases the chance of immediately drowning? The answer is a resounding “yes!” Welcome to “The Pullback”
As the name suggests, a pullback is a short term move in the opposite direction of the longer term trend. It can...
Trend does not exist in the now and the phrase, "the trend" has no inherent meaning. -Ed Seykota
Among the various foundational concepts in technical analysis, trend occupies a unique space in its peculiarity. This article aims to explore the peculiar aspects of “trend” – a concept which may seem simple and familiar, yet is highly paradoxical when viewed from a critical perspective.
From a technical standpoint, the concept of trend is fairly straightforward and easy to grasp. Identifying a trend on a chart, or distinguishing trending from non-trending movement, is a fairly intuitive exercise. With regard to form, trends seem to possess a distinct clarity and singularity. With regard to progression, trends seem to exhibit a sense of...
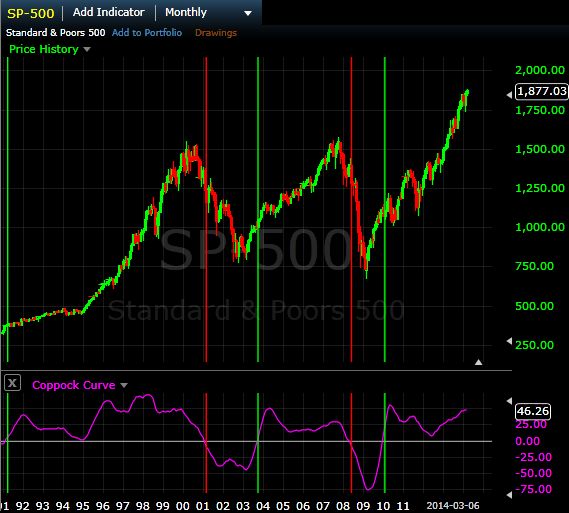
The Coppock Curve (CC) was introduced by economist Edwin Coppock in Barron's, October 1962. While useful, the indicator isn't a commonly discussed amongst traders and investors. Traditionally used to spot long-term trend changes in major stock indexes, traders can use the indicator on any time and in any market to isolate potential trend shifts and generate trade signals.
Coppock Curve
Coppock initially developed the indicator for long-term monthly charts; this will appeal to long-term investors as signals are quite infrequent on this time frame. Drop down to a weekly, daily or hourly time and the signals become progressively more abundant.
The indicator is derived by taking a weighted moving average of the rate-of-change (ROC) of a...
Noise removal is one of the most important aspects of active trading. By employing noise-removal techniques, traders can avoid false signals and get a clearer picture of an overall trend. Here we take a look at different techniques for removing market noise and show you how they can be implemented to help you profit.
What Is Market Noise?
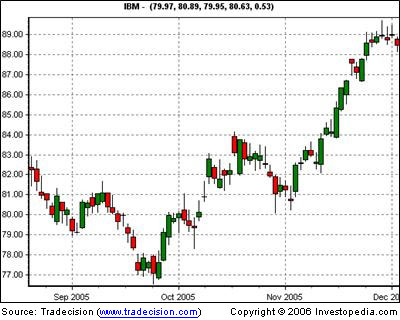
Market noise is simply all of the price data that distorts the picture of the underlying trend. This includes mostly small corrections and intraday volatility. To fully understand this concept, let's take a look at two charts - one with noise and one with noise removed:
Before noise is removed:
Fig1
After noise is removed:
Fig2
Notice that in Figure 2, there are no longer any areas in which...
Long before we had computers to chart price, traders were making a living and doing it by watching price movement. One of the earliest types of charts was called point and figure charting (P&F). It started from traders who would tick off prices as they watched the trading. Eventually the ticks changed to X’s and O’s to note movement in price and even see trends.
Today, many chartists have switched to candlestick charting to make their decisions to buy or sell. A drawback to this style of charting is that many people are prone to exiting early from profitable trades when they see small pullbacks or corrections. An advantage of point and figure charting is that it allows the trader to see the trend and stay in the trend even through...
In my first article last week, I discussed the basics of creating the point and figure style of chart. In this article, I will build upon that knowledge and show more advanced methods for identifying patterns and projecting price movement. I want to mention that I tend to use this method of charting for longer term swing or position trades rather than intraday. Remember that time is not a factor when attempting to achieve targets in P&F and you will likely hold positions for some time. Patterns in P&F charts are a bit different than what you may be used to in candlestick charting. A triple top formation is not necessarily a reversal formation, it could be continuation. It will still offer a trading opportunity however. Look at the...
In my early days, I was always fascinated by the gap in the financial system between those who know what they are doing and profit, and those who don’t and lose money. It was really fascinating, big strong institutions made so much money and were correct most of the time. At the same time, retail traders and investors were equally wrong most of the time and lost tons of money. If I could just figure out how and why an institution made the trading decisions they did, maybe one day I could reap the same rewards was my thinking. I also spent time figuring out why retail traders performed so poorly, that was actually very easy to do. Without going into too much detail, I also realized that most retail traders and investors learned to...
Traders attempt to isolate and extract profit from trends. There are multiple ways to do this. No single indicator will punch your ticket to market riches, as trading involves other factors such as risk management and trading psychology as well. But certain indicators have stood the test of time and remain popular amongst trend traders. Here we provide general guidelines and prospective strategies are provided for each; use these or tweak them to create your own personal strategy.
Moving Averages
Moving averages "smooth" price data by creating a single flowing line. The line represents the average price over a period of time. Which moving average the trader decides to use is determined by the time frame on which he/she trades. For...
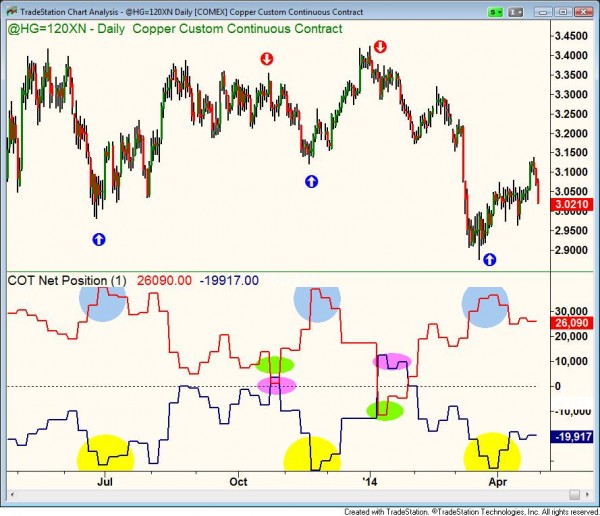
Futures’ trading has been around for hundreds of years. Even before Futures Exchanges existed trading was done by either a handshake or a forward contract. Producers and Processors of Commodities both have always needed a way to protect against price risk. The Producer, who owned the Commodity was concerned prices might drop before they delivered their product. Processors always worry that price might rise before they purchase the Commodity to process and later sell. Price risk is always a concern to these entities in the Futures markets.
These entities are comprised of Commercial traders who use a physical Commodity in their day to day business. Commercial traders do approximately 60% of the daily volume in the Futures markets...
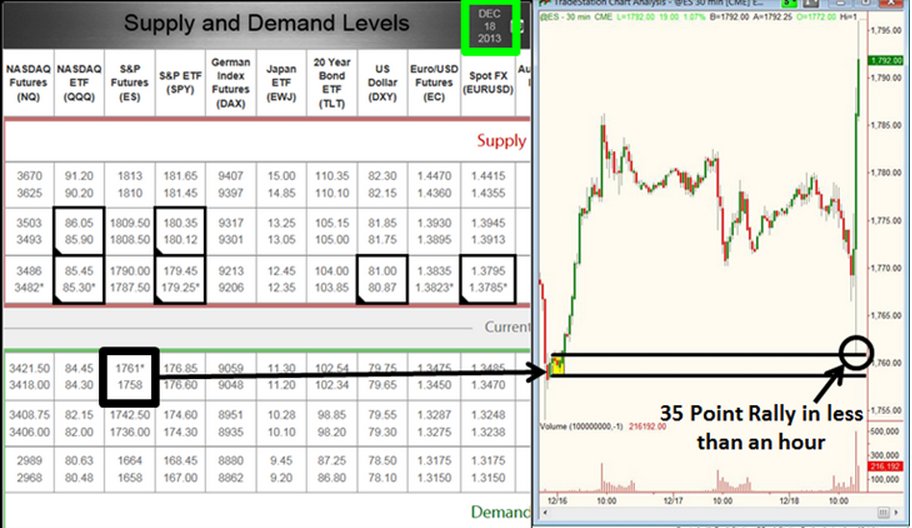
During our development years, we are taught/conditioned to think certain ways. Our years in grammar school, high school, and university are key belief system building years. One of the major conflicts during these years occurs when we are taught how to buy stocks and then how we are taught to buy and sell anything else in our life.
The basic principle of buying low and selling high or selling high and buying low is how we derive profit when buying and selling anything. When we buy cars or houses, we never offer what the seller is asking. We always offer a lower price and typically end up somewhere in the middle. Smart shoppers look for deals where they can buy what they are looking for at a lower price than others pay. We all typically...
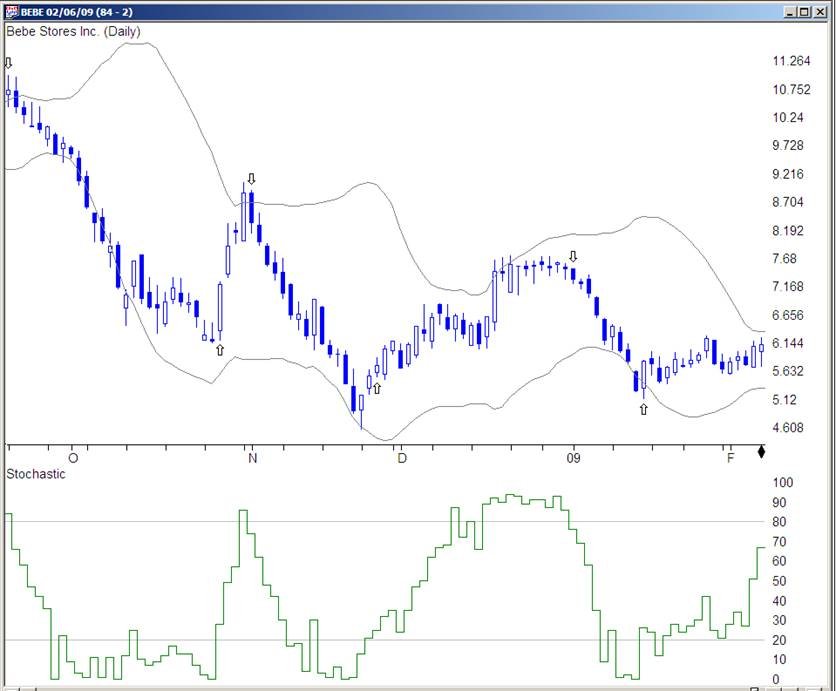
Many traders use indicators to determine when to enter and exit trades. Most charting software includes dozens of different indicators that can be displayed on the charts. Popular indicators such as the Stochastic, and MACD, are frequently discussed when traders get together. I have listened to a number of these discussions; the interesting thing is that people typically explain why they use a particular indicator by citing a number of examples of when it has worked for them. When they do, another trader will typically say something like, ‘well it did not work for me, so I use the XYZ indicator which is much more reliable’. When I ask the second trader why his XYZ indicator is more reliable, the explanation usually involves a few more...
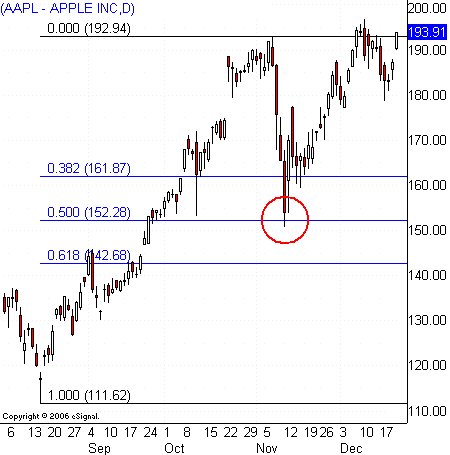
Fibonacci analysis leaped into the technical mainstream late in the 1990s. Futures traders had been quietly using this charting tool for several decades when Net-based, real-time software ported it to the equity markets. Its popularity exploded as at-home traders experimented with the arcane math and discovered its many virtues.
Leonardo of Pisa (c. 1170-1250), also known as Fibonacci, studied math among the Arabs and introduced algebra to Europe, as well as a numerical sequence that appears throughout nature. The core logic of his discovery is simple: beginning with 1+1, the sum of the last two numbers that precede it creates the next value in a Fibonacci progression.
So with this math in hand, the starting Fibonacci sequence looks...
Remember the article called Our Jack - the trader who should be a loser, but wasn’t and who should have been more profitable, but didn’t care a jot? Well, I bumped into Jack the other day which was a happy coincidence because I’d been reading a fierce argument on Trade2Win about whether Technical Analysis (TA) ‘worked’ or not. I knew Jack used TA, so I was anxious to hear his views.
"Works", laughed Jack, “It’s just a tool, you know, which just as much ‘works’ as Alexandros’s hammer and chisel did in sculpting the Venus de Milo. No, dear boy, it’s you and me that ‘works’ not the tool.”
I thought that sounded somewhat fanciful so I asked Jack how he used TA as a tool. “I use it to make assumptions about what price might do,” he said...
Introduction
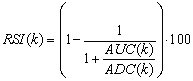
In his 1978 book “New Concepts in Technical Trading Systems” J. Welles Wilder Jr. presented several methods and trading techniques which became classic. In that book Mr., Wilder introduced one of the most widely used technical oscillators today: The Relative Strength Index (RSI for short). Nowadays all kinds of technical analysis software offer the RSI as a build-in oscillator.
This is an enhanced and extended version of my article "Dissecting the RSI" which first appeared in the Technical Analyst publication and later in the Hispatrading magazine.
The actual rsi formula
According to Welles Wilder, the RSI of k periods is defined as:
where AUC(k) is the (2k-1) exponential moving average of UC and ADC(k) is the...
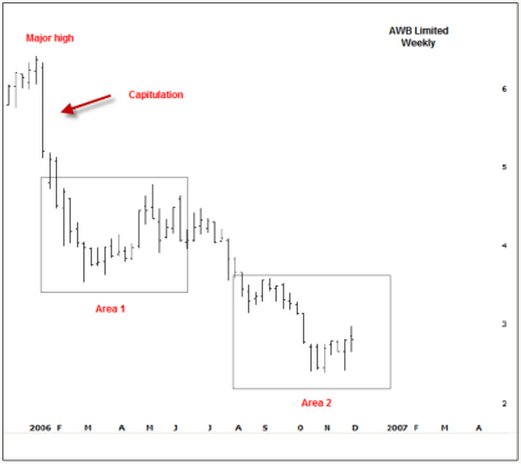
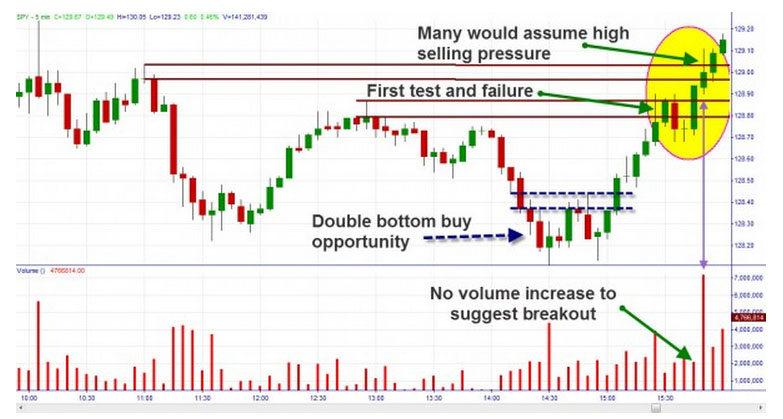
In part 1, I discussed two examples of how and why volume can show the changing face of supply and demand. When the order of supply and demand is change we will get a change in market direction, sometimes a significant change in trend or otherwise some degree of retracement of the prior move. We will now continue on from that discussion and show larger periods of transition which can lead to quite substantial turning points in the major trends. These can be easy to identify, but do require some patience. If you did not read the prior article it would now be worth reviewing that before going on.
Let’s firstly take a look at AWB Limited.
Since early 2006, the price of AWB had been in a downward spiral. The story that eventually came...
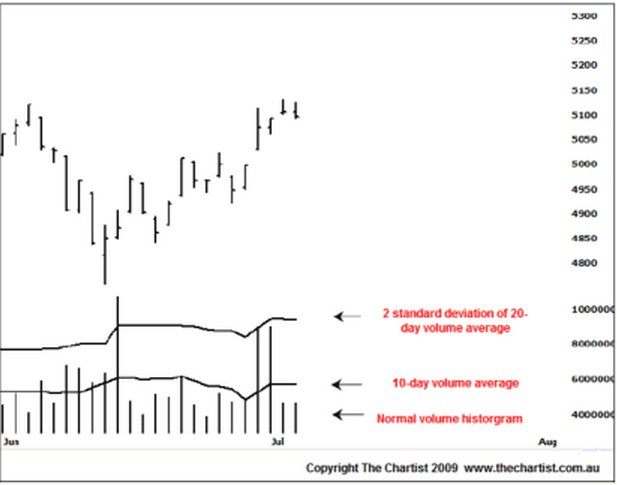
The power of correct volume analysis cannot be overlooked. Unfortunately the ability to read volume correctly is not readily discussed or freely available. Off-the-cuff remarks such as, “increased volume on advances is bullish and increased volume on declines is bearish” are bantered around but that’s as far as it goes. The correct use and application of volume can make for some quite startling insights into price action, especially when one is swing trading or leaning against support and resistance points or zones of confluence.
I set up my charts with a couple of extra volume measures. I use a normal volume histogram that can be found with almost all software packages. However, if there is a larger volume spike skewing the ability to...
What is price action?
Price action is the behavior of the price of a specific currency, commodity, stock, or other security over a specific period of time. All financial markets display the price movement of a security over varying periods of time on price charts. The price action on a price chart reflects the aggregate belief of all market participants about the value of a security’s price during the specified period of time reflected by the price chart.
Price action analysis allows you to see exactly what is happening in any given market at any given time because price action is the visual trail of the supply and demand situation of the given trading instrument over a specified period of time. A chart’s natural price action...
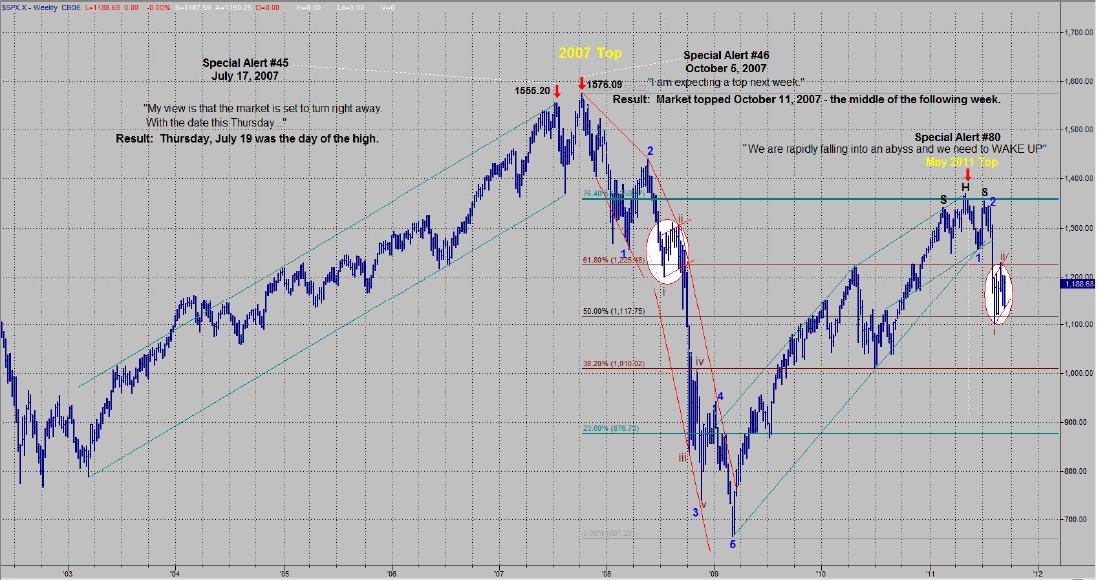
Let's begin by looking at the chart in figure 1. At this stage of the cycle, my main purpose in writing is to "alert" you to potential danger in the market. I attempt to do this by explaining the Long Wave cycle, sharing its history and accuracy, and then pointing out where we are in the cycle ... and the implications of being there. As a refresher, we are in the very late stages of a roughly 75 to 80 year cycle. In my observation, I refer to these cycles as "life cycles" because they last expectancy at the late stages of the cycle Kondratieff wrote about cycles, they lasted about 50 years which was the average 'life cycle' or life expectancy of that era. Currently, the average life expectancy is about 78 years. Is it a coincidence...
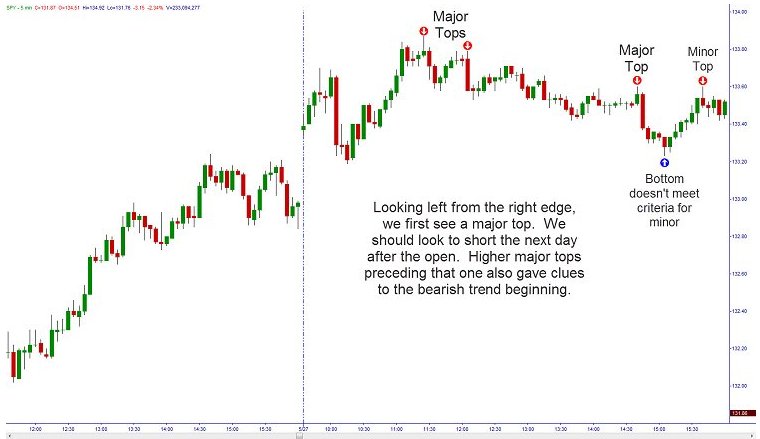
There is a saying in trading, "Look left to make the right decisions." We will do the same. To determine the major trend of our stock, we can start at the current price and look left until we find a major top or major bottom. If we come to a major bottom, then we are likely in an uptrend and should trade in that direction until the major bottom has been violated. Should a major top come first, then we would be looking for shorting opportunities until that top has been violated by higher prices.
Figure 1
Once we have found the major trend, we can enter into that trend once an intermediate or minor trend is signaled. In the above chart, we saw that from the right edge of the chart, we first found a minor top. Since this doesn't give...
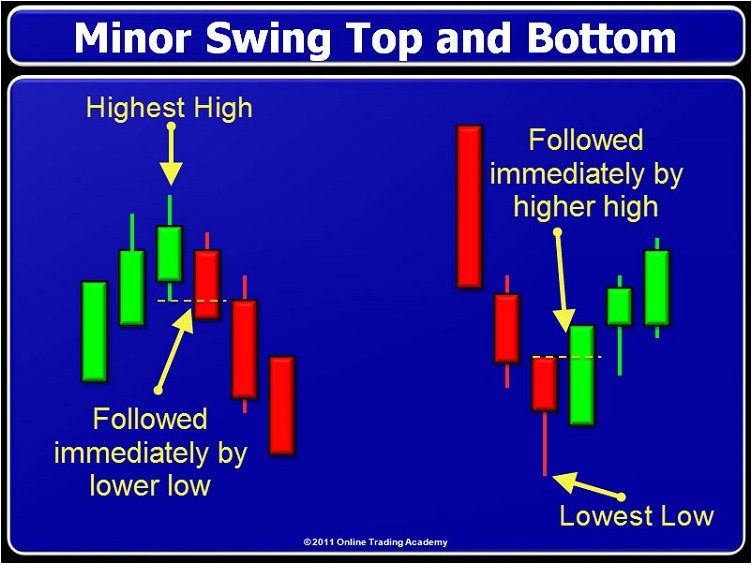
In previous articles I have discussed swing highs and swing lows and also touched upon a different type of analysis called Gann Theory. This is a popular style of analysis that looks at patterns and repeatable price action based on time. After receiving some emails on the subject, I decided it best to examine Gann Theory a bit further in my articles. I am not going to go into the history of Gann Theory or give a biography of W.D. Gann. Instead, I will discuss some practical applications of some of his theory.
There are three trends applicable to any time frame which you are analyzing: Minor, Intermediate and Major. That also means that there are three types of swing highs and lows that correspond with these trends. Let's examine the...
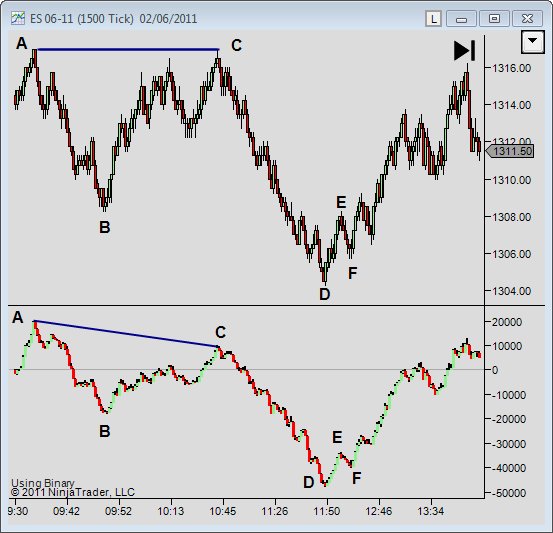
Whilst I generally shudder when I recall my first naïve steps in the world of trading and the hoard of indicators I had on my charts, there is one indicator I feel stands apart from the rest. It’s not based on price and so represents an additional dimension on which to make decisions. I also think it is a very close relative of tape reading. In this article, we will look at some of the basics of using Cumulative Delta.
The Delta Theory Simplified
For a trade to occur in the markets, we need two things - a buyer and a seller. Price does not move down because there are more buyers than sellers. This is impossible, for every buyer there must be a seller. Price moves down when sellers are aggressive and buyers believe that sellers are...
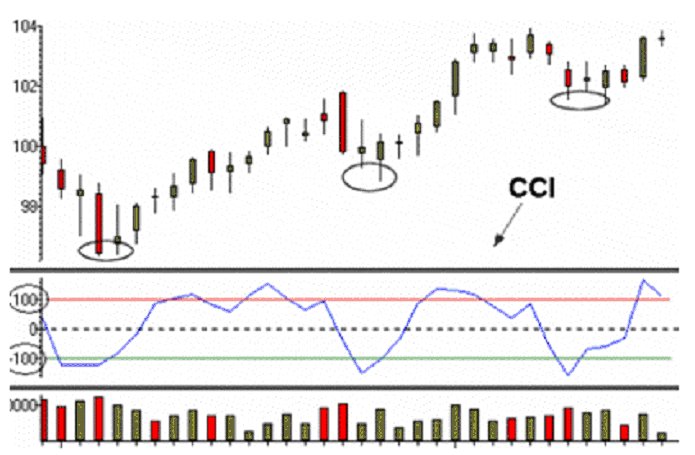
Most traders are glued to indicators and oscillators and that's ok if you use them correctly. The issue is that many traders take each conventional buy and sell signal an indicator or oscillator produces and that can lead to trouble. For those new to trading, the following information should provide a good foundation of an understanding of how to properly use oscillators, if you're going to use them at all.
To illustrate my points, I will use the Commodity Channel Index (CCI). This is certainly not because CCI is my favorite oscillator; I don't use any indicators or oscillators in my trading at all. The goal in trading is to achieve the lowest risk, highest profit margin, and highest probability entry point into a trade. The only way...
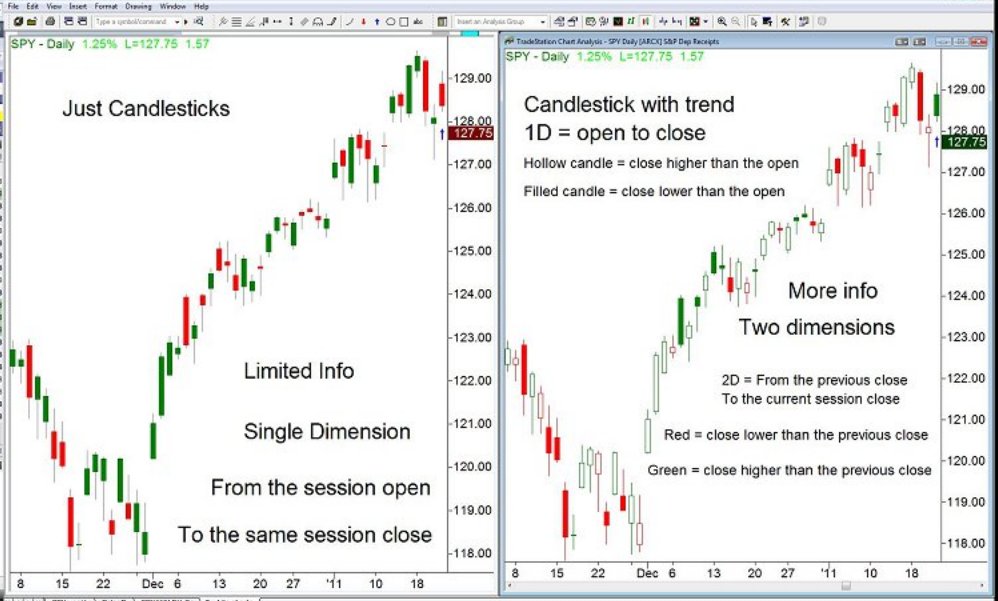
One of the most common areas of confusion for the new trader is chart reading. For example, I had a trader who had been trading for years, but he did not know the difference between the two types of candlestick charts. As we were going through the technical analysis material, it was clear that he understood the basic candlestick concept, but nothing more.
The basic candlestick concept is in all of Steve Nison's books and similar books on conventional technical analysis. Yet the info presented there is somewhat single dimensional because it focuses only on a single trading session. For instance, every candle has four points which are well-known. They are the (H) high, (L) low, (O) open and (C) close. The range is the distance between...
In my nearly 20 years in this industry, and almost five years of teaching, I have come to the not-so-startling conclusion that there are two types of traders in the world - those that make money and those that don't. I call these two groups the 90 percenters (the money losers) and the 10 percenters (the money makers). While these statistics on trading success are open to debate, they make it easier to demonstrate some common mistakes that unsuccessful traders habitually do.
A very common mistake that the 90 percenters do is change their reason for being in the trade. In every class I teach, this question/example is always asked, and without doubt, most of the students laugh and admit to making this very basic mistake.
When determining...
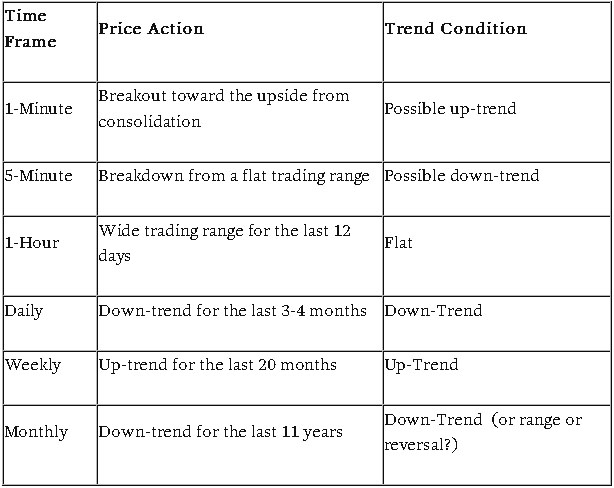
Many of us are already using support/resistance levels to locate possible turning points in the markets. We can identify these by looking at multiple time frame charts. Depending on your style of trading (investor, swing trader, day trader, etc), you could use two larger time frame charts to identify trends and support/resistance levels. For a day trader this could be perhaps a daily and a 30-minute chart. Once we have an idea of potential turning points from the bigger picture charts, we can step down to a smaller chart. This could be a 5-minute chart that we will use to manage our trade once we enter the position. Our next chart will be our action chart. This one will be the smallest time frame in our charts we look at. Perhaps a 1 or...
There are a lots of words thrown around in trading terminology but no one really understand truly what they mean when it comes down to trading and reading the text to truly understand what the author wants to say. This word "setup" in particular is an all-encompassing word. So some clarification is needed.
The setup means different things to different authors. In general, a setup is an area (price or indicator) where he would take action; this can be opening a position or closing one. The setup has to meet a number of criteria either from price, volume or any number of indicators being used. Setups can come at different times of the day or weeks. For a scalper, one setup may appear one after another, providing him many opportunities...
Like any other day traders, we are always looking for correlation in other markets or indicators to give us an edge. It's not easy when there are lots of data and techniques out there to choose from. Those that are out there simply work in one market but not in others while more work at one type of market condition and not in others and so on.
Scalping and day trading in particular has a peculiar type of behavior where everyone wants to know what the market will do in the next minute or so in order to catch a small tiny profit -- little by little to accumulate with highly leveraged trades. That said, every weapon helps to avoid losses and to add to the higher probability of success. Percentage is everything in this type of trading, the...