You are using an out of date browser. It may not display this or other websites correctly.
You should upgrade or use an alternative browser.
You should upgrade or use an alternative browser.
Articles
In 1983, legendary commodity traders Richard Dennis and William Eckhardt held the turtle trading experiment to prove that anyone could be taught to trade. Using his own money and trading novices, how did the experiment fare?
The Turtle Experiment
By the early 1980s, Dennis was widely recognized in the trading world as an overwhelming success. He had turned an initial stake of less than $5,000 into more than $100 million. He and his partner, Eckhardt, had frequent discussions about their success. Dennis believed anyone could be taught to trade the futures markets, while Eckhardt countered that Dennis had a special gift that allowed him to profit from trading.
The experiment was set up by Dennis to finally settle this debate. Dennis...
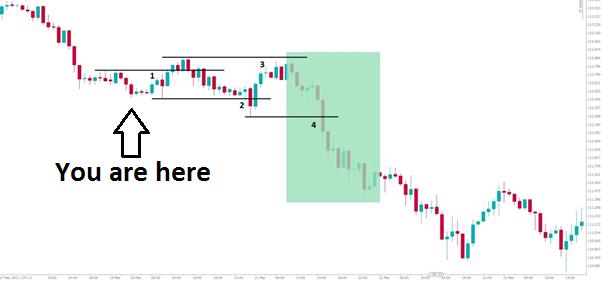
Trading breakouts or pullbacks, which is better? This is a hotly contested debate, even among professional traders – but it shouldn’t be!
As a quick reminder:
- Buying a breakout is buying when the price is moving up and above an area of resistance.
- Buying a pullback is buying when the price is moving down towards support, typically sometime after a breakout higher
- Vice versa for selling.
There are advantages and disadvantages to both of these approaches. As traders we need to fully UNDERSTAND and ACCEPT the range of possible outcomes from our strategy. Only then can we feel comfortable executing it again and again over time.
Let’s look at an example.
Chart 1: USDJPY 1hr candlestick chart
In Chart 1, a trader is analysing...
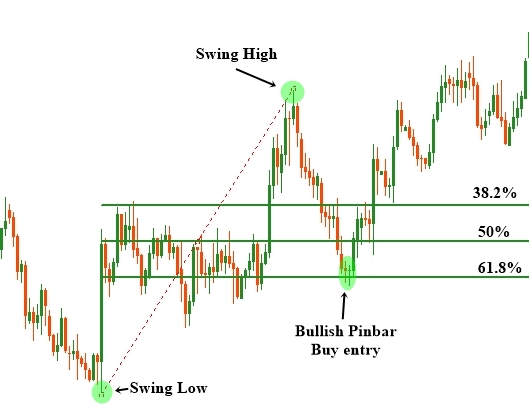
Trading financial instruments as a full-time professional trader requires a vast knowledge of the financial industry. Those who are trading the financial markets over a long period of time with consistent profit have probably gone through many difficult stages in their trading career. There are many different types of trading strategy available and professional traders have developed their preferred strategy based on their own personal traits. In this article, we will discuss an excellent trading strategy for use in the forex market. The Fibonacci trading strategy has been used in forex for a long period of time and many experts consider the Fibonacci retracement tools as their favorite. In the eyes of many professionals, the financial...
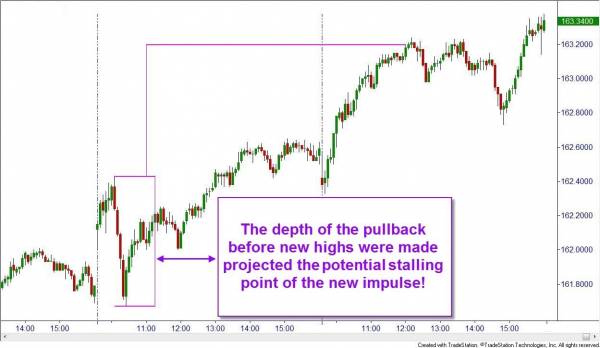
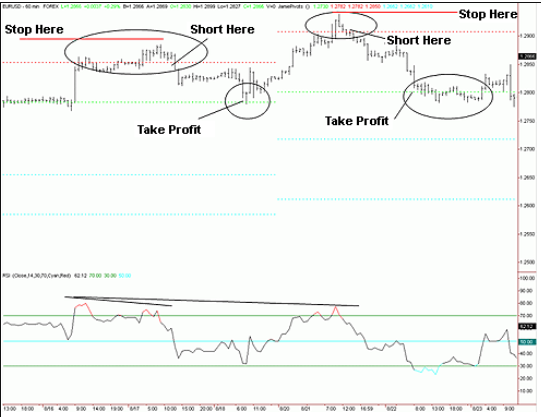
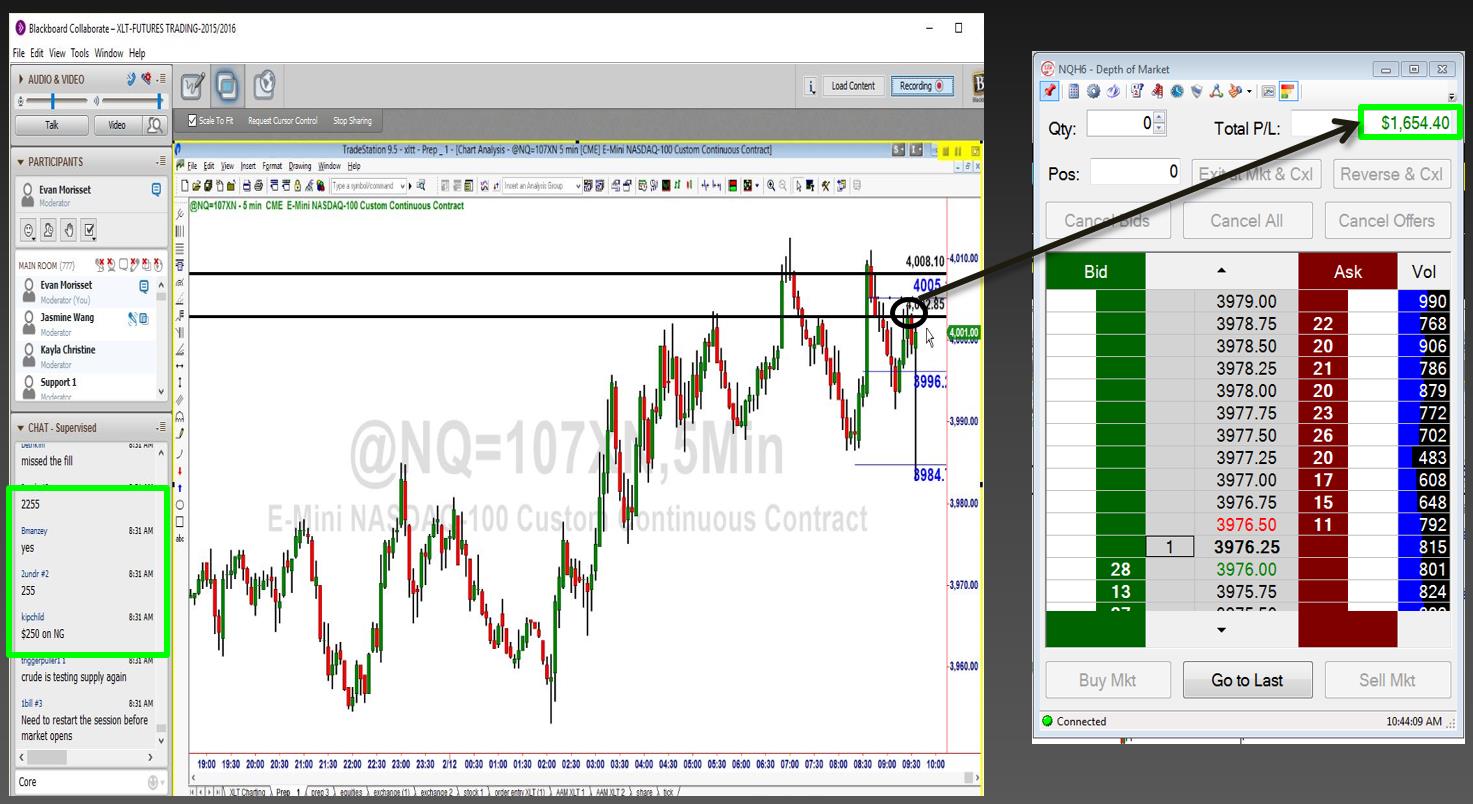
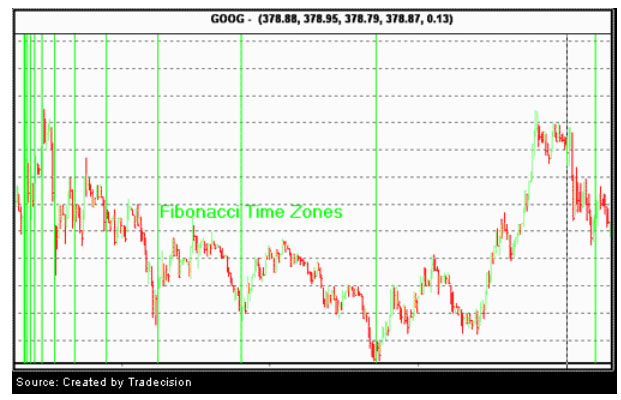
If you have been following the NASDAQ index, you know that prices have been making all-time market highs lately, even though the other indexes have been stuck in a range. There are a lot of stocks that are also at an all-time market high. As traders, we know that we should participate in the dominant trend but base our exits on supply and demand zones. The biggest question when a market high has been hit becomes: where are we supposed to exit when we do not have a supply zone to mark the top?
There are a couple of technical tools that we can use to identify probable targets for our trades, both intraday and on swing trades. It is important to note that none of these are as strong as actual supply zones but they do seem to offer higher...
In all forms of long-term investing and short-term trading, deciding the appropriate time to exit a position is just as important as determining the best time to enter into your position. Buying (or selling, in the case of a short position) is a relatively less emotional action than selling (or buying, in the case of a short position). When it comes time to exit the position your profits are staring you directly in the face, but perhaps you are tempted to ride the tide a little longer, or in the unthinkable case of paper losses, your heart tells you to hold tight, to wait until your losses reverse
But such emotional responses are hardly the best means by which to make your selling (or buying) decisions. They are unscientific and...
Trading requires reference points (support and resistance), which are used to determine when to enter the market, place stops and take profits. However, many beginning traders divert too much attention to technical indicators such as moving average convergence divergence (MACD) and relative strength index (RSI) (to name a few) and fail to identify a point that defines risk. Unknown risk can lead to margin calls, but calculated risk significantly improves the odds of success over the long haul.
One tool that actually provides potential support and resistance and helps minimize risk is the pivot point and its derivatives. In this article, we'll argue why a combination of pivot points and traditional technical tools is far more powerful...
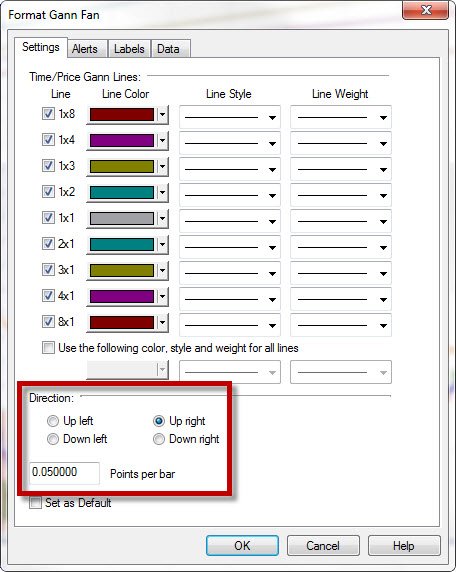
Predicting the future is impossible, right? If he were around today, W.D. Gann would beg to differ. His first prophecy is believed to have happened during World War I when he predicted the Nov. 9, 1918, abdication of the Kaiser and the end of the war. Then in 1927, he wrote a book entitled "Tunnel Through The Air," which many believe predicted the Japanese attack on Pearl Harbor, and the air war between the two countries.
His financial predictions were perhaps even more profound. In early 1929, he predicted that the markets would probably continue to rally on speculation and hit new highs… until early April. In his publication, The Supply and Demand Letter, he delivered daily financial forecasts focusing on both the stock and commodity...
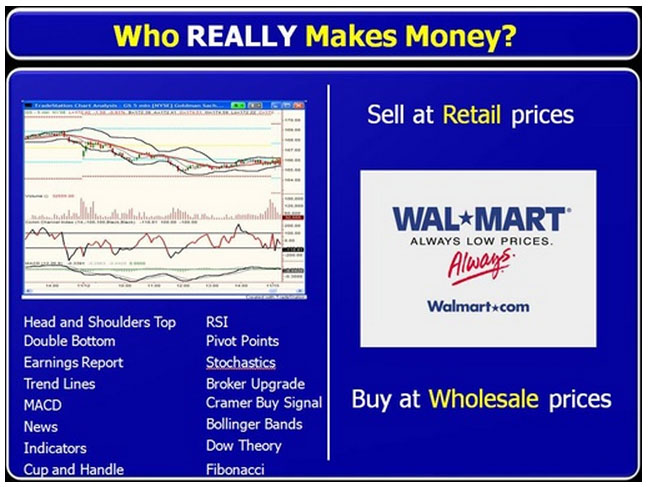
How many times have you heard someone say, “Trading is an art, not a science.”? I have heard that for years and years and I have to say, it is probably the most ridiculous statement I have heard when it comes to trading and, as we all know, there are some pretty ridiculous statements in the trading world. There is absolutely nothing artistic about trading at all. This is, 100%, a numbers game… How much willing demand and supply there is at each price level is what determines price turns and movement. It’s the buy orders vs. the sell orders and, again, it all comes down to the numbers on both sides of that equation and nothing else. To think Picasso or Van Gough should be brought into this discussion is rather amusing if you think about...
We often hear market analysts or experienced traders talking about an equity price nearing a certain support or resistance level, each of which is important because it represents a point at which a major price movement is expected to occur. But how do these analysts and professional traders come up with these so-called levels? One of the most common methods is using pivot points, and here we take a look at how to calculate and interpret these technical tools.
How to Calculate Pivot Points
There are several different methods for calculating pivot points, the most common of which is the five-point system. This system uses the previous day's high, low and close, along with two support levels and two resistance levels (totalling five price...
Moving averages (MA) are a popular trading tool. Unfortunately, they are prone to giving false signals in choppy markets. By applying an envelope to the moving average, some of these whipsaw trades can be avoided, and traders can increase their profits.
What Is an Envelope?
Moving averages are among the easiest-to-use tools available to market technicians. A simple moving average is calculated by adding the closing prices of a stock over a specified number of time periods, usually days or weeks. As an example, a 10-day simple moving average is calculated by adding the closing prices over the last 10 days and dividing the total by 10. The process is repeated the next day, using only the most recent 10 days of data. The daily values are...
Traders have an expression for attempting to pick a market top or bottom - they call it trying to catch a falling knife. As the expression implies, it can be downright dangerous and is not normally recommended. But here is a method that may help lower the risk.
Sushi Roll Anyone?
In his book, "The Logical Trader," author Mark Fisher discusses techniques for identifying potential market tops and bottoms. While they serve the same purpose as the head and shoulders or double top/bottom or triple top/bottom chart patterns discussed in Bulkowski's seminal work "Encyclopedia of Chart Patterns," Fisher's techniques give signals sooner, providing an early warning alert to possible changes in the direction of the current trend.
One technique...
Surfing is very popular where I live in Southern California. It is a sport that I took up while living on the beach. Analyzing and trading in the markets is very similar to that sport. In fact, many technical analysts have compared the market fluctuations to the waves of the ocean. Just like a surfer, it is easier to travel in the direction of the waves than to paddle against it.
The waves of the market are the trends. It is crucial for a trader to identify the trend that they can surf to profits. If you keep trying to paddle against the waves, you can make some progress but it is much easier to ride the waves to larger profits.
There are several ways to identify the trend you are trading or investing in. W.D. Gann was a trader in...
Let's take a trip off the beaten path. We'll administer some necessary medicine to a revered technical indicator - the moving average convergence divergence (MACD). Enough articles have been written about the MACD to depopulate half the world's rain forests, but little has been said about the downsides of using this very popular tool. In short, the MACD doesn't work as well as some say it does. It's a glorified moving average, and it's weak at forecasting price direction. In this article we'll cover the controversial perspective of those who spurn the use of this prevalent indicator and what can be used in its place
The MACD's Seduction
When applied over a long time frame, the signals generated by a given moving average will often seem...
Research analysts use multivariate models to forecast investment outcomes to understand the possibilities surrounding their investment exposures and to better mitigate risks. Monte Carlo analysis is one specific multivariate modeling technique that allows researchers to run multiple trials and define all potential outcomes of an event or investment. Running a Monte Carlo model creates a probability distribution or risk assessment for a given investment or event under review. By comparing results against risk tolerances, managers can decide whether to proceed with certain investments or projects.
Multivariate Models
Multivariate models can be thought of as complex, "What if?" scenarios. By changing the value of multiple variables, the...
Trading is a game of probability. This means that every trader will be wrong sometimes. When a trade does go wrong, there are only two options: to accept the loss and liquidate your position, or go down with the ship.
This is why using stop orders is so important. Many traders take profits quickly but also hold on to losing trades - it's simply human nature. We take profits because it feels good and we try to hide from the discomfort of defeat. A properly placed stop order takes care of this problem by acting as insurance against losing too much. In order to work properly, a stop must answer one question: At what price is your opinion wrong? In this article, we'll explore several approaches to determining stop placement that will help...
Identifying when a change in trend is occurring is one of the most important skills a trader can learn. There are several methods that can be used to identify a possible change in trend; however, one of the easiest to spot is the emergence of a new pivot point. While identifying a pivot must always be done in hindsight, one can examine clues on a chart to determine whether the probability of forming a new pivot is high. One technique is to watch for a partial retrace after a trading range has been established.
When a stock refuses to honor an established range, it usually reverses to break the trading range in the opposite direction, thus establishing a new pivot point. By picking a bottom, a trader can benefit by getting in early on a...
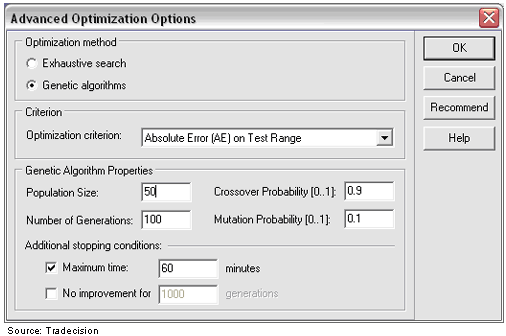
Neural networks are state-of-the-art, trainable algorithms that emulate certain major aspects in the functioning of the human brain. This gives them a unique, self-training ability, the ability to formalize unclassified information and, most importantly, the ability to make forecasts based on the historical information they have at their disposal.
Neural networks have been used increasingly in a variety of business applications, including forecasting and marketing research solutions. In some areas, such as fraud detection or risk assessment, they are the indisputable leaders. The major fields in which neural networks have found application are financial operations, enterprise planning, trading, business analytics and product...
Oscillators tend to be somewhat misunderstood in the trading industry, despite their close association with the all-important concept of momentum. At its most fundamental level, momentum is actually a means of assessing the relative levels of greed or fear in the market at a given point in time. Markets ebb and flow, surge and retreat - the speed of such movement is measured by oscillators.
Oscillators are most useful and issue their most valid trading signals when their readings diverge from prices. A bullish divergence occurs when prices fall to a new low while an oscillator fails to reach a new low. This situation demonstrates that bears are losing power, and that bulls are ready to control the market again - often a bullish...
Many people believe that the markets are random. In fact, one of the most prominent investing books out there is "A Random Walk Down Wall Street" (1973) by Burton G. Malkiel, who argues that throwing darts at a dartboard is likely to yield results similar to those achieved by a fund manager (and Malkiel does have many valid points).
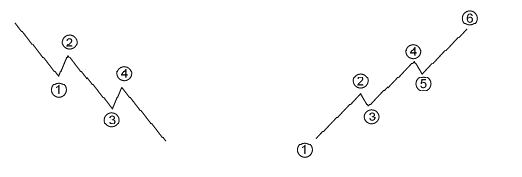
However, many others argue that although prices may appear to be random, they do in fact follow a pattern in the form of trends. One of the most basic ways in which traders can determine such trends is through the use of fractals. Fractals essentially break down larger trends into extremely simple and predictable reversal patterns. This article will explain what fractals are and how you might apply them to...
Being of Prussian descent, I’ll admit to a certain fascination for all things Teutonic, especially in the field of technical analysis. One of these is the Hindenburg Omen (HO), a fairly obscure indicator named after the German zeppelin that crashed in a fiery explosion in May 1937. The urban myth surrounding the HO is that it accurately predicts market crashes.
The creation of the HO dates to the 1990s and is generally credited to a blind former physics teacher named Jim Miekka who died in 2014. When the HO flashes a signal it is often front page news in major financial newspapers.
Miekka claimed in a 2011 interview that the Omen has appeared ahead of every market crash in the U.S. from 1987 but he also admitted that not every...
A view of the forest (from the top of the tallest tree)
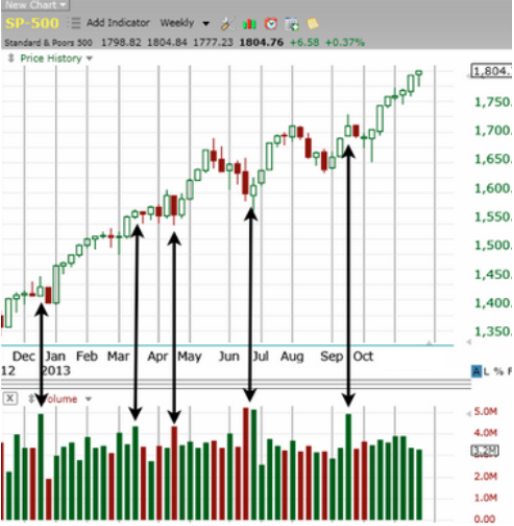
There was a time when volume data wasn’t available until a day or days after a trade. But in today’s electronic age, live volume is at our fingertips. The beauty of volume as an indicator in live trading is the fact that it is the ONLY leading indicator among the hundreds of possibles. Everything else derives value from what price is doing, lagging the price action. That means changes in volume can impact what price will do before it happens.
Volume plays such an important role in our trading, we mustn’t neglect the messages it sends. For example, one key to this important strategy is the function of volume spikes. It is these spikes that suggest possible market turns. The chart...
In the late 1950s, Nicolas Darvas was one half of the highest paid dance team in show business. He was in the middle of a world tour, dancing before sell-out crowds. At the very same time, he was on his way to becoming a long forgotten Wall Street legend, buying and selling stocks in his spare time researching only in Barron's weekly newspaper and using telegrams to communicate with his broker. However, Darvas turned a $36,000 investment into more than $2.25 million in a three-year period. Many traders argue that Darvas' methods still work, and modern investors should study his 1960 book, "How I Made $2 Million In The Stock Market". Read on as we cover the Darvas Box trading method.
Darvas Who?
The path Nicolas Darvas took to stock...
In order to consistently make money in the markets, traders need to learn how to identify an underlying trend and trade around it accordingly. Common clichés include: "trade with the trend", "don't fight the tape" and "the trend is your friend".
Trends can be classified as primary, intermediate and short term. However, markets exist in several time frames simultaneously. As such, there can be conflicting trends within a particular stock depending on the time frame being considered. It is not out of the ordinary for a stock to be in a primary uptrend while being mired in intermediate and short-term downtrends.
Typically, beginning or novice traders lock in on a specific time frame, ignoring the more powerful primary trend. Alternately...
There is more to the world of Fibonacci than retracements, arcs, fans and timezones! Every year new methods are developed for traders to take advantage of the uncanny tendencies of the market towards derivatives of the golden ratio. Here we will discuss some of the more popular alternative uses of Fibonacci, including extensions, clusters and Gartleys, and we'll take a look at how to use them in conjunction with other patterns and indicators.
Fibonacci Extensions
Fibonacci extensions are simply ratio-derived extensions beyond the standard 100% Fibonacci retracement level. They are extremely popular as forecasting tools, and they are often used in conjunction with other chart patterns.
The chart in Figure 1 shows what a Fibonacci...
The Fibonacci studies are popular trading tools. Understanding how they are used and to what extent they can be trusted is important to any trader who wants to benefit from the ancient mathematician's scientific legacy. While it's no secret that some traders unquestionably rely on Fibonacci tools to make major trading decisions, others see the Fibonacci studies as exotic scientific baubles, toyed with by so many traders that they may even influence the market. In this article we'll examine how the Fibonacci studies may influence the market situation by winning the hearts and minds of traders.
The Famous Italian
It was during his travels with his father that the Italian Leonardo Pisano Fibonnacci picked up the ancient Indian system of...
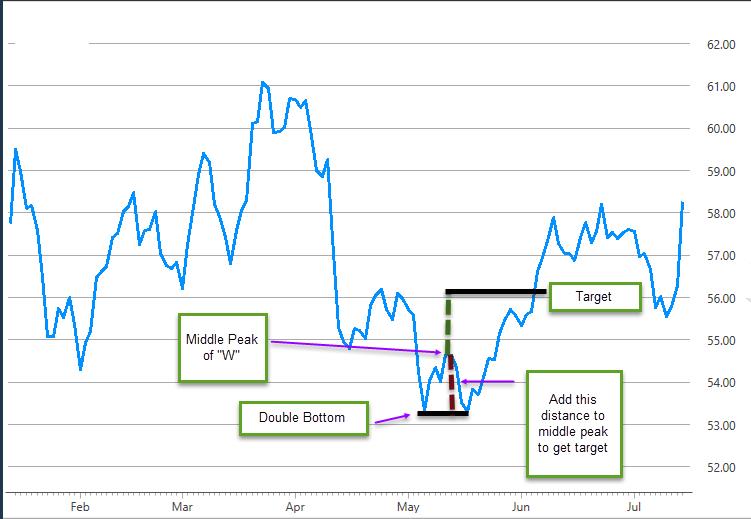
Most traders who have even a passing acquaintance with technical analysis have heard about a classic chart pattern called the double bottom. It looks like a “W” on the chart. The standard trading methodology suggests buying when the stock breaks out past the middle peak of the W” and setting an initial target by adding the distance between the bottoms and the middle peak to the breakout price. (See figure 1). By buying the breakout a trader is hoping for a higher probability that the stock will reverse as opposed to going sideways. However, the temptation is always there to try and enter the trade earlier and capture some of the move up from the second bottom to the middle peak, which can sometimes be substantial, especially when...
When it comes to trading, most of it is done by making a directional bet. In other words, if the probabilities are high that the market will decline, we short it anticipating we will make money as it moves lower. Conversely, when the prevailing odds are that a given market will move higher, we buy it with the hope that we will sell at higher prices in order to garner a profit. In addition, to exercise sound risk management we will cut our losses swiftly if the market proves us wrong. This is conventional market speculation.
There is however, a lower risk method to participate in the markets. This method is not as widely known, or practiced for that matter, but can be a viable method to making money in any market. What I’m referring...
The answer is, because “simple” works, but that’s not enough information to fill up an article. So, let’s take a look at some unrelated examples to really see if “simple” is the best approach to most of the things we do.
Have you been to a gym lately where they offer personal training? I have been going to the gym for as long as I can remember and my routine has not really changed much over the years. These days, however, I see some interesting exercises going on during personal training sessions around me. I see people standing on one foot, on a big rubber ball, doing arm curls. The first time I saw something like that I thought of the circus. Just the other day I was bench pressing and to my left I saw this man walking toward me with...
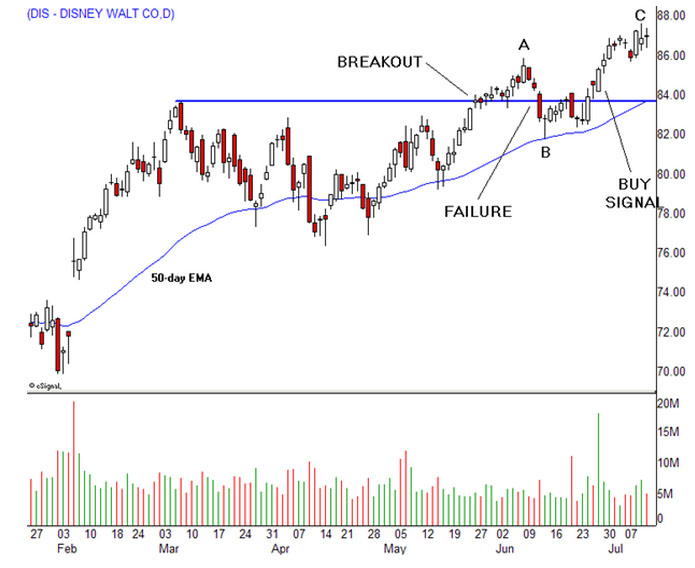
The best trade could be in the opposite direction when a classic price pattern doesn’t behave according to perfect rules outlined in popular books and web sites. In fact, well-known patterns such as the head and shoulders and bull flag have clearly defined levels that can trigger trade entry signals that are contrary to the direction in which they're naturally leaning. Alex Elder examined this phenomenon with his Hound of the Baskervilles signal in Trading for a Living when he highlighted a head and shoulders neckline that just wouldn’t break, encouraging observant traders to jump into long positions, rather than following the herd and selling short
We're taught early in our trading careers to buy breakouts and sell breakdowns, but...