You are using an out of date browser. It may not display this or other websites correctly.
You should upgrade or use an alternative browser.
You should upgrade or use an alternative browser.
Articles
What is Market Profile?
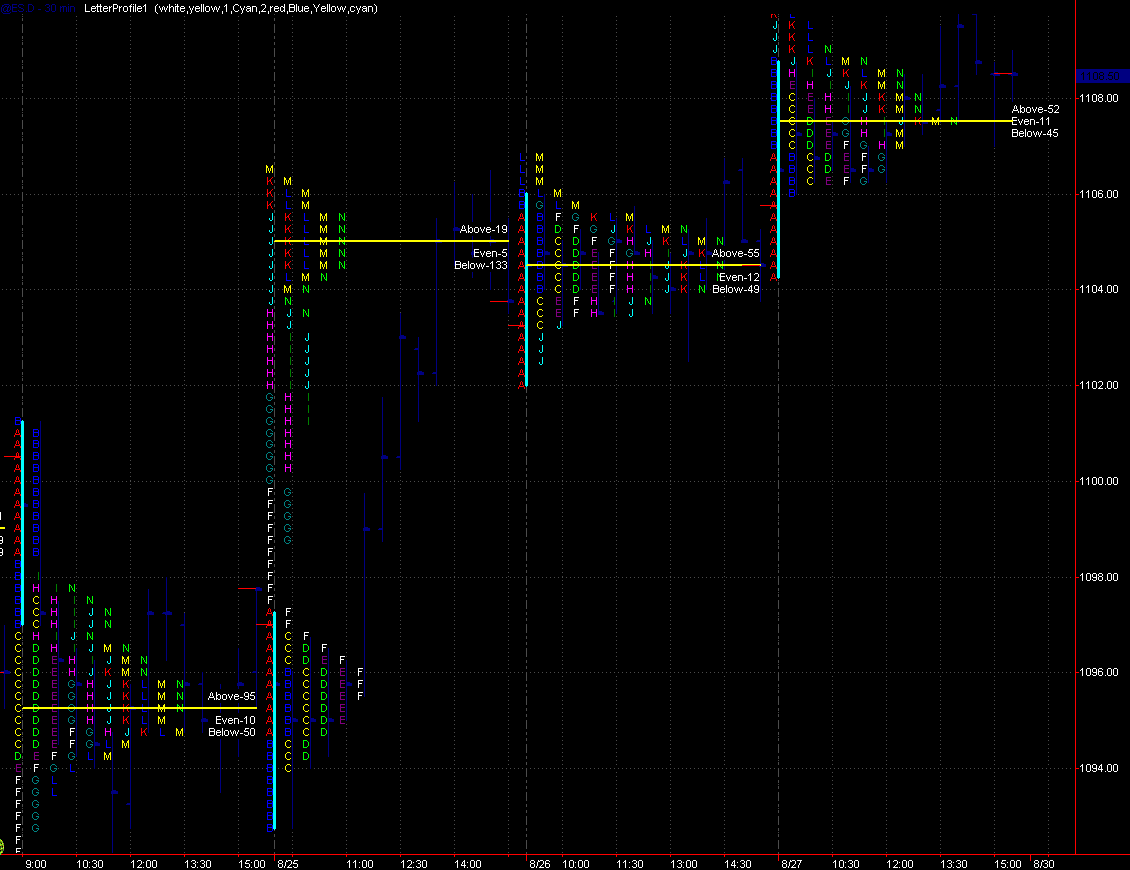
Everyone has seen conventional volume displayed as a vertical bar underneath the price bar. But the most important information that this cumulative tally of total volume omits to tell you is at what individual prices the trades that make up this volume were traded at. Knowing what prices traded the biggest volume can give you a significant edge with regards to understanding what price levels traders see as significant now, and likely will again if market price trades back in the same area.
In its simplest form,
Market Profile is a graphical organisation of price, volume and time information. Market Profile displays price on the vertical axis and volume/time on the horizontal axis. In the conventional legacy...
Many traders will rather play a pullback than a breakout of the highs. In fact some research by Larry Connors in the US showed that on the
S&P in a ten year period from 1993 if you had bought 10-day-high breakouts and exited when prices crossed the 10 day moving average you would have lost over 312 points.
However, during the same time if you had bought every 10-day-low and exited when price crossed its 10 period moving average then you would have made over 830 points. Many trade the breakout of the highs but as Connors says "In reality it appears to be very wrong."
Although playing breakouts can be said by others to be a valid tool in a trader's tool kit, many often find that what they perceive as a breakout is actually a swing...
One of the most mysterious and elusive methods of charting price action for most traders is
Japanese Candlesticks. This is one of the oldest methods of charting dating back 400 years in Japan!
This article is on a specific candle pattern called the Doji. Recognizing it is pretty straightforward. There are several Doji formations, the Dragonfly, the Gravestone and the Rickshaw. The significance behind a doji is the market price establishes a range and closes almost exactly where it opens. Give or take a tick or two in most cases. Doji's help form two and three candle formations that can develop into more powerful and trust-worthy signals once identified.
Doji's indicate indecision, the market ends where it began. Confidence is lost...
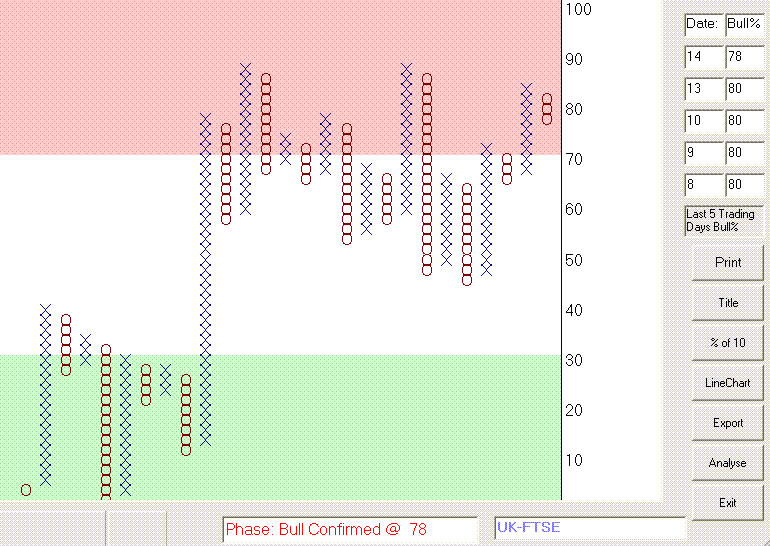
Point and Figure (P&F) charting has been around for well over a century, occupying a bit of a niche. It tends to be an area that some get quite heavily into, while a fair percentage of the non-users look at it now and again and regard it as something they'd quite like to get the hang of but never seem to get round to it. As what it does for traders today is far more important than whether Dow used it in 1903 (in my view at least) that's it for the history lesson.
P&F charts go left to right, with columns of X's and O's showing periods when the price was climbing or dropping. That's not all that dissimilar to most other chart styles - where P&F deviates somewhat is in the fact that a column can last anything from a day to weeks, months...
1. Introduction
A trading strategy is simply a pre-determined set of rules that a trader has developed to guide their trading. The advantages to the trader of developing a trading strategy are:
However, developing a trading strategy that is effective can become a complex process. There are computer programs available (such as TradeStation and WealthLab) which aim to automate the process. Unfortunately the ease with which systems can be developed and optimised using these programs can mislead the unwary trader. Fundamentally a strategy must be built around some kind of statistical edge. It is this edge that will play out over time and create positive cashflow for the system and the trader.
In this article, which will be published in...