You are using an out of date browser. It may not display this or other websites correctly.
You should upgrade or use an alternative browser.
You should upgrade or use an alternative browser.
Wallstreet1928 Analysis & live calls on FTSE,DAX,S&P...aimed to help New traders
- Thread starter wallstreet1928
- Start date
- Watchers 252
- Status
- Not open for further replies.
Geofract
Experienced member
- Messages
- 1,483
- Likes
- 112
Short again at 3930 - sl 3960... might be wrong move though. target 3915
edit - short at 3933
Seems to me going higher will depend on the US. If the US makes a new high above 825.1, then I'm probably in the sh*t
dawntrader1
Member
- Messages
- 65
- Likes
- 0
went long ....again 3927 .stop at 3905
bought at 3927
i'm back...looks like its playing out nicely..i'm going to hold this until the parab sar stops me...it is currently above my break even level by a bit so i'll make something at least even if this market decides to tumble!
Geofract
Experienced member
- Messages
- 1,483
- Likes
- 112
Short again at 3930 - sl 3960... might be wrong move though. target 3915
edit - short at 3933
Closed for - 6, as it seems I might be playing a dangerous game, whilst waiting for news.
Thanks for heads up on the news RennieAMR
Thanks for heads up on the news RennieAMR
That was fun. 100 points down and 100 back up on the SPX. I managed to capture 70 of them. 🙂
It's always worth keeping an eye on the economic calender. It's a trader's market!
wallstreet1928
Legendary member
- Messages
- 6,609
- Likes
- 89
That was fun. 100 points down and 100 back up on the SPX. I managed to capture 70 of them. 🙂
It's always worth keeping an eye on the economic calender. It's a trader's market!
well done chaps
some good trading there
815 bounce on the S&P was just too tempting .............haha
Geofract
Experienced member
- Messages
- 1,483
- Likes
- 112
That was fun. 100 points down and 100 back up on the SPX. I managed to capture 70 of them. 🙂
It's always worth keeping an eye on the economic calender. It's a trader's market!
Yes, quite right on the calender front - somehow that often slips my mind.
Well done on the 70 points, damn fine!
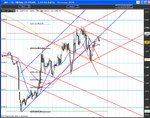
Updated 10 min chart attached. Seems all my shorts were pull backs after all, still, for a choppy market that was a reasonable day for me. I think I'm making good progress with drawing my TA lines too, they are all in the right place at least 🙂 And fib projection was almost hit too. Going with the trend would have been an easier ride though... I'll accept that one day!
Well done to WS on the Barclays play btw, very nice!
edit - obviously a few lines where added since this morning, but the major lines remained unchanged.
Attachments
Yes, quite right on the calender front - somehow that often slips my mind.
Well done on the 70 points, damn fine!
It was a nice percentage of the move to pick up with minimal risk alright - for me anyway. I'm getting nice results trading SPX using VWAP off a SPY chart while keeping an eye on the Fibs and MAs on the SPX. The FTSE just seems a bit flat at the moment.
That's one busy chart, BTW.
dawntrader1
Member
- Messages
- 65
- Likes
- 0
well done chaps
some good trading there
815 bounce on the S&P was just too tempting .............haha
Good day for me too......thanks for everyones views, analysis, charts, etc most helpful in decision making.
wallstreet1928
Legendary member
- Messages
- 6,609
- Likes
- 89
FTSE analysis 9th April 2009
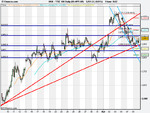
1 month, 1 hr chart
light blue lines- down trend seems to be broken
bias is on the upside as currently trading above 20 MA
next target is 3960 then 50 MA @ the dreaded 4000 figure
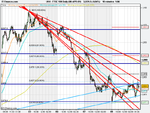
1 week , 10 min chart
this is what I always use to project the next days play even though 1 month paints a birds eye view
scenario 1 - wait(beware of fake break out and be patient) for light blue channel to be broken above 3940 and then go long upto 3960 and trail stop loss up to 3990
scenario 2 - if 3890 broken then i will go short up to 3860 ...........
Attachments
Last edited:
dawntrader1
Member
- Messages
- 65
- Likes
- 0
went long ....again 3927 .stop at 3905
closed this morning for 20 points........all done for the day until next week now :cheesy:
Dentalfloss
Legendary member
- Messages
- 63,404
- Likes
- 3,726
happy easter ws
and to all veiwers
and to all veiwers
- Status
- Not open for further replies.
Similar threads
- Replies
- 72
- Views
- 19K
- Replies
- 21
- Views
- 7K


