Wallstreet1928 Analysis & live calls on FTSE,DAX,S&P...aimed to help New traders

Status
Not open for further replies.
Nice spiders web WS 😉

Anybody have intraday volume for FTSE 100 through a broker by chance? I'm sure it would be easier to day trade if I had that info, perhaps I have to pay for it though.

Whilst the price moves up and down, I reckon only volume could indicate to me if the market is actually buying at whatever the price maybe, or if the move up/down is divergant. Hope that makes sense?

Anybody else agree?

Ollie

yes indeed i agree ...........

that's why we are all rookies
 
no wonder its a spiders web.we are in a neutral zone
trendline is up.latest column is down.the strong support areas are quite far away
 

Attachments

  • neutral.jpg
    neutral.jpg
    130.9 KB · Views: 113
i am off out to do a few chores

Happy trading my friends

S&P has failed and is headed to 810-812

FTSE is headed to 3860

will it hold the double bottom?

triple bottom for FTSE ......................TA states always sell triple bottom !!!

so lets see if we get to 3860 after hours
 
Last edited:
yes indeed i agree ...........

that's why we are all rookies

Ahh, you're not a rookie WS... I wouldn't ask you a question like that if you were! But I am a rookie, hence picking the experts brains.

I'm about to move house, but after that, I will try Pro-realtimes 1 week offer of free live data, which includes volume. I think it's only £40-60 per month depending on which data you want. Probably would pay for itself once I learnt to make decent volume studies.

There's no volume on Forex though, at least that's what I understand - because it's a different type of transacton.
 
no wonder its a spiders web.we are in a neutral zone
trendline is up.latest column is down.the strong support areas are quite far away

Dentist, I have heard you mention cycles before. What method do you use to calculate/analyse them?

I have been reading Fischer recently, who uses Time Goal Days, which s a bit like Fibs, but Fibs on time instead of price. So far, on daily charts this method seems to work quite well.
 
Ahh, you're not a rookie WS... I wouldn't ask you a question like that if you were! But I am a rookie, hence picking the experts brains.

I'm about to move house, but after that, I will try Pro-realtimes 1 week offer of free live data, which includes volume. I think it's only £40-60 per month depending on which data you want. Probably would pay for itself once I learnt to make decent volume studies.

There's no volume on Forex though, at least that's what I understand - because it's a different type of transacton.

this should clarify it for you

YouTube - inthemoneystocks's Channel
 
geo...i dont bother with cycles.i stick to p/f
makes life less complicated
i do use vertical counts,gives an idea of where it could end up.otherwise just the p/f signals
i have been using a slightly modified metod.taking the daily chart and updating it every 5 or 10 mins.this can be done automatically using ml downloader.the p/f chart changes its character on a low box size during the day.using 1 box reversal.if the character of that chart changes ,i use that then to look at the hourly.to confirm.you will not be able to see too much change in the character of the chart by updating the daily candles...i think

Sorry Dentist, I was sure both you and Tom Tom used cycle analysis - must have mis-read a few posts - opps!

Thanks for the p/f info though. I've started using a Renko chart in the last month or so, it's quite handy for removing noise, but I imagine p/f is superior - just I haven't taken time to learn to read p/f properly yet.
 
Hi all. This is my weekend analysis.

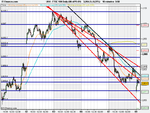
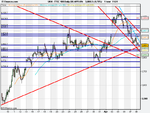
In the 2 FTSE charts here you can see we are on the monster trendline.

You will also see that this is a massive inverse H&S coming down the trendline. Essentially the descending triangle formation will breakout lower as depicted in the black chart. I am not sure, even with the huge bullish momentum we will go past 4160 just yet as 4200 is a resistance area.

If you are slightly more bullish. You can see there is also another inverse H&S where the right shoulder now starts to be put in. One would have thought we breakout over the monster trendline upto resistance @ 4330 to complete this move and put that shoulder in. After this in the black chart the scenario is bounce off 4330 down to 4000 and then bounce.

Afterwhich you can see 4670 ish would be the triple top in and then buy the pullback for that puppy as it will be liftoff like the nasdaq did this week.

enjoy.

just reviewing my black chart to work out what the hell my homework was!! how has everyones week been so far?
 
Target hit on barc and S+P.

well done my friend, we both hit out targets........👍

I am surprised that the banks are falling with the possibility of the uptick rule being passed tonight

I have taken the dip as a buying opportunity this morning on barclays
 
i am off out to do a few chores

Happy trading my friends

S&P has failed and is headed to 810-812

FTSE is headed to 3860

It looks like we got there in the end, FTSE only fell to 3880 only to bounce right back again

low volume fooled me once again, my last nights position was amened to break even when in profit of 20 ticks but only to break even again

It looks like the excitement of Alcoa didn't last long ..........

the reason for the drastic fall over night can be found here
Short Term Trading Live with Oscar WELCOME TO THE OMNI TRADING ACADEMY.
 
Bias is definitely on the down side according to my chart

I am short FTSE 3908 ............stop loss 3938
 

Attachments

  • 8th 9.00.png
    8th 9.00.png
    25 KB · Views: 121
Last edited:
Biased is definitely on the down side according to my chart

I am short FTSE 3908 ............stop loss 3938

taken 2 contracts at 10 points profit as market not falling as quickly as expected as investors trying to keep it afloat of 3900 ..... amended 1 contract to break even
 
1 month 1 hr chart ...........

everything seems to be pointing downwards for me

scenario 1 - I will continue shorting this market with stop loss 3930, I expect 3860, 3850, 3800 ultimately to be level on the downside

scenario 2 - if we break above 3930 I will be happy to play a scalp up to 3980
 

Attachments

  • 8th 11.05.png
    8th 11.05.png
    21.9 KB · Views: 114
Last edited:
is respecting 3850 key in deciding the major up trend of the last month?

possibly, but with low volume all week and with the holiday season upon us(major players may well be away) we can't really take any signals with conviction

but low volume = volatility
 
Status
Not open for further replies.
Back
Top