a beautiful scalp on oil there chaps
well done!!
im still looking for my 2nd trade, hasnt come to me yet.
a beautiful scalp on oil there chaps
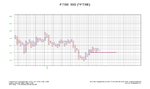
head and shoulders on ftse. still thinking 3930 🙂. havent traded all day so...
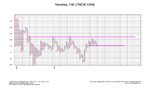
I am short S&P 898.4 ...stop loss 802.4
we just can't stay afloat 800
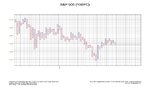
Goldman failed to get over 110
ws
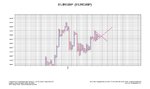
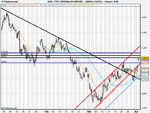
update on the triangle forming o eurgbp